J
usti
na
Nai
nyte
CULTURE
BOUNDARI
ES
I
N
SEMANTI
C
WEB
Master
of
Geospati
al
Technologi
es
University of Muenster
Institute FOR Geoinformatics
Ma
s
t
e
r
The
s
i
s
:
CULTURE
BOUNDARI
ES
I
N
SEMANTI
C
WEB
S
upe
r
v
i
s
or
s
:
T.
Ka
up
p
i
ne
n
(
I
FGI
)
E.
Pul
t
a
r
(
UJ
I
)
M.
Pa
i
nh
o
(
I
SEGI
)
S
t
ude
nt
:
J
us
t
i
na
Na
i
ny
t
e
PLAGI
ARI
S
M
DECLARATI
ON
I understand that plagiarism is wrong as it is using another’s work and to pretend that it is ones own.
To the best of my knowledge and belief, this thesis is my own work and all source have been properly acknowledged.
I have used the American Psychological Association (APA) as the convention for citation and referencing. Each significant contribution to, and quotation in this thesis named „Culture boundaries in Semantic web” from the work, or works of other people has been attributed and has been cited and referenced.
I also confirm that I have not previously submitted this work or any version of this work in any other University or institution.
SIGNATURE:
Table of Contents
1 INTRODUCTION...5
2 Culture area cognition and representation...8
2.1 Culture and culture area perception in social sciences...8
2.2 Culture boundary concept definition and fuzziness...11
2.3 Culture area and culture boundary visualization ...14
3 Culture field representation in semantic web...19
3.1 Semantic web importance for culture domain...19
3.2 Culture area and boundary problematics in semantic web...21
3.3 Visualizing cultural data from semantic web...24
4 Methodology of work...26
4.1 Workflow...26
4.2 Used research methods...28
5 Culture boundary spatio-temporal modeling and visualization for a case study in Lithuania...30
5.1 Vocabulary modeling for culture area representation...30
5.2 Vocabulary implementation and testing for a case study...34
5.2.1 A case study: culture areas in Lithuania ...34
5.2.2 Data collection for vocabulary implementation...36
5.2.3 Interactive web visualization of data...38
5.3 Visualization interpretations and insights for future work...41
6 DEDUCTIONS...43
ABSTRACT
1 INTRODUCTION
The question of boundaries of cultural areas have always been the study of social sciences
having a great discussion on both subjects: the concept of boundary as well as the concept of
culture area. Discussion on cultural area concept within social scientists got really popular last decade due to cultural area association with social and ethnical identity areas and related problems
such as immigration, racism, group rights. For same problems the boundary question in between
such different groups is always an interesting research. Remarkably, empirical social research
focused on boundaries as itself can generate insights of general social processes and phenomena
like boundary shifting, boundary crossing, territorialization, relocation and so on. (Lamont &
Molnár, 2002).
Such phenomena is hard to study in geographical space and therefore boundary question is
often dismissed by geographers, especially such question as the culture boundary visualization. In
case it is touched, culture areas are represented individually by different scientists and it is often a
case, a common agreement on one boundary of one culture is never achieved. The author suggests
that it is due to unclear perception and definition of boundary itself. So within this thesis a cultural
boundary cognition is analyzed from different sciences perspectives to understand the variability
well. Such knowledge is needed to be able to define boundary clearly for better interoperability
between different fields of sciences as well as different languages as culture is often researched
nationally or even locally.
Together with technology development the demand of data on web had initiated the
digitalization process that has bloomed within the cultural sector as well. In Europe it was
strengthened with European Commission juridical documents (“EUR-Lex - SEC/2008/2372,” 2008)
and so many archive collections, usually related to the culture, were digitized. Though new juridical
documents have recently appeared promoting the open data as a new engine for innovation
(“EUR-Lex - 52011DC0882,” 2011). It partially shows that the interoperability which was expected in
earlier documents wasn't reached even in Europe, that is nothing to talk globally. No-one knows if
new documents will really help to reach the goal of data being open. Though the solution already
exists that was proposed back in 1997 by T. Berners-Lee searching for the web of trust or web of
logic. The semantic web was presented and became like a movement for the interoperability of data.
Semantic web dealing with meanings in restricted sense is very much important for culture as it
faces much larger challenge “to re-present changes in ways of knowing; changing meanings in
After getting to know the variables of the topic and the diversity of it, one can easier raise
and formulate new questions and search for solutions. Therefore, after over-viewed some cultural
topics and noticed the lack of literature on culture boundaries from different perspectives, the main
and quite abstract way of the thesis was formed.
The aim of the thesis: to contribute to the development of the Semantic Web for Culture with a culture area and boundary representation.
Following with three goals: 1) to overview the literature on cognition as well as representation of culture area and culture boundary; 2) to discuss a culture area representation in
semantic web which already results in modeling a new vocabulary for cultural boundary; 3) to
create an interactive visualization of culture areas in semantic web as a suggestion for possible
representation.
According to exposed question the thesis structure was built. The 2'nd and the 3'rd sections
are used to overview and to discuss the literature. 2'nd section is for the culture related literature and
section 3'rd is for the culture domain in semantic web. The semantic web importance for culture
domain is analyzed to come to the main question of culture area representation in semantic web
nowadays and what are the problems. Existing ontologies and vocabularies are overviewed
searching for solution of that specific question.
The discussion of the work and the methods used to reach the depicted results are
described in the 4'th section of the thesis. Firstly the work-flow is depicted with difficulties
confronted and the goals reached. Secondly a methodology is described, from information
collection and analysis up to the software engineering.
Further follows the results of the work described in the 5'th section of the thesis.
Vocabulary created for culture boundary representation in semantic web is presented and described.
For testing the vocabulary the case study is done using the example of Lithuania which is chosen
due to the previous research done on a topic by the author. Shortly the data of the case study is
presented depicting the culture situation of the Lithuania of chosen time to give the idea what
problems the author is seeking to solve. The data used in the work is collected by the author itself
just for illustration. At the same time such situation as collecting raw data by the researcher itself
well depicts the real situation that during the digitalization boom still there are lot's of data not
digitized and so lots of data not freely available, what in turn does not fulfill goals the European
Union, together and all countries members, raise. Lastly the visualization is done and so it is
presented as the last step of the thesis. During the work new ideas have come and so the thesis is
finished with some advises and notes for future work on culture area topic.
aspect, but also from the temporal, reminding that when talking about boundaries one can talk about
the space as well as the time. Within this thesis the author would like to restrict the focus on cultural
spatial boundaries. As first of all, the temporal boundaries have already been disused from the
semantic perspective (Kauppinen et al., 2010). Second, there was no data available, as well as there
are not much literature to have a great background talking about it bias. It should be stressed that in
general cultures tend to have different fuzziness due to their own features, the environment,
neighborhood, time they appear. For this reason the generalizations from one example can be not
suitable for all cases and so the author representing the Lithuanian case, does not make the
generalizations about culture boundaries. The example of a case is used to test the culture boundary
2 Culture area cognition and representation
2.1 Culture and culture area perception in social sciences
Culture understanding is widely varying across different social sciences, that have emerged
just after the enlightenment age and so has a very short philosophical history. But the word and
concept itself is much more older, which we can already see from the etymology of culture, coming from Latin cultura for cultivating as can be found in any etymological dictionary (Harper, 2011).
The enormous variety of culture definitions was already noticed a half of century ago by
American anthropologists that wrote a critical review on this concept over-viewing the history of
word 'culture' and presenting over 160 classified definitions (Kroeber & Kluckhohn, 1952). It is
possible we have so many different views of culture as it is considered to be “the most central
problem of all social science” (Malinowski & Leopold von Wiese, 1939). So each social science
focusing on different aspect define their research problem – culture – slightly differently.
One of the most important definitions of culture was formed by E.B. Tylor in early 1870 as
“Culture or Civilization, taken in its widest ethnographic sense, is that complex whole which
includes knowledge, belief, art, law, morals, custom, and any other capabilities and habits acquired
by man as a member of society.” (Tylor, 1871). By this definition the word culture with it's
scientifically technical meaning and was established, notices American anthropologists (Kroeber &
Kluckhohn, 1952). It became the most quoted one (Gísli Pálsson, 1993) and many other definitions
have been modeled on it1 (Gísli Pálsson, 1993; Kroeber & Kluckhohn, 1952).
Anthropological definition of culture talks us about the complexity, but we can see just the
social aspect of culture - culture existing in a man. Some anthropologists emphasize social heritage
considering culture as the sum of the “social heritages <...> and of the historical life of the group”
(Park & Burgess, 1921) or “inherited artifacts, goods, technical processes” together with not
material culture (Seligman, 1930) . Within anthropological definitions we usually do not find the
spatial concept in the definition or explications while they are the 'biggest writers' on culture and
cultural boundary questions.
The ethnologists perspective meanwhile is already spatial since culture they interpret as a
feature of a particular ethnical group that differentiates from another ethnical group (Oed,
1989) and so ethnical group has a homeland that is “connected with a specific geographical area”
(Abel, 2003). This gives a spatial view of ethnical group with a link to culture as a feature so it can
1 Kroeber and Kluckhoh differentiate a section “Broad Definitions with Emphasis on Enumerator of Concept: Usually
be interpreted that culture as a feature should also have a spatial or territorial aspect. But with a
concept of ethnical group, “a membership which identifies itself and is identified by others”
(Vermeulen & Govers, 1994), comes the fuzziness. It is hard to define properties that are used to
identify, they can have different qualitative and quantitative importance, differently perceived by
ethnic group itself and the others that differs. Nevertheless ethnical groups are often the ones
analyzed territorially, and so it is the most common principle visualizing the spatial distribution of
culture.
With spatial understanding of the culture through ethnical studies in the 19'th century the
culture-historical approach of the prehistory got popular and a new concept of archeological culture
was introduced. Without a clear explanations many European scientists, as well Lithuanian ones
(Tautavičius, 1987; Volkaite-Kulikauskiene, 1987; Žulkus, 2004) began to draw “an explicit
analogy between the numerous geographically restricted remains <...> and ethnographic cultures.”
Labeling prehistoric material assemblages as cultures mostly happened where had been a
longstanding interest in tracing ethnic identities (Trigger, 1989). V.G. Childe who worked in Europe
with such an ethnic mix in such a small territory suggested to call such complex of certain types of
remains as cultural group or just culture (Childe, 1929) and so archeological culture twisted with
culture carrying more fuzziness on the concepts. Luckily nowadays it's already clear that
archeological culture is not identical with a culture inherent for an ethnic group. “Burial pattern is
not a direct behavioral reflection of social pattern” as artifacts are cultural, but not social by itself
and do not reflect cultural-social complexity because archeology is not a social science. It is more
historical discipline from the British pre-historians point of view (Hodder, 1982).
Through ethnical and archeological approach that both gives a spatial profile of culture,
probably the most important work should have been done by geographers analyzing cultures within
their territories. Geographers in culture got interested just in late XIX'th century focusing on the
environment and culture artefact at one glance. At that time cultural geography was developing fast
and thus a lot of different concepts have appeared. One of the first cultural geographer C.O. Sauer
believed that culture can be identified through the landscape, it was even called “'the agent' creating
landscapes” as a practice of human (Sauer & Leighly, 1963). The cultural landscape concept was
presented for the description of natural landscape with material things laid by humans. Later the
definition centered on the significance and value of human practices. Then the role of politics was
stressed and it come to the idea of cultures as 'texts' meaning not just written texts, but in general
the idea of interpretation and the idea of interpreting landscapes along with other processes and
institutions constituting them (J. Anderson, 2009).
geographic phenomena with a spatial extension having the area or territory and so geographers were
creating spatial culture distribution theories. The very first who had drawn links between culture
and territory was the German political geographer and ethnologist F. Ratzel. He contributed to the
diffusionistic theory creating a culture circle concept – kulturkreis, believing that culture traits are
created in one area and then they spread encompassing other societies. Further this concept was
developed into a theory by L. Frobenius who was exploring patterns of such diffusion. Later
kulturkreis approach was found too limited as it was standing for one culture, the most capable, having a racist attitude (Erickson & Murphy, 2008). Afterward C. Wissler developed a cultural
area concept from just geographical grouping towards specific social grouping for cross-cultural analysis. He described cultural area as internally dynamic with an innovative cultural center and
externally prevented by physical barriers, cultural habits and psychological characteristics from
close relations with the tribes of other cultural areas (S. A. Freed & Freed, 1992). The approach of
the strongest properties being created in the center of the area of culture is often leaded.
Parallel to cultural area a cultural region concept was created, with differentiation into
formal, functional and vernacular. Looking at the formal region definition “an area inhabited by
people who have one or more traits in common, such as language, religion, or a system of
livelihood” (Domosh, Neumann, Jordan-Bychkov, & Price, 2009) it looks alike to ethnical group
area. Though in the cultural region the properties to define a region are more generic as the purpose
is to define a region. Anyways which properties are the important ones to define a region depends
just on the geographer and on the specific purpose of the research. But just the ones that talk about
regions starts talking about locating borders and border zones.
Looking at the culture definitions, none of them are directly talking about area or
boundaries, neither looking at it as a phenomena having spatio-temporal features. Instead it is often
treated as a property of society or social group or even landscape and so the property distribution is
analyzed spatially searching for some patters. And despite how we are going to call the distribution
of some culture - region, territory, area or even district – from ontological perspective it stands for
the same idea (Couclelis & Gottsegen, 1997).
Thus following to be clear the definition of culture used in this thesis is given, as a social
phenomena expressed by society through some complex pattern that occurred in some time in some
space. Which means that it can be understood as a spatio-temporal phenomena with its area and
2.2 Culture boundary concept definition and fuzziness
In general the idea of boundary have preoccupied social sciences since last three decades
and mostly political sciences which clearly present three related concepts: 'frontier', 'boundary' and
'border'. Frontier is defined as the precise line at which jurisdictions meet, usually demarcated. The
term border can be applied to a zone, usually a narrow one, or it can be a line demarcation. And
boundary is used to refer to the “line of delimitation of demarcation” and this the narrowest of the
three terms (M. Anderson, 1982). Since then the definitions have varied as concepts are
fundamental to disciplines. In social sciences the most common is a boundary concept, which is
often understood and analyzed just socially and sometimes can have territorial counterparts (Barth,
1969).
Boundary concept is the most suitable for cultural area definitions and it is the least
defined one, bringing again fuzziness to the topic. The concept, according to A. Stroll is
„pretechnical or at least non technical“ and „in a prejorative sense of the term, we can say that it is a
concept that belongs to folk physics or folk semantics“ (Boniolo, Faraldo, & Saggion, 2008). So from social side it was always used nontechnical and logical approach with formalization was done
by mathematicians and computer scientists, which means the dialog in between was hard to find.
Therefore following for boundary formalization the cognitive and computational approach is
presented.
Defining boundary of the culture as phenomena means having some kind of geometry of
culture distribution. The property of geometry is inherent just for the objects, as one kind of
geographical model, but it is hard indisputably to claim culture being an object. The common
understanding of objects is they are human artefacts with clearly defined boundaries and on the
other hand we have fields representing nature of things, physical discontinuities notices H.
Couclelis (Couclelis, 1992). Having those two mental models objects or entities vs. fields, that
represents any geographical variation (M. Goodchild, 1994), it is hard to credit culture to one of
them. After all culture as a social phenomena is kind of continuous all over where humanity exists,
but depending on the definition it can defined as occurred just at some space some time. But not
trying to solve the question where culture should belong to as a phenomena, in this thesis the author
generalize the culture into an object.
It is observed that the object models (or entity) have more in common with everyday
human spatial cognition than the field models (M. Goodchild, 1994). Besides, every natural object
turns into an object just after it is drawn, meaning digitized and so gets its' clear geometry with
certain pattern. But it is important to stress that cultural area is not an object by nature neither it is a
natural phenomenon that area and boundaries could be pictured remotely or recorded anyhow
differently using nowadays technique. Culture boundary by itself exists just when it is drawn. The
scientist just makes a decision to lie it depending on his own observations and studies on cultural
agents he supposes to be the most significant for such and such culture area. That is the main point
how it differs from other fuzzy boundaries, that are observed differentially and differentially defined
and for such scale and the concept definition are the main factors of boundary fuzziness. While the
fuzziness of culture boundary comes from sightly different resources.
Despite the scale for culture boundary fuzziness is important as for any phenomenon
occurring on the earth, it is not the main reason. Exceptionally for culture phenomenon main causes
of fuzziness are the agents used for the culture area identification and scientists drawing boundaries.
The agents cause the fuzziness due to their uneven distribution. As well as it is often the agents are
not fully investigated and so they are with different importance, having different weight in forming
the boundary. Or different investigation methods are used and so different information could be
deducted, or investigation methods are with different precisions. As well as different investigation
methods could be used just because different agents are being investigated like material and
non-material. All over having so much different agents carrying inconsistent information it is hard to
make any kind of statistical analysis and so make clear and unarguable conclusions. When talking
about the composition of agents that forms the culture pattern, the fuzziness comes from scientists
as they personally make such choice. Despite groundings and reasons, due to different choice of
agents used for investigating the culture pattern area different boundaries of 'the same' or - the same
name having - culture can appear. Even in the case when scientist is using the 'full' composition of
agents, that is always just the ones possible now as the completeness of agents describing the
culture pattern is impossible. And quite often the choice of agents is done due to different focus on
particular social science or particular attitude and so different boundaries are produced.
Nevertheless scientists still try to visualize cultural areas analyzing the pattern of the properties like
cultural artefacts and so determine the boundaries.
And so naturally we understand cultural boundary being unclear, undefined and definitely
not crisp as it never bounds all the elements of agents that belongs to the set, having elements inside
the set that does not belong to that particular culture as well as having the elements far outside of
the area. As well as culture itself is a vague concept as explained a bit earlier. But the theoretical
and practical side of vague cultural concept was never analyzed by social scientists. Mathematicians
already half a century ago introduced a fuzzy set (Zadeh, 1965) where by definition each set
framework for generalizing many concept of topology, like union, intersection, containment,
neighborhood and similar, that can be named fuzzy topological spaces (Chang, 1968). Decade later
a fuzzy boundary was defined as the union of all boundary points that are fuzzy points of a fuzzy set
(Pu & Liu, 1980). Further studies on fuzzy boundary and it's properties have been raised very
recently (Athar & Ahmad, 2008), as well as on fuzzy regions and topological relations (Du, Qin,
Wang, & Li, 2005; Tang, Kainz, & Wang, 2010), but with not so much focus on culture.
Th. G. Whitley was the first to present crisp and fuzzy boundary concepts (as two different
types of boundaries) from cultural side, though mostly from archaeological. The author underlines
that archaeologists interpret boundaries as simply as possible. It might be for this reason they were
the first to talk about spatial boundaries from theoretical logic side and apply for a particular case
using GIS solving the fuzziness by thresholds and producing crisp boundaries (Whitley, 2004). But
no other papers were written explaining how to define the culture boundary, neither how they
themselves are doing that or how it should or could be done technically.
In generally it observed that humans tend to transforming everything into a crisp classes
(Kainz, 2010), so that's where from the tendency of defining any boundaries as crisp is coming.
Moreover such are easier to manipulate in the geographical systems which are exactly created for
applications and so it is much more often we try to categorize everything to objects (Couclelis,
1992). In this case it is easier if one could define the concept clearly and determine the culture area
as a polygon with a crisp set with all the elements that belong to that set. Following, the boundary
of crisp set is also crisp (Kainz, 2010).
Despite the discussion how to define the boundary further question is how to represent and
to visualize it as the best understanding of spatial distribution is the visualization. And so following
the question of how to visualize is raised regarding the nowadays interactive visualization
possibilities, not just paper ones anymore.
2.3 Culture area and culture boundary visualization
Humans are geographical beings always orientating themselves and so visualization in
general is a powerful strategy for leveraging the visual orientation (Miller & Han, 2001). And so
focusing on the culture, we can find various different visualizations from simple 2D paper maps to
the augmented 3D reality, all for the same purpose of presenting and explaining. Both are using
graphics for the reason of visual thinking and visual communication with a user as it is created fro
him. Nevertheless their roles and features of explaining obviously differs: while paper map is great
in depicting the abstract view with some emphasis on required features, interactive 3D visualization
Recently together with a digitalization process of cultural objects a lot of projects appeared
presenting 3D techniques for cultural heritage representation (Gruen, Remondino, & Zhang, 2006;
Manferdini & Remondino, 2010; Remondino, 2005). Besides there were studies on 3D landscape
visualization as well as on cultural landscape visualization (Griffon, Nespoulous, Cheylan, Marty, &
Auclair, 2010). And it seems like cultural area with its vague concepts have been forgotten recently.
Sadly it's true as for cultural area the geographical data of polygons are needed which haven't got
any attention during the urge of cultural heritage object data digitalization in Europe due to EU
projects. Though it is very much related, the cultural objects that are digitized have mostly lost their
place of identity or place of manufacture, but they have their value due to being in the museums
which makes it much easier to register. At the same time, nobody can register the boundaries and
apparently they cannot be exposed in museums and thus for now forgotten.
The peak of some cultural boundary visualization on paper maps were together with the
research on ethnical groups and
archaeological cultures as well
as regional approach in
geography. In generally cultural
boundary visualization should
be the research question of
cultural geography, but often
the focus was on the cultural
objects, not on the synthesis.
Different maps were created
representing different cultural
areas, regions, boundaries using
different thematic cartographic
techniques.
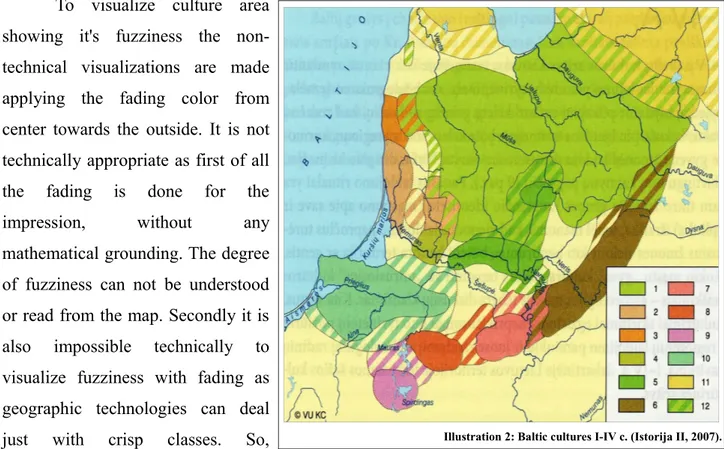
Sometimes areas are not really marked, just naming an approximate location where that
culture can be found or was found as it is visualized in the picture below (Ill. 1). Or t he most
common one, as have been noticed, is a simply marking the area with an approximate poly-line, that
can devolve into dashed line or sometimes disappear at all, like when bumps into the national
border. Though it also common to make the chloropleth maps that cartographically are the most
common visualization of areal phenomenons, differentiating the areas with a color or patterns
To visualize culture area
showing it's fuzziness the
non-technical visualizations are made
applying the fading color from
center towards the outside. It is not
technically appropriate as first of all
the fading is done for the
impression, without any
mathematical grounding. The degree
of fuzziness can not be understood
or read from the map. Secondly it is
also impossible technically to
visualize fuzziness with fading as
geographic technologies can deal
just with crisp classes. So,
sometimes areas are tried to bound with crisp boundaries and just at the very unclear and fuzzy
areas boundaries are visualized as a transition zone, marking in stripes (Ill. 2).
Technically or indeed mathematically
fuzzy region is considered as a fuzzy set of
locations, where each location as a point has its'
membership grade (Verstraete, 2010; Zadeh, 1965)
and it happens that all locations belong to the
regions but some more then others. As
interpretation of definition a figure (Ill.3.) is
provided where we actually can see the curve of
membership grade for the profile of the region. To
remind the membership can be evaluated within the interval [0; 1], where both sides are included.
And so below the visualization of fuzzy region, that has exactly the representation of area with a
fading tone, we see how much at each place the point belongs to the fuzzy region. And so we are
able to see the width of fuzzy edges. “As the region itself is fuzzy, it's logical that its boundary will
be a fuzzy entity” which leaded into the presentation of the boundary itself (ΔA), the interior (Aº)
and the exterior (A¯) boundary (Verstraete, 2010)
In the picture above the boundary itself would be the gray part. The key point is the
membership grade of 0.5 that completely belongs the most to the boundary and all the points that Illustration 2: Baltic cultures I-IV c. (Istorija II, 2007).
are closer to 0 or to 1 belong less to the boundary. Then the interior boundary in the image is black
and very dark gray tones. It is the one where all the points with a membership grade 1 belongs to to
the boundary and all the points that are getting closer to 0.5 membership grade belong less. And the
exterior boundary in the picture (Ill. 3) is white and very light gray tones. The points that strongly
belong to exterior boundary are 0 and the ones that membership grade is getting close to 0.5 belong
less.
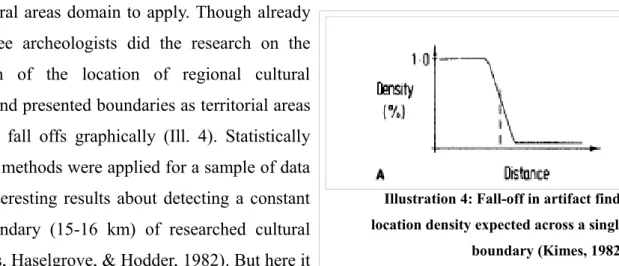
Suggested approach (Verstraete, 2010) is very theoretical and it's usually hard to have such
data in cultural areas domain to apply. Though already
in 1982 three archeologists did the research on the
identification of the location of regional cultural
boundaries and presented boundaries as territorial areas
that are like fall offs graphically (Ill. 4). Statistically
curve fitting methods were applied for a sample of data
that gave interesting results about detecting a constant
average boundary (15-16 km) of researched cultural
areas (Kimes, Haselgrove, & Hodder, 1982). But here it
is important to stress that data it was applied to was a pre-roman coinage distributions in Britain. As
it was already explained in 2.1. section while talking about archeological area definition, it is
slightly incorrect identifying the coinage area with a cultural area, as it is analysis on one object, not
on the assemblage of objects and second the object itself is not the main of identifying a particular
culture. Coins, used for trading, exactly are not the feature of one culture that could be distinguished
from other, but contrary can better show the interaction of cultures.
Conceptually different fuzzy region solution was recently presented creating plateau regions as an implementation where not crispy regions are transformed into plateau region consisting of a finite number of crisp regions. The inside boundary of a crisp region consisting of
points as a line is shared by n crisp regions with a bigger membership value then crisp region
defines. The topological relations as intersection, union and difference were analyzed and presented
with examples. The authors claims being it the first implementation concept on fuzzy regions.
(Kanjilal, Liu, & Schneider, 2010). But no practical case solution is given. And one can admit that
nowadays GIS and spatial data systems deals just with crisp, precisely defined regions, but many
objects, including cultural areas do not follow such pattern. Defining such areas as fuzzy regions
makes it difficult to handle with GIS as in all over it is a huge set of points with associated different
values of membership. In contrast, plateau regions suggest to model fuzzy areas into many
“plateau” that are formed of points having equal values of membership. Figure below (Ill. 5)
Illustration 4: Fall-off in artifact find-location density expected across a single
demonstrates the concept of generalization into 9 plateau regions (r9) with particular membership
values: from 0,1 to 1. For the boundaries shared by several crisp regions (n ≥ 2), they to belong to
that fuzzy region with the highest membership value among the membership values of the n
regions. Such solution also enables to have logic operators as union, intersection and difference that
are well analyzed in the paper mentioned. Despite that, apart of the example for modeling air
pollution, no real cartographic application was done.
Cartography in general is such a vast and interdisciplinary field that it is hard to be a great
cartographer embracing all the fields and cartographers tend to specialize (Thrower, 1996).
Obviously there is no such specialization as cultural cartography and many of cultural mappings are
done by other specialists with some geographical education meaning that they posses some
cartographic knowledge though not always enough. And so neither cartographers nor geographers
have applied the technical possible visualizations as have been presented above for cultural areas
that here are defined through the complex pattern of society.
As well, it's important to notice, that the cultural area visualization haven't changed recently,
as well as haven't been the popular research question, despite the digitalization boom. Indeed digital
information enables „creation and exploration of large collections of data“ as well „interactive
exploration“ and „collaboration <...> fundamental to the Web” (Stone, 2008) . The map as a mean
of communication has also changed, mostly due to the improvement of visual qualities that has
developed (Thrower, 1996). But on the other had, it also makes easier to miss-communicate and
give a wrong information just because the readability for an end user can be simply
incomprehensible due to overload of information and graphics.
3 Culture field representation in semantic web
3.1 Semantic web importance for culture domain
The idea of semantic web has been born due to the 'wild' growth of data on web, data of
something somewhere by someone and people using the web felt the lack of trust, sometimes the
lack of logic. Therefore, semantic web was developed like an extension of existing web
(Berners-Lee, Hendler, & Lassila, 2001) making data machine-readable (Fensel, Domingue, & Hendler,
2011) and so bringing the concept of meaning to the web-pages (Smith & Alesso, 2006). There is
much more visions and explanations about semantic web, that are well exposed by T.B. Passin,
already in the introduction of his book laughing that semantic web has almost became a celebrity
nowadays, even Scientific American published an article, although almost most people don't know
what it is and indeed there isn't a semantic web yet (Passin, 2004). What is known, it is an initiative
of W3C that seeks to maintain interoperability of web, especially in the activities of the W3C
Linking Open Data (LOD) project. And here it just can be stated that interoperability between
science, scientists and scientific domains is just the best thing to help for the development. The
development of any kind of domain, and what is more important to link the domains. Indeed that's
how semantic web idea has appeared back in 1990, in one of the biggest research centers, in CERN
seeking for an ability to share the data (Fensel et al., 2011).
Following the semantic web main key point will be introduced from a technical side for
better structural understanding and interlinking with the focus of this thesis. So, the best way to
keep the web interoperable is through Resource Description Framework (RDF) as a standardized
format for publishing data on the web. RDF integrates applications using XML for syntax and URI's
for naming and it's structured in the data model of triples: subject, predicated (describes the like in
between) and object. Such data publishing paradigm already leads to “more effective
discovery, automation, integration and
reuse across different applications” (Smith
& Alesso, 2006).
But semantic web isn't built just on
RDF data description, though it is one of
the cornerstones of it, that is visible in the
well known graph explaining the layered Illustration 6: Semantic web architecture. Source:
structure of the semantic web (Ill. 6). And on the RDF with RDF Schema (RDFs) as a vocabulary
description language of RDF strands the notion of ontology with vocabularies, which basically just
helps to share the meaning across the wide web. Ontology in the information science recently
developed the meaning from T.R. Gruber's definition as “an explicit and formal specification of a
conceptualization”(T. Gruber, 1993; T. R. Gruber, 1993). It helps to describe formally any domain,
defining the concepts, which are classes of objects, and relationships between these terms, and such
information provides a shared understanding of any described domain web (Antoniou & Van
Harmelen, 2004).
Talking about semantic web importance for a cultural domain as it was already noticed, we
cannot restrict the research just within cultural domain, as that doesn't help for the development.
Especially in such a wide domain, that many sciences cross and talk using the same concepts but
just from their perspectives. That's how so many meanings of cultures appears and none of them is
more right or better, it's just this concept is such an old developed through ages each time with other
and another definitions. (The definition used in this work is provided in the end of the section 2.1
discussing the culture perception). And so bringing meaning to the web, the Semantic web is
developed and that helps to for both: humans and machines to define better the concepts, further to
share and so to use. The Semantic web should really help to integrate those different definitions of
one concept in the web providing some data with a conceptual definition inside a web, not in a
separate paper that has no relations with data or even worse not inside the head of some scientist.
Cultures are spatio-temporal phenomenons and they are and were spread over the world and
through the nowadays political borders that usually has very less in common with cultural
boundaries. But the research is often done nationally as scientists are funded by the national funds,
although there are international research groups as well. The national cultural research within
smaller countries it is sometimes impossible , especially the research for cultural boundaries, as they
can be visible just partially. For such reason cultural boundaries should be studied globally and so
“the RDF data model is inherently designed for being used at global scale” (Heath & Bizer, 2011).
For global studies the agreements of concepts should be made as well as the data sharing
and interoperability should be available and so with semantic web it is the easiest way, making your
data available and describing it in triples - an easy understandable schemata not just by humans but
also by machines. Ontologies and vocabularies play an important rule to provide a different
conceptual definitions and to draw the relations between them. So, cultural domain can be better
integrated to the semantic web having a domain ontology. Nowadays looking at the existing web
data topology a broad 8 domains appears as a topology, that's cross-domain, geographic, media,
is no such a cultural domain, but existing culture related ontologies and vocabularies, that will be
presented in the following sector, are mostly used to define the cross-domain. That's just reassert the
importance of semantic web to the cultural data and all the development of cultural domain.
Usually the importance of semantic web for one or another domain is not a discussion point,
but the author finds that there is no an integrative vision of culture as a phenomena concept within
the existing ontologies of semantic web and so the doubt can come – maybe it's not important. Just
one recent research on cultural domain has been done and recently published in the book
“Handbook of Research on Culturally Aware Information Technology: Perspectives and Models”
(Blanchard, Campbell, Schwier, Kanuka, & Neumann, 2010), where the cultural domain structuring
under already existing great ontologies has been done. The individual Upper Ontology of Culture
(UOC) is proposed that is orientated towards a new technologies and new folks people are using to
discuss cultures as well as integrative attitude from different social sciences about culture.
Nevertheless it is focused mostly on the outcome of culture not the culture as a phenomena and so
not about culture areas. As the authors say themselves it is still a long journey developing UOC
(Blanchard & Lajoie, 2011).
After the first idea of UOC it stayed in the theoretical approach. One can argue there is a
CIDOC defined as a “formal ontology that would enable the exchange of information and ensure
the information integration on cultural domain” (“CIDOC(CRM) v5.0.4,” 2011), but when looking
closely at it the main focus is not on the culture as a phenomena, but on the artefacts that culture
produces. And so it's the focus of many other papers. There are discussions on the semantic web
importance for cultural heritage (Benjamins et al., 2004) as well as the modeling peculiarities
(Pattuelli, 2011) or data applications (Byrne, 2008). Usually talking about cultural heritage it is just
about the one stored in the museums. The author would think that such trend has formed just due to
the data availability. The museum data was the most easy to reach, as the registries should have
been done in paper and later relational databases, as well as with the data that should have been
registered by governments like historical cultural heritage. With a case of Lithuania, the cultural
heritage database (http://195.182.68.156/registrai/) is still within the level of relation database,
though the recent cultural heritage objects stored in the museums, due to European initiatives as
Europeana (www.europeana.eu), have started being described in RDF model to be integrated to the
semantic web.
3.2 Culture area and boundary problematics in semantic web
Culture field in semantic web is not a newborn issue, thus ontologies and vocabularies are
them are focused on cultural heritage instead of culture in general. Besides, there are many other
vocabularies, that are not culture focused, but it is still possible to used some parts to describe
cultural objects or spatially distributed objects. Thus following the author overviews the existing
ontologies and vocabularies that are related to the culture area.
Probably the most related and the best known cultural domain describing ontology is
CIDOC (CRM). It got name from the International Committee for the Documentation of Culture
(CIDOC) that started working in 1996 on the Conceptual Reference Model (CRM), a formal
ontology that would enable the exchange of information and ensure the information integration on
cultural domain. CRM defines the semantics of database schemata and document structures used in
cultural heritage and museum documentation. Since 2000 CRM Special Interest Group collaborates
with the ISO working group ISO/TC46/SC4/WG9 to make CRM an International Standard with it's
form and and status (“CIDOC-CRM Overview,” 2011).
It is underlined that CRM is extensible and users are encouraged to create extensions for
their needs of more specialized communities (“CIDOC-CRM Overview,” 2011), but already from
the objectives of CRM we see it is orientated towards the heritage, which are objects. This thesis
focus is the culture areas that are formed by cultural phenomenons which are quite often defined by
cultural artefacts, which are recognized as heritage. And so CRM ontology is focusing on heritage
object which is described as a Persistent item (E77) class on the same hierarchical level has such
classes as Temporal Entity (E2) and Place (E53). Those three classes being on the same level shows
the spatio-temporal understanding of analyzed object. But Place (E53) in CRM ontology is defined
as the homogeneous object being “determined by reference to the position of 'immobile' objects
such as buildings, cities, mountains, rivers..” with properties as consists of (P88), falls within (P89),
overlaps (P121) or borders with (P122) other Places. Such spatial approach for cultural area is often
not the case and neither culture could be described as Persistent Item which can be subdivided into
Actor (E39) or Thing (E70). As a phenomenon, it might go under the Temporal Entity, which is the
case in other ontology – DOLCE (“DOLCE,” n.d.). But here the temporal entity has one section as
event. And so, just using the resources meaning classes and properties provided it would be
impossible to describe culture as a phenomenon with it's fuzzy region and boundaries.
Another well known domain ontology-vocabulary is Open Cyc (“OpenCyc,” 2011) existing already since 1986.It is an upper ontology with lot's of vocabularies integrated like spatial
relations or geography as the most relevant to the topic. One can find such entity as SpatialThing,
but it can be anythings that has location. As it is joined with WGS84 geographical vocabulary, it is
is term area that it is used in this thesis for culture area, but in Open Cyc it is defined as some
amount of 2D space and is a specialization of Scalar Interval. There is also regionArea, meaning
that the physical size of region. Region is defined as geographical region that is “a tangible spatial
region that includes some piece of the surface of a planet”. While culture is not really tangible,
though it is visualized geographically. And there is nothing about region or area boundaries in Open
Cyc vocabularies. There is just entity as border in the separate political vocabulary that doesn't fit
for culture regions as term border is political as a demarcation mark, dividing something, just like as
we are usually used to see.
Another upper level fundamental ontology is DOLCE (Descriptive Ontology for Linguistic
and Cognitive Engineering). It is based on a fundamental distinction between enduring and
perduring entities (“DOLCE,” n.d.). Looking deeper at the perdurants we find events, that can be found on CIDOC as well. But in DOLCE events are divided into achieved and not achieved, that
has a subclass called phenomenon. That is described as a process without active participation, „it
can be seen as an accomplishment when some intentionality puts boundaries on it.“ But the
ontology does not talk further about boundaries, though provides a property like boundary or boundary-of , that is more applicable to endurants as definition says.
Though upper or domain ontologies as it was described partially could describe the culture
and area it occupies, there is still a need of more specific vocabulary. And there are lot's of smaller
ones but not any orientated towards the phenomenon of culture and it's boundaries.
The ontology for geographical phenomenons Geo-Ontology was proposed and it's design presented suggesting spatial thing to divide into three classes as Physical entity, Human
Geo-entity and Geometric Thing, further subdividing physical Geo-entity into the NatureEntity and
GeoPhenomenon, and human entity subdividing into GeographicalRegion and Ecological Region
(Y. Wang, Dai, Sheng, Zhou, & Gong, 2007). It is quite unclear why GeoPhenomenon can not
appear nearby the human entity, which would be exactly an example of culture phenomenon that for
sure is not a physical entity. Though the idea of Geo-Ontology as such is really good and there is
definitely a need for such, but the concepts should be over-thought better.
After examining many different ontologies and vocabularies, it have been noticed several
trends. First of all, every cultural domain ontology is mostly focused just on describing cultural
heritage, artificial objects found and often already well described and preserved in the museums.
While having such data already prepared or stored in digital formats. And ontology just helped to
describe data in standardized way, to order data logically and make it semantically available.
culture itself, as a complex social structure. Analyzing culture spatially or as many would name it
geographically, one should analyze it as the phenomena. And so for such purpose there is still no
ontology or vocabulary developed. Such observation leaded into raising the goal of a new small
possible vocabulary development, that is described in further sectors.
3.3 Visualizing cultural data from semantic web
First of all when talking about visualizing the semantic web, technicians first of all start
talking about the graph visualization. As the data is stored in triple format in semantic web and
those triples are related to each other, one can visualize them showing the relations between data or
between vocabulary classes. But it is not this side of the visualization that the author is interested to
present here. The idea would be to show what kind of geographical visualizations are possible to do
without programming, which is always possible, but is not the interest of this thesis. As well to look
at the projects done that provides cultural data and it's geographic visualization in semantic way.
Since there is no proper vocabulary for describing culture spatially, there is no data
available and there were no great projects done to visualize culture areas. Although one can say that
extinct cultures are not so important to understand and therefore there is no development in this
domain, likely it is different as there is a great society interest in cultural domain, just from the
cultural heritage side. And there is a lot of data in museums, that is already digitized, and nowadays
described in semantic way. As a great example there is a CultureSampo – Finnish Culture on
Semantic web project (http://www.kulttuurisampo.fi/?lang=en). It is also focused on cultural
heritage, getting data from the museums and showing their relations with place. The local finish
ontology was created for this project. Nevertheless the culture is not analyzed as a phenomena
showing it spatially. It is just analyzed the national heritage within Finland borders. The
geographical visualization is used, simply Google maps API for visualizing the cultural objects..
The very similar project still in beta version is pat.mapa – linking Catalan cultural heritage
implementing linked data principles with a complex data visualization (http://patmapa.gencat.cat).
The technical process is challenging due to mapping data between different databases and managing
metadata. The pat.mapa project is implementing CIDOC (CRM) ontology, as the project is focused
just on the cultural heritage. And the visualization part is similar to Finnish project using
GoogleMaps API for cultural heritage as points visualization.
Indeed semantic web is orientating to the intelligent user that is able to take, modify and
use the data himself. There are technical guides and tutorials written how to program semantic web
And one chapter is dedicated to already existing project for data visualization and sharing the
Exhibit tool of SIMILE (Semantic Interoperability of Metadata and Information in unLike Environments) that is conducted by the MIT Computer Science. The open source software is really
easy to use and seems their goal as “to simplify the reuse and sharing of data, and to build tools that
make it easy to work with data” was reached. There were lot's of small visualizations created
(http://www.simile-widgets.org/exhibit/), the same tool was as well used for some parts in finish
project CultureSampo. The same tools is also used in this thesis for a case study testing the
vocabulary and making the visualization of the culture areas withing the further 5.3 section.
Creating effective tools for visualization requires technical skills, visualization skills, and a
deep understanding of the problems and tasks critical for a particular domain. One common
criticism of visualization research is that it presents techniques that are technically interesting but
that do not provide solutions to real problems. This is a classic problem in research tool and system
design, where technologists have a vision, based on what is computationally possible, but lack an
understanding of what is really needed to solve the problems of their potential users.
4 Methodology of work
4.1 Workflow
Culture domain being so wide and ambiguous it always takes a while to get into the topic
as well as to find a problem that could be raised for a work as master thesis. As well as the semantic
web domain, being still new and fast expanding, should be enough known for the author to analyze,
overview and evaluate the culture domain within it. Primary focus of the thesis on the culture
heritage has been changed several times after more and more reading have been done and some
tendencies have been noticed. That resulted in forming the topic around aeal and phenomenal side
of culture and its boundaries – a slippery and such a vague concept in terms of formalization and
representation, and the tendency was, not so many researchers have touched this question before. It
is difficult to understanding the variety and the differences of culture concepts that differs so much
between sciences and does not help determining culture area and boundary. And despite all, the
culture boundary is always represented as a boundary that would stand for anything else, being
crisp, clear and challenging as everybody knows that culture doesn't have such. Although it took
time to formulate the problem, it is very important and the first step in research process (Kothari,
2004; Kumar, 2005).
The research about culture areas was started widelly as to understand the topic objectivelly
one had to get to know the archeological, historical, anthropological and geographical literature.
The step of literature review is not less important especially in more analytical type of research
(Kothari, 2004). For that reason the big part of the work was the information collection and
analysis, that is given in the 2 and 3 sections. Researching the literature it helped better to
reformulate the research problem.
Following in the research process the next step is a research design, for which an
exploratory manner was chosen. A problem was formulated for more precise investigation
considering different dimensions of the problem (Kothari, 2004). There was no clear hypothesis
erected to be tested, just the question raised of how could culture areas be represented with semantic
web and visualized interactively. And to research such question the kind of experimental
visualization was done with a sample of data, which leaded to a case of Lithuania design with a type
of non-probability sample that can be called purposive sampling (Kothari, 2004). Though it is very
important the avoidance of bias, with a purposive sampling the items are selected deliberative and
sample was chosen due to the lack of data available, as well as due to time saving. The sample
chosen is the Baltic cultures within Lithuanian territory VI to XII century, the epoch of tribes
existence. About those centuries all the data is coming just from the archeological resources and so
archeologists work on artefacts, analyze and produce the possible culture areas of cultures as a
paper map. So for the research it was used a secondary data, the one collected from maps by the
form of digitalization, plus bibliographic entries.
Having data collected it needed to be processed, as it needed to be expressed in triples in
rdf data model for semantic web. The knowledge of semantic web was collected parallel to
literature analysis. The data procession consisted of several steps and different research types. The
conceptual research - new vocabulary modeling or engineering - was hold after analyzing the
existing vocabularies used for triple description. There are so many ontologies created that is hard
to overlook all and find whether the raised idea could be described with existing vocabularies. But
the decision was made to model vocabulary, though it went out to be a very tiny one and specific for
the culture as a phenomenon with areas and boundaries that are fuzzy though realized as a crisp.
The new concepts were introduced in order later to apply for the data sample resulting in a
processed data file. Following to solve the research problem a visualization was done, using the
created scripts to visualize semantically described data. There was no software development, but
using already created SMILE scripts a web page was on the University server was created and the
data sample was implemented making an interactive visualization for further observations. During
this stage it was found that SMILE required the triples to be in RDF/XML format that would be
published on the web. Since WWU provides a small space for students it wasn't a problem. The
problem come visualizing polygons with SIMILE scripts that did not work properly and a separate
script was needed.
After the visualization, the data was shortly described and analyzed, but further and deeper
analyzing and interpreting the results, reasoning and searching for insights. After all, everything is
expressed the master thesis as a report of the research conducted.
The most time was spend on analyzing the cultural concepts an learning semantic web like
triple expression in different ways. Although there was no software engineering, it took a while to
learn and understand the scripts. Publishing and build an HTML based page was much easier and
interesting, though it was hard to try to apply the cartographic rules to already built-in tools. It also
4.2 Used research methods
There are several methods used to solve the raised goals and to come to the results as
desired. Mostly empirical analytical methods are used as literature, qualitative and cartographic
analysis. For the vocabulary modeling and the web page creation an ontology engineering and
software engineering methods were applied.
Literature analysis method is one of the most common and the most basic method to
understand the research. Various attitudes of social and theoretical scientists have been over-viewed
and analyzed from journals, articles, books.
Another method used was a qualitative analysis as the most popular when presenting a case
study. It is useful to get deeper into a study and well understand the data as well as the entire
environment for a critical point of view playing with data and interpreting it.
Cartographic method nowadays is more and more used for analysis as it helps to
understand the research object spatially and visually. The interactive web visualization was used
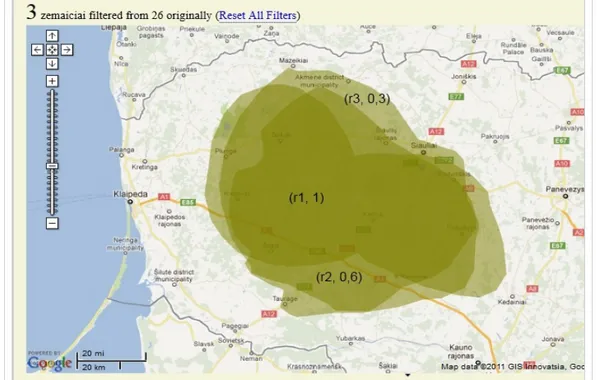
applying some scripts on a GoogleMaps that lets an easy layer overlay which can be controlled by
user. Overlaying the culture areas (visualized with transparency) of different scientists resulted in
giving new areas. The fully colored areas, where the color intensity is highest due to all points of
view crossing over, and areas where color intensity is very low. This method leaded into creating a
hypothesis that plateau region theory (section 2.3) could be applied for a new areas that
visualization provided. The different membership grade can be assigned to a different intensity
colored areas, meaning that the areas could show how strong they belong to that particular culture
area giving the idea of the culture boundary fuzziness and moreover the area of fuzziness.
Ontology engineering method was used for creating a cultural boundary vocabulary.
Although partly it can go under the software engineering (Fernandez, Gomez-Perez, & Juristo,
1997) the author overviews is separately as for creating vocabulary no software was used and this
vocabulary is not used as a part of any software. Ontology engineering being quite a new method
does not have many documentation, but the process indeed is well clarified. Creating a vocabulary
mostly were used advises of Methontology (Fernandez et al., 1997) and the ontology of M. Uschold
(Uschold & King, 1995). Firstly the purpose of possible vocabulary was identified, then key
concepts collected and important terms identified and formalized. Secondly it is very important to
integrate into already existing ontologies creating an interoperability. So needed concepts that were
already described in other ontologies have been changed in order to reuse existing terms. Moreover
Going within the circle of ontology development an evaluation is important, which can be done just
by implementation. And so here for implementing an ontology a web page was designed for
creating an interactive visualization of culture boundaries and so the software engineering method
was applied. The web page was created and results were described, but no further evaluation has
been done due to time restrictions. For that reason the vocabulary wasn't published and documented
in standard way. The documentation of entities and properties are provided within this thesis.
The software engineering method was applied creating a web page with interactive
visualization. Although there are many different methodologies on software development the most
common model to follow is waterfall model (Jalote, 1997). Since the goal of this web page was
interactive visualization for semantic data a tool was first of all chosen that was SIMILE open
source tools. Firstly, there are no other open source tools for web visualizations fully developed
already. And so the design was mostly planned by tool designers. Just implementation was done and
design within a web page meaning the available tool composition. Implementation leaded testing
and that was a cyclic task, setting up differently the provided or data descriptions and
implementing again. This web page creation is just the test of possible culture boundary vocabulary