Molecular analysis of phylogeographic subspecies in three Ponto-Caspian
sturgeon species
Andreea Dudu, Sergiu Emil Georgescu and Marieta Costache
Department of Biochemistry and Molecular Biology, Faculty of Biology, University of Bucharest, Bucharest,
Romania.
Abstract
Sturgeons (Order Acipenseriformes) represent an extremely valuable natural resource that is now facing depletion. In the current study we evaluate if the traditional classification in subspecies ofAcipenser gueldenstaedtii, Acipenser stellatus and Huso huso, endemic to Ponto-Caspian region is sustained by molecular analysis and if these represent Evolutionary Significant Units (ESUs) that should be managed separately in conservation programs. To examine the classification of taxonomic entities we sequenced a fragment of the mitochondrial control region in case of three stur-geon species that inhabit the North-western of Black Sea and migrate for reproduction in the Lower Danube. Beside these sequences, we used previously published sequences from sturgeon individuals sampled in the Black Sea, Azov Sea and Caspian Sea. We determined the genetic diversity and genetic differentiation, conducted a Population Aggregation Analysis (PAA) and inferred an intraspecific molecular phylogeny and haplotype network. The results indicated a low level of genetic differentiation between the geographically designated subspecies and did not support a significant divergence or reciprocal monophyly between them. Our results confirm previous genetic studies with smaller samples sizes, but additional analyses including nuclear markers should be conducted for proper recom-mendations aiming at the development of conservation programs.
Keywords: Ponto-Caspian sturgeon, subspecies, ESUs, mitochondrial markers.
Received: January 15, 2014; Accepted: May 24, 2014.
Introduction
Sturgeons represent an ancient group of fish with slow evolution, which maintained their morphological cha-racteristics for more than 200 million years (Bemis and Kynard, 1997). Overfishing and poaching for the valuable caviar and meat, the interruption of the migratory routes as a consequence of dam constructions and pollution repre-sents the factors that have affected sturgeon populations worldwide.
At present, 27 species of sturgeon and paddlefishes (Order Acipenseriformes) are found on the IUCN Red List, the majority being classified as “Critically Endangered”, and four species are now possibly extinct (http://www.iucn.org). In this situation it is crucially im-portant to develop efficient programs aiming at conserva-tion, repopulation of their original habitats and aquaculture, not only for supplying the request of the market for meat and caviar, but also to raise appropriate reproducer stur-geons in the attempt of recover wild populations. A sus-tained effort must now to be directed at protecting the
diversity residing within species by altering harvest and hatchery release programs to sustain locally adapted gene pools (Doukakiset al., 1999).
In order to have efficient conservation and restocking programs it is absolutely necessary to designate and prop-erly manage conservation units. The diagnosis of conserva-tion units typically includes recogniconserva-tion of genetic diversity and specifically unique evolutionary lineages or Evolution-ary Significant Units (ESUs) (Blairet al., 2013). In fact one of the aims of endangered species conservation should be directed to the identification of ESUs, defined broadly as a subspecies, population or group of populations with a high genetic and ecological distinctiveness (Allendorf and Lui-kart, 2007) and characterized by reproductive isolation and adaptation (Waples, 1991); reciprocal monophyly at mtDNA loci (Moritz, 1994); the lack of “ecological exchangeability” (different life histories, morphology, quantitative trait locus variation, habitat, predators, etc.) and of “genetic exchangeability” (no recent gene flow, con-cordance between phylogenetic and geographic discontinu-ities) (Crandallet al., 2000).
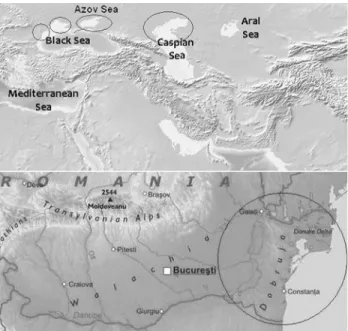
Historically, the Ponto-Caspian region hosted numer-ous sturgeon species, but nowadays only six of them inhabit the seas from the region and their tributaries (Secoret al., 2000). The Ponto-Caspian region comprises the basins of Send correspondence to Sergiu Emil Georgescu. Department of
Biochemistry and Molecular Biology, Faculty of Biology, University of Bucharest, Splaiul Independentei 91-95, 050095 Bucharest 5, Romania. E-mail: [email protected].
the Black Sea, Caspian Sea and Azov Sea. The Black Sea and Azov Sea are interconnected by Kerch Strait, while the Caspian Sea is completely separated from the other two basins. The major rivers in this region are Volga and Ural (flowing into the Caspian Sea), Danube, Dnieper and Dniester (flowing into the Black Sea), Don and Kuban (flowing into the Azov Sea), which together with their trib-utaries provide spawning grounds for anadromous sturgeon species from the three seas.
Based on morphological and ecological features there is a subspecies designation that corresponds to their distinct geographical distribution into separate basins: H. huso maeoticusis originating in the Azov Sea,H. huso ponticus
in the Black Sea andH. huso caspicusin the Caspian Sea;
A. stellatus donensisis specific to the Azov Sea,A. stellatus ponticusto the Black Sea andA. stellatus stellatusto the Caspian Sea (Pirogovskiiet al., 1989; Shubinaet al., 1989). WithinA. gueldenstaedtii, one subspecies corresponds to the Black Sea/Azov Sea (A. gueldenstaedtii colchicus) and one to the Caspian Sea (A. gueldenstaedtii gueldenstaedtii) (Vlasenkoet al., 1989).
The main goal of our study was to infer the conserva-tion units for three anadromous sturgeon species (H. huso, A. stellatusandA. gueldenstaedtii) from the Ponto-Caspian region by using the mitochondrial control region as marker to clarify the intraspecific genetic differentiation of these species. By using sequences from the GenBank data base for sturgeons from the Caspian Sea and Azov Sea, as well as our own sequences for sturgeons individuals sampled in the Lower Danube as references for the Black Sea popula-tion, we tested phylogeographic structure of the three stur-geon species and the genetic support and validity of their classification as subspecies and distinctive units for conser-vation.
Material and Methods
Sampling and DNA isolation
The individuals used in this study were captured in the Lower Danube in a national scientific research study for restocking and monitoring. Sampling did not jeopardize the life and welfare of the animals as only very small fragments of fins were sampled before the animals were tagged and again released into the river.
Biological samples represented by small fin tissue pieces were collected between 2001 and 2008 from 78 stur-geon individuals (27A. stellatus, 28A. gueldenstaedtiiand
23H. huso) from the Lower Danube River. The provenance
of the sturgeon samples used in this study is shown in Fig-ure 1.
On field collection, the tissue specimens were fixed in 96% ethanol and preserved as such until the DNA extrac-tion was accomplished. Total DNA was isolated using a standard phenol-chloroform method (Taggartet al., 1992) with minor modifications.
Mitochondrial DNA analysis
The entire control region and partial sequences of the flanking tRNA genes were amplified using the primer pair
ProF: 5’-ACCCTTAACTCCCAAAG-3’ and PheR:
5’-GCTTTAGTTAAGCTACGC-3’. The primers used are matching to proline and phenylalanine tRNA genes, re-spectively. The primers were designed with Primer 3 soft-ware (Koressaar and Remm, 2007; Untergrasser et al., 2012).
The PCR amplifications were conducted in a thermo-cycler GeneAmp 9700 PCR System (Applied Biosystems) under the following conditions: 95 °C for 10 min, followed by 35 cycles of 95 °C for 30 s, 52 °C for 30 s and 72 °C for 60 s. The reactions were carried out in 25mL final volume containing 50 ng DNA template, 1X AmpliTaq Gold Reac-tion Buffer, 1.5 mM MgCl2, 200 mM of each dNTPs,
0.4mM of each primer and 0.5 U of AmpliTaq Gold Poly-merase (Applied Biosystems). The PCR products were pu-rified using a WizardSV Gel and PCR Clean-Up System Kit (Promega).
Sequencing reactions were performed using the BigDye Terminator v3.1 Cycle Sequencing Kit (Applied Biosystems) and the purification of the sequencing prod-ucts was completed with BigDye-XTerminator (Applied Biosystems). The purified fluorescently labeled products were loaded and analyzed into an ABI Prism 3130 Genetic Analyzer (Applied Biosystems). For excluding errors, both strands of the amplicons were sequenced.
Data analysis
The sequences obtained for the Lower Danube indi-viduals were included in the group of sequences for the
Black Sea sturgeon population and were aligned and com-pared with similar sequences from GenBank for sturgeons from the Black Sea, Azov Sea and Caspian Sea (see Ta-ble S1). The D-loop sequences were truncated to 731 bp in
A. stellatus, 641 bp in 9 H. huso and 695 bp in A.
gueldenstaedtii to accommodate them to the shorter
quences from GenBank selected for analysis. For our se-quences, the distinct haplotypes only were considered for further analyses. The sequences representing distinct haplotypes were deposited in GenBank with the following access numbers: KF431840 - KF 431846 (H. huso), KF431847 - KF431850 (A. gueldenstaedtii) and KF431851 - KF431857 (A. stellatus). The sequences were aligned using ClustalX 2.0.9 software (Larkinet al., 2007). The genetic diversity in terms of number of haplotypes, nu-cleotide diversity and haplotype diversity were calculated using DnaSP v5.1 (Librado and Rozas, 2009) The genetic differentiation between populations based on the fixation index (FST) and other statistical indices of differentiation
(GammaST,Hs, Ks*) were computed using the same
soft-ware. Statistical significance was tested by permutation with 10,000 replicates. The analysis was accomplished with gaps included and considered as a fifth state. The Nm
value calculated in DnaSP was used to estimate the gene flow based on FST.For this analysis we eliminated the two
sequences ofH. huso maeoticusbecause a larger number of samples would have been necessary for a precise diagnosis of subspecies definition and for inferring ESUs (Walsh, 2000).
The mtDNA sequences were analyzed by using the discrete character-based methodology of population aggre-gation analysis (PAA) (Davis and Nixon, 1992). The PAA groups taxa together based on the presence of fixed traits such that they are diagnosable distinct from one another (Cracraft, 1983).
We inferred a haplotype network of D-loop se-quences using a median-joining algorithm implemented in NETWORK v4.6.1 (Bandeltet al., 1999) with default set-tings (e = 0) and the variable sites weighted equally (weight = 10). The network was rooted with Acipenser baerii.
The phylogenetic relationships were inferred by Neighbor Joining (NJ) and Maximum Likelihood (ML) al-gorithms implemented in MEGA v5 (Tamuraet al., 2011). The best-fit model of sequence evolution was selected us-ing the Akaike Information Criterion (AIC) from ModelTest (Posada and Crandall, 1998). Bootstrap analy-ses (1000 replications) were used to asanaly-sess the confidence of each node. The phylogenetic trees were visualized with TreeView (Page, 1996). The Siberian sturgeon,A. baerii
(NC_017603) was used as an outgroup species both for net-work and tree construction.
Results
Polymorphism analysis of mtDNA data
Among the sequences that we obtained for individual sturgeons sampled in the Lower Danube River we identi-fied four distinct haplotypes in 28 specimens of A.
gueldenstaedtii, seven haplotypes in 27 specimens of A.
stellatus,and seven haplotypes in 23 specimens ofH. huso. For testing the subspecies existence hypothesis and for an overview of the genetic differentiation our sequences repre-senting distinct haplotypes were aligned and compared with similar control region sequences from GenBank, cor-responding to sturgeon from the Black Sea, Caspian Sea and Azov Sea. The sequence alignments comprised 32 D-loop sequences forA. gueldenstaedtii, 78 sequences for
A. stellatusand 43 sequences forH. huso. Due to the re-duced number of sequences deposited in GenBank forH. huso maeoticusoriginating in the Azov Sea, these were ex-cluded from most further analyses, except for the network and tree constructions. In the alignments, gaps were in-cluded and considered as a fifth state. We identified 23 dis-tinct haplotypes inA. gueldenstaedtii, 65 haplotypes inA. stellatusand 30 haplotypes inH. husofor sturgeon individ-uals with distinct geographical origin.
Among the 23 distinct haplotypes identified in A. gueldenstaedtii, five are shared by more than one individ-ual. Thus, one haplotype was common to six individuals from the Black Sea population and one was shared by two individuals from the same population; one haplotype was shared by two individuals from the Azov Sea population, and each of other two haplotypes were common for two in-dividuals sampled in the Caspian Sea basin. The sequences obtained for our samples of A. gueldenstaedtii from the Danube River represent unique haplotypes.
In the case ofA. stellatus, ten of the 65 haplotypes were shared by multiple individuals and the others were unique haplotypes. Except for two haplotypes that were common forA. stellatusindividuals belonging to different populations, the other haplotypes were shared by individu-als from the same basin. The haplotypes for theA. stellatus
sampled in the Danube River and belonging to the Black Sea population represent unique haplotypes, with one ex-ception, when a haplotype was shared by one individual from the Black Sea population and one individual from the Caspian Sea population.
diversity, nucleotide diversity and number of polymorphic sites that describe the DNA sequence polymorphism and, thus, the amount of intraspecific genetic variation.
The haplotype diversity (Hd) highlights the
unique-ness of a particular haplotype in a given population. ForA. gueldenstaedtiipopulations the haplotype diversity ranged from 0.83333 to 0.97436, with a mean of Hd= 0.9617, for
A. stellatus populations the values for Hd ranged from
0.99341 to 0.93333, with a mean of 0.99434 ,and forH. huso populations we obtained a haplotype diversity of 0.98693 and 0.98333 ,with a mean of 0.98782. Haplotype diversity was found to be high in all the sturgeon species, with an intraspecific value over 0.95, and also when calcu-lated separately for each populations.
In contrast, the nucleotide diversity (Pi) was relatively
low for each population. The average number of nucleotide differences per site between two randomly selected se-quences, or nucleotide diversity, was 0.01642 in A.
stellatus populations and 0.04494 in A. gueldenstaedtii
populations. An intermediate value of 0.01671, but very similar to the PiofA. stellatuspopulations, was determined
forH. husopopulations. The highest nucleotide diversity was found inA. gueldenstaedtiipopulations, particularly in
A. gueldenstaedtii gueldenstaedtii from the Caspian Sea.
Lower nucleotide diversity was denoted for A. gueldenstaedtii colchicusfrom the Black Sea and Azov Sea basins, but we need to consider that for the Azov Sea popu-lation we analyzed only four individuals. For the A. stellatusandH. huso populations, the values for Piwere
similar and lower than 0.02, withA. stellatus ponticusand
A. stellatus stellatuspresenting the highest nucleotide di-versity. Thus, nucleotide diversity was relatively low for all analyzed sturgeon populations. The low diversity high-lighted by our analysis might be the consequence of a rela-tive recent divergence between different sturgeon popula-tions, or be due to a severe population bottleneck during sturgeon evolution.
Population Aggregation Analysis (PAA)
InA. gueldenstaedtii,we identified 134 variable sites in which we detected 136 polymorphisms (130 transitions, 3 transversions and 3 indels). A total of 108 variable sites including 110 polymorphisms (100 transitions, 9 trans-versions and 1 indel) were detected inA. stellatus. Among the 75 variable sites inH. husothes included 80 different polymorphisms with 68 transitions, 7 transversions and 5 indels.
The PAA analysis of unique haplotypes, as identified by DNAsp, did not recover fixed nucleotide differences (characters), and thus it was not possible to differentiate be-tween characters and traits (polymorphic sites) in the se-quence data sets of the three Ponto-Caspian species (Figures S1, S2 and S3). The existence of diagnostic char-acters representing an obvious evidence of phylogenetic distinctiveness, if common to all analyzed individuals
within a hypothetic ESU (subspecies or allopatric popula-tion), was not revealed by our analysis. Thus, the genetic evidences did not support the classical subspecies designa-tion forA. gueldenstaedtii,A. stellatusandH. huso.
Genetic differentiation analysis
The divergence between populations was estimated mainly by Wright’s Fixation Index (Fst), which can range
from 0 (no genetic differentiation) to 1 (complete differen-tiation between population). For a more reliable interpreta-tion of genetic differentiainterpreta-tion data we also evaluated the Gammastvalues, which represent an unbiased estimate of
Fstthat corrects for errors associated with incomplete
sam-pling of populations and is more suitable for mitochondrial haplotype data (Weir and Cockerham, 1984). Pairwise dif-ferences of the populations were calculated as Fst values, which can also be used to measure the short-term genetic distances between the populations (Reynoldset al., 1983). The values for all statistical indices were similar, indicating low to moderate genetic differentiation between the popu-lations (Table 2).
The FST values were lower than 0.1 forA. stellatus
andH. huso,indicating a low genetic divergence between
populations, despite their distinct geographic origin. A. stellatusandH. husoshowed no structuring, and the stud-ied populations appeared to belong to one panmictic popu-lation. In contrast, the pairwiseFSTvalues were relatively
high and statistically significant, indicating a certain diver-gence inA. gueldenstaedtiipopulations. Thus, a moderate level of genetic differentiation was found among the popu-lations ofA. gueldenstaedtii.The lowest level of differenti-ation was evidenced among the Black Sea and Azov Sea populations, the other comparisons within A. gueldenstaedtiishowing a value of FST> 1. For testing the
subspecies hypothesis we analyzed as distinct groupsA.
gueldenstaedtii colchicus(from Black Sea and Azov Sea)
vs. A. gueldenstaedtii gueldenstaedtii(from Caspian Sea). In this case, the values of statistical indices also indicated a moderate differentiation between the two groups. With two exceptions, the values of Nmcalculated from FST are, all
higher than 4. A small degree of differentiation was, thus, directly observed, while an intensive gene flow between the analyzed populations is indirectly inferred.
Phylogenetic analysis of mitochondrial data
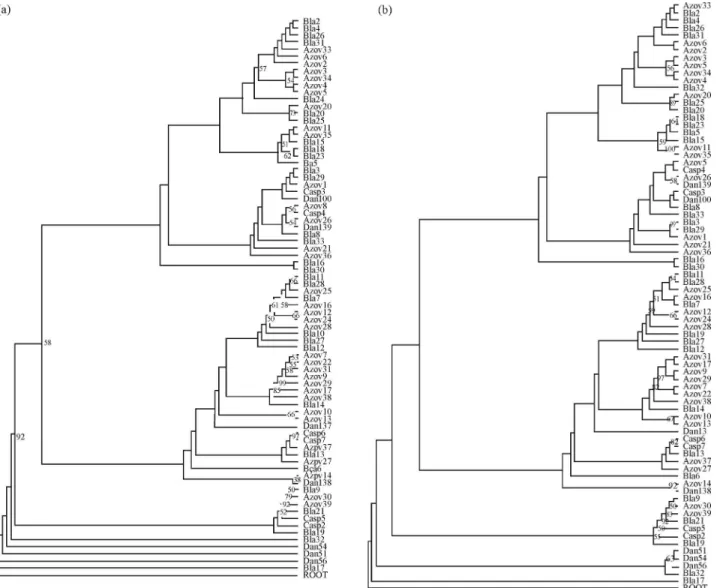
Based on the AIC criterion we selected the Tamura 3-Parameter as the best-fit model of nucleotide evolution in a gamma distribution of rates for both NJ and ML analyses. The haplotypes were distributed randomly along the both NJ and ML trees and were not associated with geographic origin (i.e. the proposed subspecies) . The phylogenetic analysis did not support the grouping of haplotypes by geo-graphic origin and/or classical subspecies designation. No monophyletic groups corresponding to populations/ sub-species were recovered (Figures 2, 3 and 4). Table
mtDNA haplotype networks
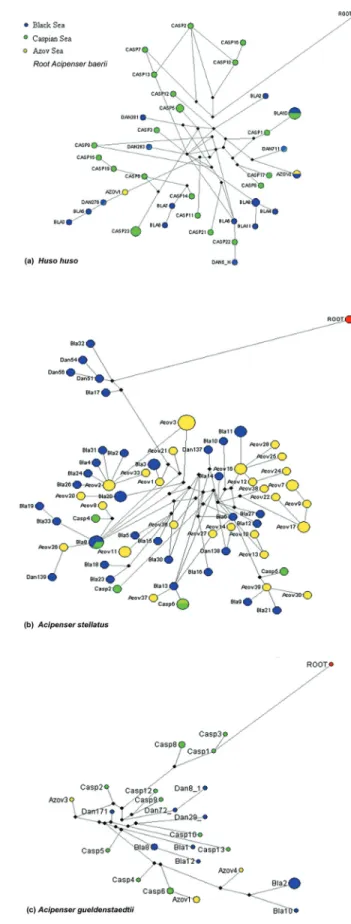
The haplotype networks of control region sequences showed the genealogical relationships among the
haplo-types of three Ponto-Caspian sturgeon species (Figure 5). The haplotype networks did not reflect the results of the di-versity indices and phylogenetic trees presented above. The shape of the networks indicated a complex structure with many median vectors (full black circles) and the majority of the circles had the characteristics of old haplotypes (low frequeny, restricted to one basin, connected by multiple mutational steps). Also, only few haplotypes were shared between the seas.
Discussion
For the three Ponto-Caspian sturgeon species a taxo-nomic classification in subspecies based on morphological, meristic and ecological traits and related to the water body in which they are found was already proposed (Pirogovskii
et al., 1989; Shubinaet al., 1989; Vlasenkoet al., 1989). Although this taxonomic classification is not unanimously accepted, confirmation might be very important for coordi-nating useful conservation programs aiming at identifying and managing the proper conservation units of these highly endangered species. A previous molecular study did not support the subspecies designation in sturgeons (Doukakis
et al., 1999) and supported caveats regarding the classifica-tion of subspecies inA. stellatus. The differentiation be-tweenA. stellatus stellatus(Caspian Sea) andA. stellatus
donensis(Azov Sea) was made based on several
character-istics, including head proportions, anal and dorsal fin char-acters, different rates of growth and maturity (Chugunov and Chugunova ,1964; Tsvetnenko, 1993), but later it was found that these features modify with growth and feeding (Holcick and Jedlicka, 1994) and, in consequence, such taxonomic nomenclature should not be used without ge-netic support (Birstein and Bemis, 1997; Doukakiset al., 1999).
Following this advice, upon analyzing the mitochon-drial control region, we did not find evidence for significant divergence and reciprocal monophyly among the sturgeon populations and, consequently, our results did not support their classification as subspecies. Our population aggrega-tion analysis also did not recover any ESUs, although the confidence of our results would increase with a larger ber of samples. According to Walsh (2000), a critical num-ber of 59 individuals is necessary in order to detect hidden character states in a population. Unfortunately, in sturgeons acquiring a larger number of biological samples is very challenging given the drastically reduced population and the difficulty of sampling due to their particular life cycle and behavior. Also, the fact that the PAA analysis did not reveal any fixed character in subspecies does not exclude that the respective haplotypes are exclusive to a subspecies, or even more, that the subspecies exist as proposed.
All the three sturgeon species as a whole display a high degree of haplotype diversity. The values of haplotype for species diversity lie in the range of 0.96 to 0.99, which is high when compared to many other species. The same
tern of diversity is evident for the investigated subspecies/ populations. Nucleotide diversity is considerate to be low to moderate for values from 0.01-0.04. The highest nucleo-tide diversity (Pi- 0.04494) was found inA. gueldenstaedtii
and was comparable to the value found by Khoshkholghet al.(2011) inA. persicusfrom the South Caspian Sea, using as well the mitochondrial control region as molecular marker. Although nucleotide diversity is rather reduced (except forA. gueldenstaedtii) at the species, subspecies and population levels, the values obtained are significantly higher than those observed in other sturgeon species, likeA.
brevirostrum (Grunwald et al., 2002) and A. oxyrinchus
oxyrinchus(Wirgin et al., 2000, 2005). Nonetheless, the congruence between these results should be treated with care, considering differences in the number of samples in-cluded in the studies and the length of the analyzed se-quences.
Despite the wide distribution range and the presence of designated subspecies in isolated water bodies, our re-sults show relatively little geographic differentiation and significant gene flow between the subspecies. A sufficient gene flow between populations can slow down or prevent the process of geographic differentiation and, thus, result-ing in a small population structure over large areas.
The results illustrated by the phylogenetic trees are congruent with those of the genetic differentiation analysis. The results of the genetic differentiation and gene flow sta-tistical analysis and the absence of monophyletic groups corresponding to subspecies/populations are arguments in favor of the questionable taxonomic classification. In con-trast, the haplotype network results showed a strong popu-lation structure. The circles of the networks retain the attributes of old haplotypes, and only few haplotypes are shared between the seas basins. Thus, only two among 36 haplotypes ofH. huso, none among 23 haplotypes of A.
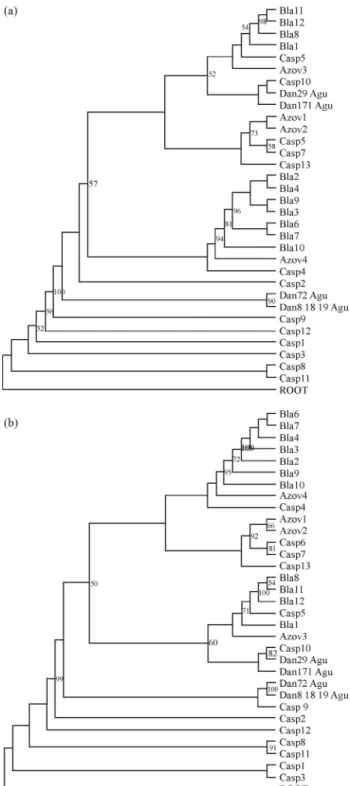
Figure 4- Molecular phylogenetic trees inferred by partial D-loop se-quences analysis by Neighbor-Joining (A) and Maximum Likelihood (B) inH. husoconstructed using the Tamura3 parameter plus G model with 1000 bootstrap iterations. ROOT indicates the outgroup speciesA. baerii
(NC_017603). The numbers represent the confidence bootstrap values higher than 50. Bla= Black Sea; Casp = Caspian Sea; Azov = Azov Sea.
Figure 5- Median-Joining networks for D-loop mtDNA haplotypes in (A)
gueldenstaedtiiand only one haplotype among 65 in A. stellatusare common to the different basins. Despite the fact that no star-like groupings were identified and the shape of the haplotypes networks might rather suggest a strong mixture of individuals, based on the previous argu-ments we consider that the networks reflect a strong popu-lation structure, even though this was revealed by the statistical indices.
A higher genetic structuring was found in A. gueldenstaedtii. This species exhibits great morphological variation, presenting multiple morphs and biological forms, including resident freshwater populations and spring and autumn migratory forms (Sokolov and Tspekin, 1996). Furthermore, withinA. gueldenstaedtiigenetically distinct lineages for undistinguishable morphology were inferred (Birsteinet al., 2000).
The lack of differentiation and the considerable gene flow found in the analyzed sturgeon species could be the re-sult of a relatively recent genetic exchange mediated through the geographical connection established between the three water bodies, but more probably it is the conse-quence of anthropic influence.
The origin of sturgeon species with a Ponto-Caspian distribution is probably related to the Tethys and Paratethys Seas. The Paratethys Sea was formed during the Late Juras-sic (about 160 Mya) and was isolated during the Oligocene (about 34 Mya), when the connections with Tethys Sea were considerably reduced. The Paratethys Sea was local-ized 15 Mya within the current territory of the Black Sea, Azov Sea, Caspian Sea and Aral Sea (Jones and Simmons, 1996).A. gueldenstaedtii,or its ancestor, appeared in this period, while the rest of the species in the group appeared in the Late Miocene and Late Pleistocene as a result of global and local climate changes.
According to paleontological and molecular data, the dispersion of Ponto-Caspian sturgeon species in the Black Sea, Azov Sea and Caspian Sea occurred in the Pleistocene almost 1.5 Mya (Birstein and DeSalle, 1998). The Caspian Sea was the main refuge for the Ponto-Caspian species for the period 15-1.5 Mya. In this period, the anadromous stur-geons likeA. gueldenstaedtii, A. stellatusandH. husohave probably migrated repeatedly from the Caspian Sea to the Black Sea and Azov Sea through water connections that were established between the three basins. Currently, the Azov Sea and the Black Sea are still connected through the Kerch Strait. In the light of evolutionary history of Ponto-Caspian sturgeon species, the small intraspecific differenti-ation might be a consequence of the genetic exchange me-diated through the present water connections on a larger scale over 1.5 million years (Doukakiset al., 1999; Zuba-kov, 1988).
Similar results showing no or little genetic differenti-ation within species were found not only in sturgeons (Brown et al., 1993; Guenette et al., 1993), but also in salmon species. Based on phenotypic and ecological
varia-tion, populations of anadromous Salmo trutta from the Black, Caspian and Aral Seas have been classified into dis-tinct taxa and considered as different subspecies. The re-sults of molecular studies based on allozyme and mitochon-drial markers, however, provided only weak support for this taxonomic distinction (Bernatchez and Osinov, 1995; Osinov and Bernatchez, 1996). Moreover, no genetic dif-ferentiation was found between anadromous and resident forms ofSalmo trutta, despite their morphological, demo-graphical and ecological characteristics and the fact that have even been classified as different species in the past (Charleset al., 2005).
Another source of gene flow is anthropic intervention by the intensive restocking programs of tributaries with sturgeons raised in aquaculture conditions to support the declining wild populations from the Black, Caspian and Azov Seas. Since there is a severe decline of all these spe-cies, restocking measures are ongoing for all three basins. Currently it is considered that almost 100% of beluga in the Volga River is hatchery reared. There are data showing that there has also been an intensive restocking in the Caspian Sea, since that 91% of each generation in this species is es-timated to come from hatchery stock (Khodorevskaya et al., 2009). ForA. gueldenstaedtiireports indicate that in the early 1990s, between 30-55% of the Caspian stock origi-nated from hatcheries (Khodorevskayaet al., 2000). Also, according to some opinions there is no native spawning population remaining in the Azov Sea, but only stocked in-dividuals (Gesneret al., 2010). In the early 1990s, it was es-timated that nearly 100% of the Azov Sea population and 30% of the Caspian Sea population ofA. stellatus were from stocking. More recent estimates are that more than 50% of the Caspian Sea populations are from stocking (Qiwei, 2010). The restocking programs implying the three Ponto-Caspian species are currently practiced by different countries, like Russia, Romania, Khazakstan, Azerbaidjan, Iran, etc.. In the former Soviet Union, the restocking pro-grams started in the 1960s as a consequence of limitation of spawning grounds following the construction of dams (Secoret al., 2000; Chebanovet al., 2002; Doukakiset al., 2005). The Caspian basin has lost a considerable surface (almost 70%) of spawning grounds mainly due to hydro-electric power stations. For example, only the Volgograd dam has dramatically decreased the area of spawning grounds in the Volga River, while the Don River dam re-moved 68,000 ha of spawning ground, and flow regulation in the Kuban led to the loss of 140,000 ha of spawning grounds (Khodorevskayaet al., 2009; Gesneret al., 2013).
the five hatcheries in the Azov Sea were originated from the Caspian Sea population. Apparently, this was also a com-mon practice forA. stellatus andA. gueldenstaedtii. For stellate sturgeon the introduction of fertilized eggs from the Caspian Sea into the Azov Sea affected the genetic integrity of Azov Sea population (Chebanovet al., 2002).
Our study based on mitochondrial control region analysis reveals a general high genetic diversity within the three Ponto-Caspian sturgeon species but except for A. gueldenstaedtii, only very low differentiation between pop-ulations. The results of the mtDNA analyses do not support the existence of distinct subspecies corresponding to differ-ent basins and reflect a heterogeneous genetic composition of populations, probably as a consequence of uncontrolled restocking practices. A study on sampless collected prior to the onset of restocking programs and now representing mu-seum specimens could be very useful to establish if the lack of differentiation is the result of geological changes or of human intervention, but such a study appears to be very dif-ficult to realize. No ESUs were inferred, limiting thus the recommendations for conservation. For a correct detection of appropriate management units, a larger number of sam-ples should be included in the study, but this might be very challenging considering the current status of sturgeon pop-ulations.
Acknowledgments
This work was supported by the PN-II-PT-PCCA Project 116/2012 “Genetic evaluation and monitoring of molecular and biotechnological factors that influence pro-ductive performance of Danube sturgeon species bred in in-tensive recirculating systems”. D.A. was supported by the European Social Funding through the Sectorial Operational Programme for Human Resources Development POSDRU/159/1.5/S/133391.
References
Allendorf FW and Luikart G (2007) Conservation and the Genet-ics of Populations. Blackwell Publishing, Oxford, 624 pp. Bandelt H-J, Forster P and Röhl A (1999) Median-joining
net-works for inferring intraspecific phylogenies. Mol Biol Evol 16:37-48.
Bemis WE and Kynard B (1997) Sturgeon rivers: An introduction to Acipenseriformes biogeography and life history. In: Birstein VJ, Waldman JR and Bemis WE (eds) Sturgeon Biodiversity and Conservation. Kluwer Academic Pub-lishers, Dordrecht, pp 167-183.
Bernatchez L and Osinov AG (1995) Genetic diversity of trout
(genusSalmo) from its most eastern native range based on
mitochondrial DNA and nuclear gene variation. Mol Ecol 4:285-297.
Birstein VJ and Bemis WE (1997) How many species are there
within the genusAcipenser? In: Birstein VJ, Waldman JR
and Bemis WE (eds) Sturgeon Biodiversity and Conserva-tion. Kluwer Academic Publishers, Dordrecht, pp 25-71.
Birstein VJ and DeSalle R (1998) Molecular phylogeny of Acipenserinae. Mol Phylogenet Evol 9:141-155.
Birstein VJ, Doukakis P and DeSalle R (2000) Polyphyly of
mtDNA lineages in the Russian sturgeon, Acipenser
gueldenstaedtii: Forensic and evolutionary implications.
Conserv Genet 1:81-88.
Blair ME, Gutierrez-Espeleta GA and Melnick DJ (2013) Subspe-cies of the Central American squirrel monkey (Saimiri oerstedii) as units for conservation. Int J Primatol 34:86-98. Brown JR, Beckenbach AT and Smith MJ (1993) Intraspecific
DNA sequence variation of the mitochondrial control region of white sturgeon (Acipenser transmontanus). Mol Biol Evol 10:326-341.
Charles K, Guyomard R, Hoyheim B, Ombredane D and Bagli-niere JL (2005) Lack of genetic differentiation between ana-dromous and resident sympatric brown trout (Salmo trutta) in a Normandy population. Aquat Living Resour 18:65-69. Chebanov MS, Karnaukhov GI, Galich EV and Chmir YN (2002)
Hatchery stock enhancement and conservation of sturgeon, with an emphasis on the Sea of Azov populations. J Appl Ichthyol 18:463-469.
Chugunov NL and Chugunova NI (1964) A comparative commer-cial and biological characteristics of the Sea of Azov acipenserids. Tr VNIRO 51:87-112.
Cracraft J (1983) Species concepts and speciation analysis. In: Richard F Johnston and Dennis M Power (eds) Current Or-nithology, Vol 1. Plenum Press, New York, pp 159-187. Crandall KA, Bininda-Emonds OR, Mace GM and Wayne RK
(2000) Considering evolutionary processes in conservation biology. Trends Ecol Evol 15:290-295.
Davis JI and Nixon KC (1992) Populations, genetic variation and the delimitation of phylogenetic species. Syst Biol 41:421-435.
Doukakis P, Birstein VJ and DeSalle R (2005) Intraspecific struc-ture within three caviar-producing sturgeons (Acipenser
gueldenstaedtii,A. stellatus, andHuso huso) based on
mito-chondrial DNA analysis. J Appl Ichthyol 21:457-460. Doukakis P, Birstein VJ, Ruban GI and Desalle R (1999)
Molecu-lar genetic analysis among subspecies of two Eurasian
stur-geon speciesAcipenser baeriiand A. stellatus. Mol Ecol
8:S117-S127.
Grunwald C, Stablie J, Waldman JR, Gross R and Wirgin I (2002)
Population genetics of shortnose sturgeon Acipenser
brevirostrum based on mitochondrial DNA control region
sequences. Mol Ecol 11:1885-1889.
Guenette S, Fortin R and Rassart E (1993) Mitochondrial DNA variation in lake sturgeon (Acipenser fulvescens) from the St Lawrence River and James Bay drainage basins in Quebec, Canada. Can J Fish Aquat Sci 50:659-664.
Holcick J and Jedlicka L (1994) Geographical variation of some taxonomically important characters in fishes: The case of
bitterlingRodheus sericeus. Environ Biol Fish 41:147-170.
Jones RW and Simmons MD (1996) A review of the stratigraphy of Eastern Paratethys (Oligocene-Holocene). Bull Br Mus Nat Hist Geol 52:25-49.
Khodorevskaya RP, Krasikov EV, Dovgopol GF and Zhuravleva OL (2000) Formation of the stock of Caspian Acipenserids under present-day conditions. J Ichthyol 40:602-609. Khodorevskaya RP, Ruban GI and Pavlov DS (2009) Behaviour,
Volga-Caspian Basin. Books on Demand GmbH, Norderstedt, 233 pp.
Khoshkholgh M, Pourkazemi M, Nazari S and Azizzadeh-Pormehr L (2011) Genetic diversity in the Persian sturgeon, Acipenser percicus, from the south Caspian Sea based on mitochondrial DNA sequences of the control region. Cas-pian J Environ Sci 9:17-25.
Koressaar T and Remm M (2007) Enhancements and modifica-tions of primer design program Primer3. Bioinformatics 23:1289-1291.
Larkin MA, Blackshields G, Brown NP, Chenna R, McGettigan PA, McWilliam H, Valentin F, Wallace IM, Wilm A, Lopez
R,et al.(2007) Clustal W and Clustal X version 2.0.
Bioin-formatics 23:2947-2948.
Librado P and Rozas J (2009) DnaSPv5: A software for compre-hensive analysis of DNA polymorphism data. Bioinfor-matics 25:1451-1452.
Moritz C (1994) Defining “evolutionary significant units” for conservation. Trends Ecol Evol 9:373-375.
Osinov A and Bernatchez L (1996) Atlantic and Danubian
phylo-genetic groupings of brown trout (Salmo truttaL.) complex:
Genetic divergence, evolution, and conservation. J Ichthyol 36:762-786.
Page RD (1996) TreeView: An application to display phylogen-etic trees on personal computers. CABiOS 12:357-368. Pirogovskii MI, Sokolov LI and Vasil’ev V (1989) General
intro-duction to fishes, Acipenseriformes.Huso husoLinnaeus,
1758. In: Holcik J (eds) The Freshwater Fishes of Europe. Vol. 1, Part II. AULA-Verlag, Wiesbaden, pp 156-200. Posada D and Crandall KA (1998) Modeltest: Testing the model
of DNA substitution. Bioinformatics 14:817-818.
Reynolds J, Weir BS and Cockerham CC (1983) Estimation of the coancestry coefficient: Basis for a short-term genetic dis-tance. Genetics 105:767-779.
Secor DH, Arefjev V, Nikolaev A and Sharov A (2000) Restora-tion of sturgeons; lessons from the Caspian Sea sturgeon Ranching Programme. Fish Fish 1:215-230.
Shubina TN, Popova AA and Vasilev VP (1989) General
Intro-duction to Fishes, Acipenseriformes. Acipenser stellatus
Pallas, 1771. In: Holcik J (ed) The Freshwater Fishes of Eu-rope. Vol. 1, Part II. AULA-Verlag, Wiesbaden, pp 395-443.
Sokolov LI and Tspekin EA (1996) Acipenserids of the Azov-Black Sea and the Caspian basins (a historical review). Vopr Ikhtiol 36:15-27.
Taggart JB, Hynes RA, Prodohol PA and Ferguson A (1992) A simplified protocol for routine total DNA isolation from salmonid fishes. J Fish Biol 40:963-965.
Tamura K, Peterson D, Peterson N, Stecher G, Nei M and Kumar S (2011) MEGA5: Molecular Evolutionary Genetics Analy-sis using maximum likelihood, evolutionary distance, and maximum parsimony methods. Mol Biol Evol 28:2731-2739.
Tsvetnenko YB (1993) The effectiveness and genetic conse-quences of the introduction of the stellate sturgeon, Acipenser stellatus, into the Azov basin from the Caspian Sea. J Ichthyol 33:1-10.
Untergrasser A, Cutcutache I, Koressaar T, Ye J, Faircloth BC, Remm M and Rozen SG (2012) Primer3 - New capabilities and interfaces. Nucleic Acids Res 40:e115.
Vlasenko AD, Pavlov AV and Vasil’ev VP (1989) General
Intro-duction to fishes, Acipenseriformes. Acipenser
gueldenstaedtiiBrandt, 1833. In: Holcik J (ed) The
Fresh-water Fishes of Europe. Vol. 1, Part II. AULA-Verlag, Wiesbaden, pp 294-344.
Walsh PD (2000) Sample size for diagnosis of conservation units. Conserv Biol 14:1533-1537.
Waples RS (1991) Definition of “species” under the Endangered Species Act: Application to Pacific Salmon. NOAA (Na-tional Oceanic and Atmospheric Administration). Technical
Memorandum, National Marine Fisheries Service,
F/NWC-194. Northwest Fisheries Science Center, Seattle. Weir B and Cockerham C (1984) Estimating F statistics for the
analysis of population structure. Evolution 38:1358-1370. Wirgin I, Grunwald C, Carlson E, Stabile J, Peterson D and
Waldman J (2005) Range-wide population structure of
shortnose sturgeon Acipenser brevirostrum based on
se-quence analysis of mitochondrial DNA control region. Estu-aries 28:406-421.
Wirgin I, Waldman JR, Rosko L, Gross R, Collins MR, Rogers SG and Stabile J (2000) Genetic structure of Atlantic stur-geon populations based on mitochondrial DNA control re-gions sequences. Trans American Fish Soc 129:476-486. Zubakov VA (1988) Climatostratigraphic scheme of the Black
Sea Pleistocene and its correlation with the oxygen-isotope scale and glacial events. Quart Res 29:1-24.
Internet Resources
Gesner J, Freyhof J and Kottelat M (2010)Acipenser
gueldenstaedtii.In: IUCN 2013. IUCN Red List of
Threatened Species. Version 2013.1,
http://www.iucnredlist.org (accessed at September 14, 2013).
Qiwei W (2010)Acipenser stellatus. In: IUCN 2013. IUCN Red
List of Threatened Species. Version 2013.1,
http://www.iucnredlist.org (accessed at September 14, 2013).
NETWORK v4.6.1,
http://www.flux-us-engineering.com/sharenet.htm (accessed at February 19, 2013).
Supplementary Material
The following online material is available for this article: - Table S1 - GenBank D-loop sequences from sturgeons subspecies.
- Figure S1 - Variable sites in unique haplotypes of A. gueldenstaedtiiD-loop region.
- Figure S2 - Variable sites in unique haplotypes of A. stellatusD-loop region.
- Figure S3 - Variable sites in unique haplotypes ofH. huso
D-loop region.
This material is available as part of the online article from http://www.scielo.br/gmb.
Associate Editor: Antonio Solé-Cava