SEGMENTS OF COMPETITION IN SOUTH
BRAZILIAN WINERIES
Marcelo Miele1*; Arlei Coldebella1; Paulo Dabdab Waquil2; Alberto Miele3
1
Embrapa Suínos e Aves, BR 153, Km 110 - 89700-000 - Concórdia, SC - Brasil. 2
UFRGS/FCE/DE, Av. João Pessoa, 31 - 90040-000 - Porto Alegre, RS - Brasil. 3
Embrapa Uva e Vinho, R. Livramento, 515 - 95700-000 - Bento Gonçalves, RS - Brasil. *Corresponding author <[email protected]>
ABSTRACT: The international restructuring process in the beverage sector reached the winemaking business in the 1990s, changing its panorama. Increasing competitive pressure is a characteristic of this period with significant impact in regions such as the countries belonging to the Mercosul block. To support firm strategies and public policies, the goal of this study was to identify the competition segments in winemaking in Rio Grande do Sul, the southern state of Brazil, and in a specific form to propose a typology of wineries based on the Industrial Organization literature. The data used are from the State Wineries Data Bank of Rio Grande do Sul, which were submitted to multivariate statistical analysis, integrating a cluster and principal components analysis in a group of 381 observations. The results showed the existence of two factors, one related to scale and diversification, and the other related to the quality of the products and of the raw material. From these factors, six groups of wineries were identified that can be named segments of competition in winemaking. Group 1 is characterized by quality and specialization; group 2, by a large production scale and diversification; group 3, by a low added value; group 4, by a micro production scale; and groups 5 and 6, by a low added value, small scale, and specialization.
Key words: agribusiness, diversification, scale, typology, wine
SEGMENTOS DE COMPETIÇÃO EM VINÍCOLAS
DO SUL DO BRASIL
RESUMO: O processo de reestruturação internacional no setor de bebidas atingiu a vitivinicultura na década de 1990, alterando o seu panorama. Característico a esse período é o aumento da pressão competitiva, com impactos significativos em regiões como a dos países membros do Mercosul. Para apoiar as estratégias empresariais e as políticas públicas, o objetivo deste estudo foi identificar os segmentos de concorrência da vitivinicultura do Rio Grande do Sul e, de forma específica, propor uma tipologia das vinícolas gaúchas com base na literatura da Organização Industrial. Utilizaram-se os dados do Cadastro Vinícola do Rio Grande do Sul os quais foram submetidos à análise estatística multivariada, integrando análises de agrupamento e de componentes principais em um conjunto de 381 observações. Os resultados apontaram para a existência de dois fatores, um relacionado à escala e diversificação e o outro à qualidade dos produtos e da matéria-prima. A partir desses fatores, foram identificados seis grupos de vinícolas que podem ser denominados de segmentos de concorrência na vitivinicultura gaúcha. O grupo 1 se caracteriza pela qualidade e especialização; o 2, pela grande escala de produção e diversificação; o 3, pelo baixo valor agregado; o 4, pela micro escala de produção; e os grupos 5 e 6, pelo baixo valor agregado, pequena escala e especialização.
Palavras-chave: agronegócio, diversificação, escala, tipologia, vinho
INTRODUCTION
Brazil holds the 17th position in the
interna-tional wine scenario, with 1.2% of the produced vol-ume (Anderson et al., 2001), the southern state of Rio Grande do Sul being responsible for about 90% of the production. The national market is considered small with a low per capitaconsumption. The classification
determined by the Brazilian legislation allows the iden-tification of more than 25 products derived from grape
re-search (2002), only 103 were quality wine and 32 spar-kling winemakers.
Thus, the profile of this production contrasts with the competitive international environment which was outlined in the 1990s, when companies developed a range of products of superior quality, nearly always orientated to larger consumer markets through well-known brands (Anderson et al., 2001; Green & Santos, 2002). This difference between the positioning of the sector in Brazil and the international market trend re-flects the low export performance as well as the com-petition of imported wine in the higher added value segment (Miele, 2004). In fact, the share of imported wine in the total consumption of quality products in Brazil went from 41% in 1998 to 65% in 2004 (Uvibra, 2005). This effective threat points to the need of re-flection about strategic decisions of the companies and cooperatives, as well as the formulation of public poli-cies or collective actions. To support them, the goal of this study was to identify segments of competition in winemaking in the state of Rio Grande do Sul, and in a specific form, to propose a typology of wineries from their market structure and conduct characteristics based on data from the State Wineries Data Bank, year 2002 (Mello, 2001; Cadastro, 2002).
MATERIAL AND METHODS
There are many methodological and theoreti-cal approaches which try to explain the nature, the growth, and the limits of the firms, besides the market structures and the competitive ambient. The present study has as theoretical referential the Industrial Or-ganization (IO), which characterizes an industry com-petition from the market structure where the firms (pro-ducers and buyers) are inserted, the different strategies adopted by them, the performance and the institutional and technological environment (Scherer & Ross, 1990; Farina et al., 1997).
In this paradigm, named Structure-Conduct-Performance (SCP), a market structure is characterized by different variables, like number of the producers and buyers, their scale of production and market partici-pation, the product differentiation, cost structure, and the geographical and sectorial diversification of the firms (Scherer & Ross, 1990). The SCP literature is complemented with chain and agri-systems analysis, like the Commodity System Approach (CSA), which explores the vertical relationship between the differ-ent phases of production and marketing, and the orga-nizational and geographical extension of the supply and distribution chain (Goldberg, 1968; Zylberstajn, 1995; Zylberstajn & Farina, 1998). Britto (2002) points out to the need of verifying the possible diversifica-tion direcdiversifica-tions (horizontal, vertical, and concentric) and forms (investments in new capacities, fusions, and ac-quisitions). Variables as segmentation, diversification, and differentiation are not only considered as market structure characteristics but also as indicatives of the strategies adopted by the firms (Farina et al., 1997; Mintzberg & Quinn, 1998; Britto, 2002).
The possibility to analyze multiple variables is interesting for this study. Together, these variables characterize the structure and the strategies in the South Brazilian wine industry, which permit, even though partially, a better understanding of the differ-ent segmdiffer-ents of competition in this industry. The source of data for this study is the State Wineries Data Bank of Rio Grande do Sul – 2001-2002, which can be used as proxies for the theoretical IO variables, as shown in Table 1, leading to a multivariate winery ty-pology and market structure characterization.
The State Wineries Data Bank of Rio Grande do Sul was developed by the Enology Division of the State Secretary of Agriculture and the Brazilian Wine Institute – Ibravin (Mello, 2001; Cadastro, 2002). From the legal point of view, wineries are responsible to
pre-Table 1 - Description of the variables.
e l b a i r a v l a c i t e r o e h
T Proxyused Name
e l a c s n o i t c u d o r
P Totalcommercializedvolume SCALE l a c i h p a r g o e G e h t f o n o i s n e t x e n i a h c e u l a v n o i t u b i r t s i
D SalesoutsideRioGrandedoSul(%) SALESEXTENT y
l p p u
S Purchasesoutsidethedistrict(%) SUPPLYEXTENT
y t i l a u Q t c u d o r
P Productswithaddedvalue (%) ADDEDVALUE l a i r e t a m w a
R Measureofsugarinthe acquiredgrapes SUGAR
a r e f i n i v s i t i
V grapes fromthe totalacquired(%) VINIFERA
n o i t a c i f i s r e v i D s t c u d o r
P Number ofproducts fromthewinery NPRODUCTS s t c u d o r p s t n a t r o p m i t s o m o w t e h t f o o i t a r n o i t a r t n e c n o
C CRPRODUCTS
s t e k r a
M Number ofdestinies NDESTINIES s e l a s f o s e i n i t s e d s t n a t r o p m i t s o m o w t e h t f o o i t a r n o i t a r t n e c n o
pare an annual report which is the base for the referred data bank. Actually, it is an important instrument for the state agricultural policy directed to wine control and inspection. Besides, due to the amount of infor-mation, it presents useful data for economic and orga-nizational studies in winemaking.
The sales volume of wine and derivatives of grape and wine is considered a scale proxy, and it is named SCALE. The percentage of sales of the winery outside the state of origin is a proxy for the geographi-cal extension of the distribution chain, and it is named SALESEXTENT. The percentage of purchase of raw material outside the winery district is considered a proxy for the geographical extension of the supply chain, and it is named SUPPLYEXTENT.
The quality of the wine and products derived from wine and grape can be quantified through labo-ratory and sensory analysis. Besides the difficulty in operating this procedure to all wineries, subjective as-pects and cultural influences have to be considered when analyzing consumer choices. Therefore, it was chosen to define the quality of the product from some easily checkable and objective characteristics related to the added value of the product. This variable is named ADDEDVALUE, and it is measured as the pro-portion of higher added value sales in the total volume of sales, which is considered a proxy to the extent to which the winery competes in better quality segments. Added value sales are bottled wines (in bottles until 750 mL) produced with Vitis vinifera grapes, bottled
grape juice (in bottles until 750 mL), sparkling wine, and bottled cooler (in bottles until 750 mL). To define the quality of the raw material, two indicators were used, i.e., the average sugar concentration of acquired grapes, named SUGAR, and the proportion of Vitis vin-ifera grapes and the total acquired grapes, named
VIN-IFERA.
The degree of diversification of winery prod-ucts was measured from two indicators. The first is the number of products of the winery, named NPRODUCTS and the second is the proportion of sales of the two main products in the total sales (a kind of concentration ratio-CR), which is named CRPRODUCTS. It was considered as different prod-ucts the combination of three dimensions used in the data bank, which are: product (wine, sparkling wine, vinegar, juice etc.), classification (vinifera, table, sweetened etc.), and type (white, red, rosé). The dif-ference in type of packaging was not considered as this dimension is considered in variable ADDEDVALUE. The degree of the diversification of sale destinies was measured from two indicators. The first is the number of destinies supplied by the winery, named NDESTINIES. The other one is the proportion of the
two main destinies in the total sales (a kind of con-centration ratio-CR), which is named CRDESTINY. Destiny should be understood as the number of sup-plied states (political division in Brazil) plus the for-eign markets.
Analyzed in group, the variables SALESEXTENT, SUPPLYEXTENT, NDESTINIES and CRDESTINY can also lead to the organizational extension of the supply chain, since supplying for a larger number of markets and from a larger number of producers implies in a more complex structure and skills in sales, marketing, purchases and logistics.
Quantitative techniques were used to investi-gate 381 observations corresponding to the analyzed universe. Initially, average, standard deviation, and minimum and maximum values were calculated for each variable, in order to obtain a summary of the in-formation and to identify possible great differences re-garding the variability of the variables. From this in-formation, variables were standardized and data were evaluated trough principal component analyses and cluster analyses. The principal component analysis was used to better understand the results issued from the cluster analysis. Discriminated winery groups were validated through analysis of variance and the Tukey test.
RESULTS AND DISCUSSION
There is a great variation among the observa-tions (Table 2), mostly for the variables SCALE, NDESTINIES, and NPRODUCTS.
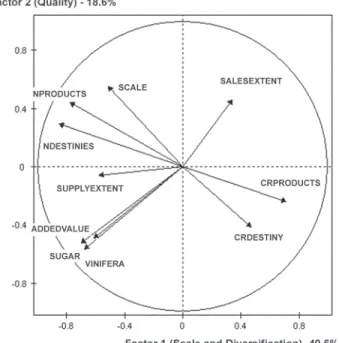
The second identified factor can be named ‘quality’. The variables ADDEDVALUE, SUGAR, and VINIFERA are closely related, which is ex-plained by the fact that products of higher quality have multiple attributes like packaging in bottles, type of product, and type and quality of the raw material. These variables are also associated to the variable SUPPLYEXTENT, indicating that a quest for quality is linked to an effort in obtaining raw ma-terial in districts other than the headquarters of the company. On the other hand, this group of variables is in opposition to the variable SALESEXTENT, in-dicating that the quality of the product is associated to the local retail, with a smaller geographical scope.
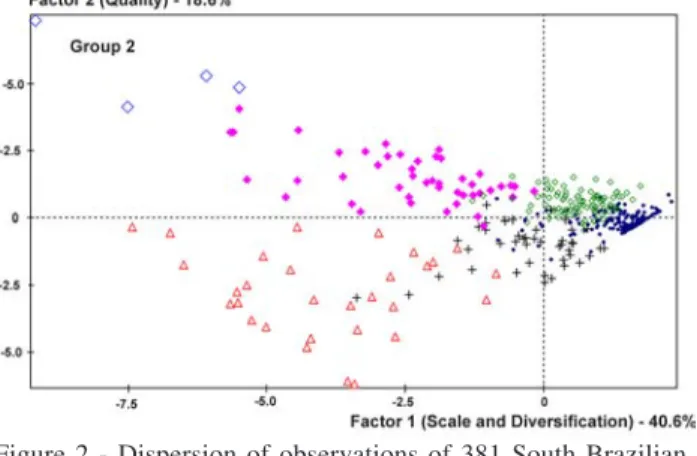
The cluster analysis pointed to six winery groups in Rio Grande do Sul, according to the dispersion among the two factors shown in Figure 2, and the average test among the groups in Table 4. From this analyses it is possible to characterize six winery groups which can be called strategic seg-ments in winemaking in the state of Rio Grande do Sul.
Table 3 - Correlation matrix of scale proxies with standardized data.
Source: State Wineries Data Bank of Rio Grande do Sul, 2002. *Variables description is in Table 1. * s e l b a i r a
V SCALE SALESEXTENTADDEDVALUE NPRODUCTS CRPRODUCTSNDESTINIESCRDESTINY SUGARVINIFERA
T N E T X E S E L A
S 0.06
E U L A V D E D D
A 0.07 -0.29
S T C U D O R P
N 0.60 -0.22 0.23
S T C U D O R P R
C -0.39 0.32 -0.32 -0.72
S E I N I T S E D
N 0.49 -0.05 0.49 0.74 -0.54
Y N I T S E D R
C -0.24 -0.16 -0.21 -0.37 0.25 -0.62
R A G U
S 0.15 -0.36 0.55 0.24 -0.21 0.35 -0.09
A R E F I N I
V 0.05 -0.26 0.85 0.22 -0.27 0.45 -0.15 0.59
T N E T X E Y L P P U
S 0.26 -0.20 0.29 0.37 -0.30 0.42 -0.13 0.36 0.33
Figure 1 - Representation of the principal component analysis of the nine variables of 381 South Brazilian wineries, where the factor 1 represented 40.6% and the factor 2 18.6% of the total variation.
Table 2 - Descriptive statistics of the nine variables related to 381 South Brazilian wineries.
Source: State Wineries Data Bank of Rio Grande do Sul, 2002. *Variables description is in Table 1.
* s e l b a i r a
V Average StandardDeviation Minimum Maximum Y N I T S E D R
C 85% 16% 44% 100%
S T C U D O R P R
C 95% 10% 48% 100%
T N E T X E Y L P P U
S 21% 28% 0% 100%
T N E T X E S E L A
S 82% 31% 0% 100%
R A G U
S 14.5 0.9 12.0 19.1
S E I N I T S E D
N 5.5 6.0 1.0 28.0
S T C U D O R P
N 2.9 2.7 1.0 18.0
) s d n a s u o h t n i ( E L A C
S 756 2,371 0.01 26,592 A R E F I N I
V 10% 24% 0% 100%
E U L A V D E D D
Table 4 - Group means and Tukey test of the evaluated variables.
Source: State Wineries Data Bank of Rio Grande do Sul, 2002. Means followed by distinct letters in the lines differ by the Tukey test (P < 0.05). *Variables description is in Table 1.
* s e l b a i r a
V Group
1 2 3 4 5 6
s e i r e n i w º .
N 30 4 46 43 149 109
Y N I T S E D R
C 80%b 59%c 73%b 97%a 97%a 73%b S
T C U D O R P R
C 89%b 67%c 85%b 91%b 100%a 99%a T
N E T X E Y L P P U
S 43%a 49%a 50%a 28%ab 16%b 7%b T
N E T X E S E L A
S 55%b 86%a 86%a 11%c 99%a 94%a R
A G U
S 16.1a 15.2b 14.7bc 14.8bc 14.1c 14.2c S
E I N I T S E D
N 12.7b 23.8a 14.9b 2.7c 2.0c 4.9c S
T C U D O R P
N 4.1c 14.8a 7.2b 3.4cd 1.4e 2.3de )
s d n a s u o h t n i ( E L A C
S 628c 18.341a 2.720b 116c 185c 349c A
R E F I N I
V 86%a 17%b 11%bc 4%cd 2%cd 1%d E
U L A V D E D D
A 68%a 19%b 8%bc 7%c 0.1%c 0.1%c
Group description
Group 1 is made up of 30 wineries, one being a public stock company, three multinational companies in the beverage sector, and none of them a cooperative.
Table 5 - Market share of the groups per sale volume.
Source: State Wineries Data Bank of Rio Grande do Sul, 2002.
p u o r
G Commercialization(inthousands liters) l
a t o
T Qualitywine Qualitysparklingwine 1 18.852 7% 11.138 47% 2.221 52% 2 73.364 25% 9.501 40% 1.497 35% 3 125.112 43% 2.804 12% 533 13% 4 4.998 2% 75 0.3% 0 0% 5 27.610 10% 20 0.1% 0 0% 6 38.012 13% 218 1% 0 0%
l a t o
T 287.948 100% 23.755 100% 4.251 100%
This group represents 6.5% of the commercialized vol-ume of wine and derivatives from wine and grape, and 7.9% of the number of wineries. However, it concen-trates the production of sparkling wine and quality wine, with 52.2% and 46.9% of the total sales in volume of these items, respectively, as shown in Tables 5 and 6.
The companies in group 1, have in general a medium and large scale, but there are some exceptions of small wineries. In larger scale wineries, the distri-bution has a national scope, and in the medium and small wineries of the group the local market has a sig-nificant importance. The supply of raw material is re-gional, with an effort in finding quality grapes in com-munes other than the headquarter of the company. This should enable larger scales of production and points to an organizational effort in obtaining raw material. The cases which essentially present local supply of raw material refer to some medium and small wineries, or companies located in communes with large land ex-tensions in the south of the state, outside the traditional producing region, where small farms predominate. Figure 2 - Dispersion of observations of 381 South Brazilian
Nearly all the wineries in group 1 commercial-ize products with a higher added value and superior quality raw material, and in general are little diversi-fied in terms of range of products and averagely di-versified in terms of geographic markets. However, in some large wineries from this group there is lower added value, above all in relation to the type of pack-aging (in bulk) and not in relation to the type of uct (predominates quality wine in the range of prod-ucts from these companies). It can be said that the lead-ing companies in the quality products segment are found in this group. In fact, between the 10 first win-eries in the quality wine and sparkling wine sales rank-ing, five are from group 1.
Group 2 is made up of four of the five largest wineries, one of them being a cooperative. They can be said to be leaders in sharing the market, with the cooperative as number one in the list. In total, it rep-resents 25.5% of the sales volume of wine and deriva-tives of grape and wine (the largest winery has 9.2% of the volume), and represents only 1.0% of the num-ber of wineries. Like the previous group, it represents a significant portion in the sales of sparkling wine and quality wine, with 35.2% and 40.0%, respectively, as shown in Tables 5 and 6.
Being large wineries, the variable SCALE de-fines the fitting in the group. The distribution has a na-tional scope and the grape supply is regional, charac-terizing an effort to assure large volumes or better qual-ity. This should enable larger production scales and points to an organizational effort in obtaining raw ma-terial. The cooperative in this group is an exception, essentially presenting local supply of raw material.
This group is essentially characterized by the scale of its components. However, two of the winer-ies have higher added value products with better qual-ity raw material and product diversification. Because of this, they are similar to some companies in group 1. However, because of the scale and the wide range of products, it is natural to have an ADDEDVALUE
percentage inferior to that of group 1. The other two wineries show low added value, low quality, and little diversification in products, similar to the largest win-eries in group 3. The winwin-eries in this group are diver-sified in relation to geographical markets, especially regarding the scale needs.
Group 3 is made up of 46 wineries, nine of them being cooperatives. It represents 43.4% of the sales of wine and grape and wine derivatives, and 12.1% of the number of wineries. Large scale winer-ies predominate, with some medium companwiner-ies. The distribution has national scope and the supply of raw material is regional. This should enable larger produc-tion scales and points to an organizaproduc-tional effort in ob-taining raw material. The supply between cooperatives in this group is more local than the other wineries. With some exceptions, these wineries have low added value products and low quality raw material. Also, they are diversified in relation to the range of products and geo-graphical markets. Together with the wineries from group 2, they are leaders in terms of sales volume of table wine and cooler.
Group 4 is made up of 43 wineries, one of them being a cooperative. It represents only 1.7% of the sales volume of wine and grape and wine deriva-tives, and 11.3% of the number of wineries, as shown in Tables 5 and 6. These wineries are mainly micro companies which fit into what is conventionally called a ‘family agroindustry’, with essentially local distribu-tion and supply. The products have low added value, with low quality raw material. The wineries in this group are specialized (not diversified) in relation to the range of products and geographical markets.
Group 5 is made up of 149 wineries, three of them being cooperatives. It represents 9.6% of the sales volume of wine and grape and wine derivatives, and 39.1% of the number of wineries as shown in Tables 5 and 6. The scale is varied, having medium, small, and micro wineries. However, together with group 6, it concentrates the majority of small wineries. The dis-Table 6 - Market share of the groups per number of wineries.
Source: State Wineries Data Bank of Rio Grande do Sul, 2002.
p u o r
G Numberofwineries l
a t o
T Qualitywine Qualitysparklingwine
1 30 8% 30 29% 17 53%
2 4 1% 4 4% 4 13%
3 46 12% 35 34% 11 34%
4 43 11% 16 16% 0 0%
5 149 39% 3 3% 0 0%
6 109 29% 15 15% 0 0%
l a t o
tribution is essentially national, with little presence in the local market, indicating subordination to the supply chain of bottling companies from other states, near larger consumer centers as São Paulo and Rio de Janeiro. The supply is essentially local in the majority of the winer-ies in this group, with exceptions above all in those of larger scale. The products have very low added value, being distributed in bulk. The wineries from this group are specialized (not diversified) in relation to the range of products and geographical markets.
Group 6 is made up of 109 wineries, three of them being cooperatives. It represents 13.2% of the commercialized volume of wine and grape and wine derivatives, and 28.6% of the number of wineries as shown in Tables 5 and 6. Its characteristics are simi-lar to group 5, but represent a simi-larger diversification in relation to geographical markets.
Firm strategies, public policies, and research impli-cations
Wineries of group 1, and to a certain extent in group 2, have a closer profile to international compe-tition and are more associated to the changes verified through the decade and exposed to the competition of imports. In these groups, the three multinational com-panies of the beverage sector that act in the country are present, as well the leading wineries in production and commercialization of quality wine, table wine, sparkling wine, cooler, and grape juice.
The challenges of the larger companies in these groups are increase the efficiency of their logistics and the coordination of raw material supply, strength the brand to face large retailers and, in some cases, update processing and packaging technologies. The smaller companies of group 1 have as challenge to develop their competencies in direct sales to the consumer, as-sociated to tourism, possibly exploring local charac-teristics, in direction to controlled geographical indi-cations. This option seems to be limited to smaller scale companies from group 1, leader organizations that achieve to coordinate actions in different geo-graphical indications, and some cooperatives from groups 2 and 3 which have as a predominant charac-teristic the local supply of raw material. This coopera-tive advantage also plays an important role for the lo-cal development.
The great diversity in products (wide range) of the wineries of group 2, which encompasses an expres-sive volume of high as well as low added value prod-ucts, represents a straight relation between these seg-ments. Although there is a clear distinction among con-sumers of these products and between distribution channels and grape suppliers, the organizations which process and sale these products are the same. Two sets
of challenges arise here. First, the need to have such a diversity of products should be analyzed by winery strategists. Second, the fact that these wineries act in various segments should be considered by public policy makers, who usually focus only on one type of product, misunderstanding the relation among these segments. They should attempt to the set of possibili-ties allowed by the wineries and by the structure of the grape production, with predomination of American and hybrid varieties and, consequently, the production of table wine. This relation between high and low added value products is also found in group 3, although less expressive. The additional challenge which is put to this group would be to increase the higher added value product share, but not only through those linked to sparkling and quality wine, but through investments in the bottling line of the table wine and product innova-tions, such as the cooler.
The wineries of group 4, called family agroindustries, are associated to subsistence activities, of little organizational complexity, and management limitations. The challenge of this group is associated to competence in the winery and the vineyard manage-ment, as well as enlarging commercializing spaces. In this sense, the outsourcing of supply for medium and large wineries to enlarge scale and have market expe-rience is presented as an alternative to those whose strategic option is growth. The other option for this group is increasing ties with local retailers or joining a tourist route, both with implications to sale skills.
The wineries in groups 5 and 6 are subordi-nated to supply strategies of other wineries and bot-tling companies, most of them located in the main con-sumer centers of the country. One of the main chal-lenges that arises from this bulk distribution channel is the need for inspection and control not only in the state of Rio Grande do Sul, but with the same severity in other states. This strict inspection and control not only qualifies the relation between wineries in group 5 and 6 and their commercial partners, but also would avoid the possibility of disloyal competition from the bottling companies in relation to wineries from groups 2 and 3. Considerations in relation to the range of prod-ucts and higher added value pointed out to group 3 are also valid for the wineries of this group.
Viticulture Data Bank of Rio Grande do Sul and bases developed through specific research (Freire et al., 1992; Miele, 2000; Fensterseifer et al., 2003). It is be-lieved that this articulation and new studies enable to qualify the characterization of wine producers adding to the present analysis proxies to theoretical variables here absent, such as institutional and organizational dimensions, and cost and profit measures.
CONCLUSIONS
There is a discrepancy between the recent de-velopments in worldwide winemaking and the profile of production in Brazil. Because of this, it is consid-ered important to identify segments of competition to evaluate its potential competition facing increasing imported products. From a theoretical point of view, it is supposed that understanding the ways of produc-tion and distribuproduc-tion of goods has to map elements pro-posed through the SCP paradigm and the CSA ap-proach. In this way, it is believed that this study might be useful in proposing a typology of the winemaking companies and cooperatives, based on some of its microeconomic characteristics.
In the South Brazilian wineries, an increase in the production scale requires a larger geographical di-versification, considering both sale destinies and raw material supply. Otherwise, the great scale of produc-tion is not necessarily associated to the product differ-entiation, because there are large and specialized win-eries of which the main focus is a narrow range of products. The quality is associated to a strategy of spe-cialization in terms of the range of products, and, in the case of the smaller wineries, to local supply and distribution. Otherwise, the low quality is verified in different dimensions and degrees of diversification or specialization, which is not a characteristic of a spe-cific organization format. Nevertheless, it is strongly associated to a strategy disconnected from the local market and dependent on the bulk distribution. Six groups of winemaking companies were identified, with a great diversity in strategies and organizations, pre-senting different challenges for strategic options and public policies. Group 1 is characterized by quality and specialization; group 2, by a large production scale and diversification; group 3, by a low added value; group 4, by a micro production scale; and groups 5 and 6, by low added value, small scale, and specialization.
ACKNOWLEDGEMENTS
To Mr. Plinio Manosso, head of the Enology Division of the Agricultural Secretary (DE/DPV/SAA-RS); Mr. Carlos Paviani, Executive President of the
Brazilian Wine Institute - Ibravin; and Mr. Juliano Corteze, for their support and attention; to Miss Caro-lina Talamini, for her contribution to the English text.
REFERENCES
ANDERSON, K.; NORMAN, D.; WITTWER, G. Globalization and the world’s wine markets: overview. Adelaide: Adelaide University, 2001. (CIES Discussion Paper, 143).
BRITTO, J. Diversificação, competências e coerência produtiva. In: KUPFER, D.; HASENCLEVER, L. (Org.). Economia industrial: fundamentos teóricos e práticas no Brasil. Rio de Janeiro: Campus, 2002. 680p.
CADASTRO Vinícola do Rio Grande do Sul: 2001/2002. Versão 1.0.Bento Gonçalves: Divisão de Enologia/DPV/SAA; Ibravin, 2002. 1 CD-ROM.
FARINA, E.M.M.Q.; AZEVEDO, P.F.; SAES, M.S.M.
Competitividade: mercado, Estado e organizações. São Paulo: Singular, 1997. 286p.
FENSTERSEIFER, J.E.; LOCKMANN, M.E.; ALIEVI, R.M.; WILK, E.O.; MIELE, M.; PEDROZO, E.A. Estratégias de produção e distribuição na indústria vinícola: opções estratégicas para as empresas brasileiras e o papel da cooperação inter-firma. Porto Alegre: UFRGS, 2003. 74p. (Relatório de Projeto de Pesquisa do CNPq).
FREIRE, L.M. de M.; FREIRE, J. de M.; CALDART, W.L.
Transformações na estrutura produtiva dos viticultores da Serra Gaúcha 1985/1991. Bento Gonçalves: EMBRAPA, CNPUV, 1992. 44p. (Documentos, 7).
GOLDBERG, R.A. Agribusiness coordination: a system approach to the wheat, soybean, and Florida orange economies. Cambridge: Harvard University, 1968. 256p.
GREEN, R.; SANTOS, R.R. El mercado mundial del vino: perspectivas para Brasil. Bento Gonçalves: Vino Brasil, 2002.
MELLO, L.M.R. de. (Ed.). Cadastro Vitícola do Rio Grande do Sul: 1995/2000. Versão 1.0.Bento Gonçalves: Embrapa Uva e Vinho: Ibravin, 2001. 1 CD-ROM.
MIELE, M. Análise da transação entre produtores de uva e agroindústria vinícola: o caso dos vinhos finos no sistema agro-industrial vitivinícola do Rio Grande do Sul. São Paulo: FEA/USP, 2000. 109p. (Dissertação - Mestrado).
MIELE, M. Análise do Cadastro Vinícola do Rio Grande do Sul para um processo inicial de caracterização do sistema agroindustrial vitivinícola gaúcho. In: CONGRESSO BRASILEIRO DE ECONOMIA E SOCIOLOGIA RURAL, 42., Cuiabá, 2004.
Dinâmicas setoriais e desenvolvimento regional:anais. Cuiabá: Sociedade Brasileira de Economia e Sociologia Rural, 2004. p.1-14. MINTZBERG, H.; QUINN, J.B. O processo da estratégia. Porto Alegre:
Bookman, 1998. 404p.
SCHERER, F.; ROSS, D. Industrial market structure and economic performance. Boston: Houghton Mifflin, 1990. 713p.
UNIÃO BRASILEIRA DE VITIVINICULTURA. Dados de produção e comercialização de vinhos e compilação da legislação pertinente.
Disponível em: <www.uvibra.com.br>. Acesso em: 14 mar. 2005. ZYLBERSZTAJN, D. Estruturas de governança e coordenação do
agribusiness: uma aplicação da nova economia das instituições. São Paulo: FEA/USP, 1995. 237p. (Tese - Livre-Docência).
ZYLBERSZTAJN, D.; FARINA, E.M.M.Q. Agry-system management: recent developments and applicability of the concept. In: INTERNATIONAL CONFERENCE ON CHAIN MANAGEMENT IN AGRIBUSINESS AND THE FOOD INDUSTRY, 3., Wageningen, 1998. Proceedings. Wageningen: Wageningen Academic Publishers, 1998. p.679-689.