ISSN 1678-992X
ABSTRACT: The selection of superior Carica papaya (L) genotypes depends on the availability of genetic variability and on the favorable and simultaneous response of the genotypes to those traits of most interest. However, manual phenotyping (MP) demands intensive labor, is time-con-suming and expensive. The aim of the current study is to access the efficiency of image-based phenotyping (IBP) in estimating genetic parameters and in selecting F4 recombinant inbred lines. The genetic parameters and values were estimated in accordance with the REML/BLUB proce-dure and combined selection using the selection index based on standardized genetic values. The majority of traits accessed through IBP showed experimental coefficients of variation similar to those found through MP. Both methodologies showed genetic parameters of similar magni-tude, indicating expressive genetic variability between lines in the traits accessed in this study. The same superior lines were indicated in both methodologies and expressive genetic gains obtained through the lines were selected for all traits. IBP performance was similar to that of MP with respect to the estimates of breeding-relevant traits such as commercial fruits and yield. Thus, IBP showed efficient phenotypic assessment, as well as selective accuracy in accessing genetic variability and genetic gains, when it was compared to MP. Since IBP is far less depen-dent on labor, it is expected to be incorporated into the routine of papaya breeding programs as a way of increasing the number of accessed lines and, consequently, increasing genetic gains. Keywords: Carica papaya, digital phenotyping, genetic gains, genetic parameters
Papaya recombinant inbred lines selection by image-based phenotyping
Diego Fernando Marmolejo Cortes1*, Renato Santa-Catarina1, Alinne Oliveira Nunes Azevedo1, Tathianne Pastana de Sousa Poltronieri1,
Julio Cesar Fiorio Vettorazzi1, Nádia Fernandes Moreira1, Geraldo Antônio Ferreguetti2, Helaine Christine Cancela Ramos1, Alexandre Pio
Viana1, Messias Gonzaga Pereira1
1State University of North Fluminense “Darcy Ribeiro” –
Genetic and Plant Breeding Lab., Av. Alberto Lamego, 2000 – 28013-602 – Campos dos Goytacazes, RJ – Brazil.
2Caliman Agrícola S/A, BR 101, km 111 – Linhares, ES –
Brazil.
*Corresponding author <[email protected]> Edited by: Leonardo Oliveira Medici
Received December 02, 2016 Accepted February 24, 2017
Introduction
Papaya (Carica papaya L.) is one of the most eco-nomically important fruits in the tropical and subtropi-cal regions of the world. In addition, it is widely known for its nutritional benefits and pharmacological properties (Oliveira and Vitória, 2011). However, commercial fields consist of a small number of cultivars and this leads to limited genetic variability (Dias et al., 2011). The develop-ment of cultivars depends on the availability of genetic variability and the simultaneous and favorable response of the genotypes to most traits of agronomic importance. The phenotypic assessment of fruit tree genotypes re-quires intensive labor and is based mainly on traits such as fruit yield and quality. Conventional phenotyping methodologies have low performance; they are laborious, time-consuming, expensive and, most of the time, de-structive (Rahaman et al., 2015). Thus, phenotypic assess-ment affects the selection strategies and it is necessary to the development of methodologies which will efficiently collect, store and analyze data (Merk et al., 2012).
The trait measuring process must be reliable and consistent to allow for assessing phenotypic differences and improving selection. Recently, the introduction of phenotyping methodologies based on digital images has allowed for assessing phenotypic values with high reso-lution, accuracy, and on a large scale (Honsdorf et al., 2014; Parent et al., 2015; Pauli et al., 2016). Accurate phenotypic quantification applied to breeding popula-tions has increased the variance rate in many traits, due to genetic effects, as well as increased genetic gains.
Recently, plant breeders have begun to consider genetic value estimation as a selection criterion (Heffner et al., 2009). High quality genetic assessment procedures rely on the estimation of variance components through the Restricted Maximum Likelihood (REML) method, as well as on the estimation of breeding values through the Best Linear Unbiased Predictor (BLUP) method, which uses mixed modeling to provide more accurate estimates and predictions of genetic parameters and breeding val-ues (Resende et al., 2006). These procedures have been successfully used to select superior papaya genotypes (Oliveira et al., 2012; Pinto et al., 2013; Ramos et al., 2014).
Thus, the aim of the current study was to access the efficiency of the image-based phenotyping method-ology in estimating genetic parameters and selecting F4 recombinant inbred lines.
Materials and Methods
Study location and plant material
The experiment was conducted in Linhares, Espíri-to SanEspíri-to, Brazil (19º06’ and 19º18’ S, 39º45’ and 40º19’ W, altitude 30 m). A completely randomized block design with six replications was applied in this study using 23 F4 recombinant lines and one plant per plot (STP). The lines were derived from the crossing of two parents from the 'Formosa' heterotic group, which were subjected to an advance in generations through self-fertilization. Two assessments were performed 9 and 12 months after the transplanting of seedlings (MAT).
Genetics and Plant Br
eeding
|
Resear
ch Ar
The phenotyping of morpho-agronomic traits using conventional methodology
Manual phenotyping (MP) was used to assess in each plant the following traits: plant height (PH), which was expressed as m and measured with a measuring tape; stem diameter (SD), which was expressed as mm and measured with a digital caliper; number of commer-cial fruits (NCF); number of deformed fruits (NDF); and number of fruitless leaf axils (FLLA). Plant production (PROD) was obtained by multiplying NCF by the mass of commercial fruits. The fruits were weighed using an analytical balance. Only fruits showing a defined shape were taken into consideration in fruit counting; the last fruit assessed was marked to facilitate the counting con-ducted according to the methodology based on digital images.
The phenotyping of morpho-agronomic traits using image-based phenotyping
Image capturing
Image-based phenotyping (IBP) used a semiprofes-sional digital camera to take pictures of each plant in two different positions. The first position was perpen-dicular to the plant (Image A) (Figure 1A), based on the axis of the row; the second position was the opposite side of the same plant used in image A (Image B)
(Fig-ure 1B). The pict(Fig-ures were taken at a distance of 2.5 m from the plant in the row. Image A was used to measure traits such as PH (expressed in m) and SD (expressed in mm). On the other hand, both images (Image A + Im-age B) were used to estimate the NCF, NDF and FLLA. In order to determine how many images can be used in phenotyping the traits NCF, NDF and FLLA, the A and B images were compared to assess the symmetry between the sides photographed. For this, the number of fruits and fruitless leaf axils obtained in each image was multi-plied by two (Image A × 2 and Image B × 2) to estimate the genetic parameters.
Image analysis
The images were analyzed by the public domain ImageJ software program. A ruler was used as a refer-ence measure in each plant photographed in order to calibrate the dimensions of the image through the ‘set scale’ function of the software program. PH and SD traits were measured after calibration using the ‘straight line selection’ tool. The NCF, FLLA and NDF traits were estimated using the plugin Cell Counter. The PROD was estimated using the same mass of fruit considered for quantifying this trait by manual phenotyping.
Statistical analysis
The statistical analysis of the NCF, NDF, FLLA and PROD took the sum of the two assessment periods (nine MAT + twelve MAT) into consideration. On the other hand, the statistical analyses of PH and SD took the mean of the two assessment periods into consideration. NCF, FLLA and PROD data were subjected to x-type transformation and NDF data to x+0 5. -type transfor-mation.
The genetic analysis of the traits, which was conducted using both manual phenotyping and image-based phenotyping methodology, used the mixed model methodology and applied the REML/BLUP procedure. Variance components and the genetic parameters were estimated using the REML method, whereas the genetic values were obtained using the BLUP as shown in the following statistical model
y = Xb + Zg + e (1)
where: y is the data vector; b the vector of replication effects (assumed to be fixed), g the vector of the genetic effects of lines (assumed to be random), and e the vec-tor of errors (random). The capital letters represent the incidence matrices of these effects.
The distribution and structure of means and vari-ances is given by:
y│b,V ~ N (Xb, V)
g│Aσg
2
~ N (0, Aσg
2
)
e│σε2~ N (0, Iσε2)
For the random effects the model is given by:
Cov(g, e’) = 0. The variance structure of the model is given by:
V = ZAσg
2
Z’ + Iσε2, where A is the genetic relationship matrix involving all individuals, in which elements are functions of identity by descent probabilities.
The equations of the mixed models to estimate the fixed effects and to predict the random effects using the Blup procedure, presented by Resende (2002) are given by: ˆ ˆ ’ ’ ’ ’ ’ ’ b a
X X X Z
Z X Z Z A
X y Z y = + − − 1 1 1 λ ,
where: λ1=σˆ2 σˆ2= −1 ˆ2 ˆ2
e g h h , hˆ ˆg ˆg ˆe
2 2 2 2
=σ σ +σ is the individual narrow sense heritability in the block; σˆg2=
the additive genetic variance and σˆe
2
= the residual vari-ance (environmental + non additive).
In order to compare the performance of the two methodologies, the estimates of variances and genetic parameters were obtained as follows:
Phenotypic variance of the mean of lines:
ˆ ˆ ˆ
σpm σg σe b
2 2 2
= + , where b is the number of blocks; the heritability of the mean of the lines: hˆm ˆg ˆpm
2 = σ2 σ2
; the coefficient of genetic variation:
CVg m g =100 2 ˆ ˆ σ ;
the coefficient of experimental variation: CVe m e =100 2 ˆ ˆ σ ;
the relative variation coefficient: CVr CVg CVe
= and
the accuracy of the line selection of: Ac= hm
2 .
The mixed model analysis was performed using the MIXED procedure of the SAS Studio 3.5 statistical software program. The combined selection to identify the superior lines was carried out using the index based on standardized genetic values developed for the selection of papaya lines, according to Silva et al. (2008) and Ramos et al. (2014). The procedures required for the construction of this index were generated using the MIXED procedure program from SAS software. A selection intensity of 35 % was applied to indicate the eight superior lines. In ad-dition, the genetic gains obtained from the selection of superior lines indicated in each methodology were esti-mated using the following estimator
ˆ ˆ ˆ
Gs =
(
ys−µ0)
hm2
(2)
where: Gˆs = genetic gain; ˆys− µ0= differential
selec-tion; hˆm
2= heritability of the mean of the lines.
Results and Discussion
Estimates of variance components and genetic parameters
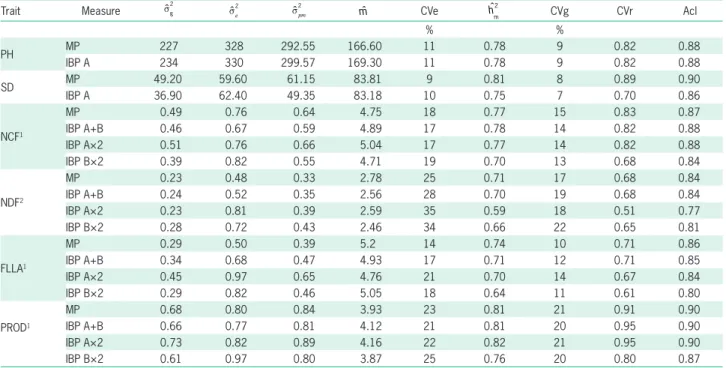
Table 1 shows the results of the estimates of the variance components and genetic parameters of the as-sessed traits. The experimental coefficients of variation (CVe) were estimated for most of the traits using image-based phenotyping (IBP) and presented values similar to those found when MP was used. Thus, the CVe ranged from 10 to 28 % when the IBP methodology was used, whereas the MP methodology yielded coefficients rang-ing from 9 to 25 %. The CVe values estimated for PH and SD were low indicating a high degree of experimen-tal precision. Precision in the phenotypic assessment of the morphological traits of plants using methodologies based on digital images has been reported in several economically important crops such as barley (Chen et al., 2014), Australian cedar (Shimizu et al., 2014) and rice (Sritarapipat et al., 2014). However, the CVe values in the remaining traits were moderate, and the highest value was found for the NDF trait (25 and 28 % esti-mated by MP and IBP, respectively). Moderate and high CVe values in NCF, FLLA, PROD and NDF have been reported in studies that assessed papaya lines in the field (Silva et al., 2008; Ramos et al., 2014). High CVe magni-tude values indicated a low degree of experimental pre-cision and may be associated with the great variation presented by these traits between lines. Another cause that may have contributed to the recording of moderate magnitude values was the drought in the region in the last three years, which has affected plant development, and has led to plant loss and a consequent reduction in the number of experimental units. Studies about the ef-fect of water deficit on papaya plants have indicated re-ductions in stomatal conductance in the soil, leading to a decrease in photosynthesis and, therefore, reductions in both the production and quality of fruit (Campostrini et al., 2010). According to Ferrão et al. (2008), high CVe values may be associated with the long cycle of the crop, with the large size of the experiments, with sampling errors, with different responses of the genotypes to the stress caused by high temperatures and drought, as well as with the different responses of the genotypes to pests, disease, wind and pruning.
performance of the IBP methodology was comparable to that of the MP in terms of accessing genetic variability between lines. The high values of relevant traits such as NCF, PROD and NDF in papaya breeding indicated that it is possible to select highly productive lines, as well as lines showing a small number of deformed fruits.
The relative coefficient of variation (CVr), which refers to the magnitude of the relationship between CVg and CVe, indicates to what extent the existing variation results from genetic causes and it measures the accu-racy of the inferences that could result from phenotypic assessments. Thus, CVr values ranged from 0.68 (NDF) to 0.91 (PROD) when the IBP methodology was applied and from 0.68 (NDF) to 0.95 (PROD), when the MP methodology was used. Values above the unit provide inferences of a high and very high degree of accuracy and precision (Resende and Duarte, 2007). The current study found no magnitude value equal to the unit in the assessed traits. However, traits such as PH, SD, NCF and PROD did show magnitude values close to the unit in both phenotyping methodologies, indicating a favorable condition for the selection of superior lines. As for NDF and FLLA, more accurate methods should be used to select superior lines.
The quality of genotypic assessment should prefer-ably be inferred based on accuracy because this param-eter refers to a correlation between the actual genotypic
Table 1 –Variance components and Genetic parameters estimated for six morpho-agronomic traits in papaya F4 recombinant Lines in Linhares, Espírito Santo, Brazil (2016).
Trait Measure sˆg
2
ˆ se
2
ˆ spm2
ˆ
m CVe hˆ
m
2
CVg CVr Acl
% %
PH MP 227 328 292.55 166.60 11 0.78 9 0.82 0.88
IBP A 234 330 299.57 169.30 11 0.78 9 0.82 0.88
SD MP 49.20 59.60 61.15 83.81 9 0.81 8 0.89 0.90
IBP A 36.90 62.40 49.35 83.18 10 0.75 7 0.70 0.86
NCF1
MP 0.49 0.76 0.64 4.75 18 0.77 15 0.83 0.87
IBP A+B 0.46 0.67 0.59 4.89 17 0.78 14 0.82 0.88
IBP A×2 0.51 0.76 0.66 5.04 17 0.77 14 0.82 0.88
IBP B×2 0.39 0.82 0.55 4.71 19 0.70 13 0.68 0.84
NDF2
MP 0.23 0.48 0.33 2.78 25 0.71 17 0.68 0.84
IBP A+B 0.24 0.52 0.35 2.56 28 0.70 19 0.68 0.84
IBP A×2 0.23 0.81 0.39 2.59 35 0.59 18 0.51 0.77
IBP B×2 0.28 0.72 0.43 2.46 34 0.66 22 0.65 0.81
FLLA1
MP 0.29 0.50 0.39 5.2 14 0.74 10 0.71 0.86
IBP A+B 0.34 0.68 0.47 4.93 17 0.71 12 0.71 0.85
IBP A×2 0.45 0.97 0.65 4.76 21 0.70 14 0.67 0.84
IBP B×2 0.29 0.82 0.46 5.05 18 0.64 11 0.61 0.80
PROD1
MP 0.68 0.80 0.84 3.93 23 0.81 21 0.91 0.90
IBP A+B 0.66 0.77 0.81 4.12 21 0.81 20 0.95 0.90
IBP A×2 0.73 0.82 0.89 4.16 22 0.82 21 0.95 0.90
IBP B×2 0.61 0.97 0.80 3.87 25 0.76 20 0.80 0.87
MP = manual phenotyping; IBP = image-based phenotyping; A+B = trait measured using the image A and Image B. A×2 = trait measured using image A and multiplying by two; B×2 = trait measured using image B and multiplying by two. sgˆ2
= Genetic variance; ˆse2
= residual variance; spmˆ2
= Phenotypic variance of the mean of Lines; ˆ
m= mean; hˆ
m
2
= Heritability of the mean of the Lines; CVe = Coefficient of experimental variation; CVg = coefficient of genetic variation; CVr = relative variation coefficient (CVg/CVe) and accuracy of the selection of Lines (Acl). PH = Plant height expressed in m; SD = Stem diameter expressed in mm; NCF = Number of commercial fruits; NDF = Number of deformed fruits; FLLA = Fruitless leaf axils; PROD = Plant production expressed in kg.1 and 2 indicatedata transformed using the
expression x and x+ 0.5, respectively.
value of lines and that predicted for the information ob-tained by field experiment. In the current study, the two phenotyping methodologies showed a similar degree of accuracy in most assessed traits, with values ranging from 0.84 to 0.90, which are considered high in mag-nitude value showing that IBP allows for obtaining reli-able inferences of genotypic means.
With respect to the heritability of the mean of the lines (hˆm
2), IBP allowed for estimating magnitude values
These traits have great economic importance among those assessed in the current study. Genetic variability may be due to the inbreeding nature of the lines herein assessed, which resulted from the advance of three gen-erations through self-fertilization (F4). Consequently, the increased genetic variance between lines made them more genetically distant from each other. According to Hallauer et al. (2010), the expected variance between F4 lines is equivalent to: σGF4 σA σD
2 3 2/ 2 3 16/ 2
= + , where:
σA
2 : is the additive genetic variance and σ
D
2 : the
domi-nance genetic variance.
Thus, most of this variance results from the addi-tive variance component, which indicates that heritabil-ity is mainly additive, which increases the chances of obtaining greater gains in the selection of such lines.
The estimates of variance and genetic parameters for traits NCF, NDF, FLLA and PROD using an image and multiplying by two (Image A × 2, Image B × 2) are shown in Table 1. Thus, the CVe magnitude values esti-mated in Image A × 2 ranged from 17 % (NCF) to 35 % (NDF), whereas those estimated in Image B × 2 from 19 % (NCF) to 34 % (NDF). The CVg obtained through Image A × 2 showed magnitude values ranging from 14 % (FLLA) to 21 % (PROD), whereas that obtained in Image B × 2 showed magnitude values ranging from 11 % (FLLA) to 22 % (NDF). The CVr obtained in Im-age A × 2 showed magnitude values ranging from 0.51 (NDF) to 0.95 (PROD), whereas that obtained in Image B × 2 showed magnitude values ranging from 0.61 (FLLA) to 0.80 (PROD). The accuracy obtained by Image A × 2 ranged from 0.77 (NDF) to 0.90 (PROD), whereas that ob-tained by image B × 2 from 0.81 (NDF) to 0.87 (PROD).
The hˆm
2 obtained in Image A × 2 ranged from 0.59
(NDF) to 0.82 (PROD), whereas that obtained in Image B × 2 ranged from 0.64 (FLLA) to 0.76 (PROD). Thus, the analysis of the parameter estimate values using one of the photographed sides allowed for seeing that the photographed sides of these lines were not symmetri-cal; therefore, it was necessary to use the two images to assess count-dependent traits. The asymmetry observed herein may be associated with the genetic nature of the lines, which were the third generation obtained through self-fertilization. It can be implied that there is still ge-netic variability within lines, although this variation was not taken into consideration given the STP experimental conditions. Another possible cause may lie in the varia-tion in the arrangement or inservaria-tion of fruits and fruit-less leaf axils within a single plant. Such variation would lead to differences between the photographed sides, i.e., one side would show the largest number of fruits, thus leading to inconsistent results. This variation may also be due to the drought in the region, which results in the previously mentioned implications. Thus, based on the results found herein, both the analysis of the selec-tion index and the estimaselec-tion of genetic gains were con-ducted by taking the sum of the two images (Image A + Image B) into consideration in order to compare the phenotyping methodologies.
Combined selection and estimation of genetic gains
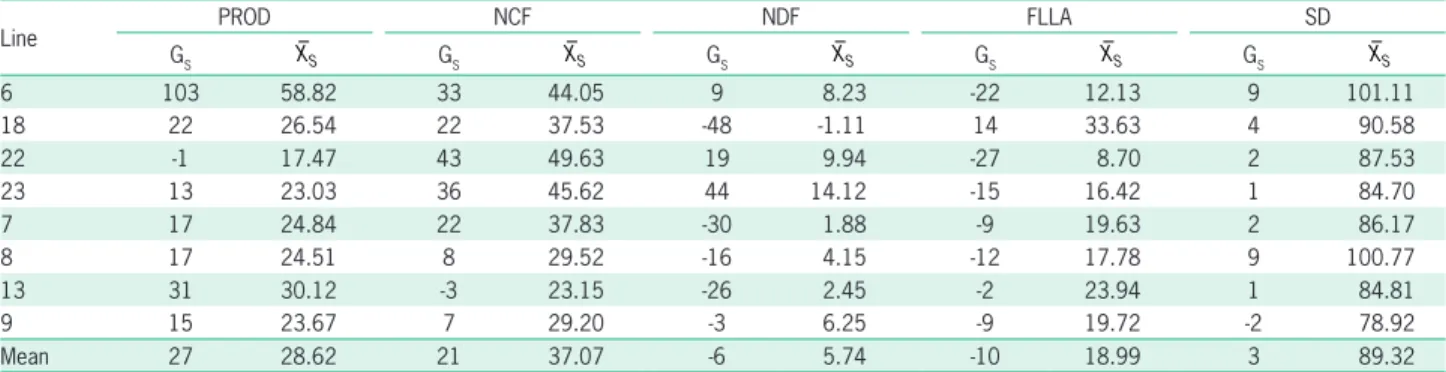
Overall, the selection index used to make the com-bined selection has consistently ranked the lines based on all the assessed traits. The same superior lines were selected by the two phenotyping methodologies (Tables 2 and 3). In addition, the index also showed good consis-tency in the selection of lines based on PROD and NCF, which were considered the most economically impor-tant traits. Based on this index eight superior lines were selected. By taking into consideration the mean of the selected lines, the genetic gains in all the traits ranged from 29 % (PROD) to -8 % (FFLA) when the MP meth-odology was used and from 27 % (PROD) to -10 (FLLA) when the IBP methodology was applied. Both method-ologies were consistent in the gain estimate of each trait. The highest mean gain was obtained in PROD, whereas the lowest one was in SD. It is worth emphasizing that these gains were positive for traits such as PROD, NCF and SD, and that they were negative in traits such as NDF and FLLA, since the goal was to reduce the NDF and FLLA means.
IBP methodology has led to genetic gains greater than those of the MP methodology in FLLA and SD, as well as to similar genetic gains in NCF. However, MP methodology has led to the greatest genetic gains in PROD and NDF. The eight lines selected through MP methodology showed gains ranging from -2 % to 100 % for PROD, from 0 % to 42 % for NCF, from -42 % to 36 % for NDF, from -21 % to 14 % for FLLA, and from -1 % to 13 % for SD (Table 2). On the other hand, the gains resulting from the application of the IBP method-ology ranged from -1 % to 103 % in PROD, from -3 % to 43 % for NCF, from -48 % to 44 %for NDF, from -27 to 14 % for FLLA, and from -2 % to 9 % for SD (Table 3). The negative sign of the PROD trait was obtained through the selection of line 22 by the two methodolo-gies and it can be explained by the fruit mass, since this trait is the product of the multiplication of the number of commercial fruits by the mean mass of fruits. Line 22 has presented fruits with mean mass 470 g, and it was the least selected line. However, this line showed signifi-cant and positive gains in NCF, which justified its selec-tion. The opposite happened to line 13, which presented a mean mass of 890 g, and it was one of the lines that was selected the most. The positive sign of the NDF trait was found in certain selected lines due to the fact that a number of productive plants also produced deformed fruits which has increased the mean of this trait.
fruits may minimize their visible area and hinder their recognition in the image. Errors resulting from the oc-clusion of fruits have been addressed in studies that esti-mate the number of fruits using methodologies based on digital images (Payne et al., 2013; Roscher et al., 2014). In addition, errors in the recognition of deformed fruits may result from the difficulty of identifying the part of the fruit exhibiting the anomaly. For example, carpelloid fruits may be mistaken for commercial fruits. The iden-tification of pentandric fruits is easier because of the characteristic shape of these fruits. However, a trained and experienced evaluator may identify most of the de-formed fruits in the image and help reduce the meth-odology error. On the other hand, the manual counting of papaya fruits demands intensive labor. The evalua-tor must go around each plant or, in many cases, use a ladder in order to perform the counting. Thus, manual assessment - mainly in productive plants or in experi-ments comprising large numbers of treatexperi-ments - is labo-rious and induces the appraiser to make counting errors, since it is tiring and difficult to accomplish. Thus, these
Table 2 – Genetic gains (Gain) and new predicted averages in five traits crucial to papaya breeding for the lines selected by index using manual phenotyping considering the sum of the two evaluation seasons (9 and 12 months after the transplanting) in Linhares, Espírito Santo, Brazil (2016).
Line PROD NCF NDF FLLA SD
GS XS GS XS GS XS GS XS GS XS
6 100 54.48 30 40.37 18 11.39 -18 16.34 13 107.41
23 19 24.02 42 46.56 36 14.74 -4 25.45 0 83.23
22 -2 16.02 39 45.27 15 10.81 -21 13.93 0 83.93
7 15 22.65 23 36.51 -24 3.27 -14 18.57 1 84.87
18 18 23.81 17 33.18 -42 -0.12 14 37.31 4 90.76
9 23 25.53 14 31.17 5 8.91 -11 20.62 -1 81.82
8 17 23.35 6 26.97 -23 3.57 -18 16.19 8 98.86
13 37 30.96 0 23.81 -19 4.25 3 30.11 0 82.93
Mean 29 27.6 21 35.48 -4 7.1 -8 22.32 3 89.23
Gs = Genetic gain in percentage; XS = new average of the selected lines; SD = Stem diameter expressed in mm; NCF = Number of commercial fruits; NDF = Number
of deformed fruits; FLLA = Fruitless leaf axils; PROD = Plant production expressed in kg.
Table 3 – Genetic gains and new predicted averages in five traits crucial to papaya breeding for the lines selected by index using image-based phenotyping considering the sum of the two evaluation seasons (9 and 12 months after the transplanting) in Linhares, Espírito Santo, Brazil (2016).
Line PROD NCF NDF FLLA SD
GS XS GS XS GS XS GS XS GS XS
6 103 58.82 33 44.05 9 8.23 -22 12.13 9 101.11
18 22 26.54 22 37.53 -48 -1.11 14 33.63 4 90.58
22 -1 17.47 43 49.63 19 9.94 -27 8.70 2 87.53
23 13 23.03 36 45.62 44 14.12 -15 16.42 1 84.70
7 17 24.84 22 37.83 -30 1.88 -9 19.63 2 86.17
8 17 24.51 8 29.52 -16 4.15 -12 17.78 9 100.77
13 31 30.12 -3 23.15 -26 2.45 -2 23.94 1 84.81
9 15 23.67 7 29.20 -3 6.25 -9 19.72 -2 78.92
Mean 27 28.62 21 37.07 -6 5.74 -10 18.99 3 89.32
Gs = Genetic gain in percentage; XS = new average of the selected lines; SD = Stem diameter expressed in mm; NCF = Number of commercial fruits; NDF = Number
of deformed fruits; FLLA = Fruitless leaf axils; PROD = Plant production expressed in kg.
peculiarities associated with each methodology, as well as the experimental conditions and genetic structure of the lines, are able to explain the small differences be-tween means and magnitude of heritability coefficients and the consequent genetic gain estimates obtained by each methodology.
genera-tions and selection cycles. It is worth emphasizing that this selection should be done between lines due to the genetic variance evolution of generations derived from self-fertilization. In addition, it is worth pinpointing that the genetic parameter estimates, as well as the efficiency index in the selection of superior lines, are both inherent to F4 lines and to the experimental conditions set in the current study.
IBP is an efficient phenotypic analysis instru-ment as regards selective precision and accuracy in the capturing of genetic variability and the gains obtained from the selection of superior lines, when compared to MP methodology. Furthermore, IBP methodology can be easily adopted, since the images are captured using an inexpensive, easily handled and transported conven-tional camera. In addition, the images can be stored in a computer for later analysis. It reduces both the labor and time spent on field measurements, and thus im-proves phenotypic assessment. As was evidenced in the present study, the two appraisers used 100 s, on aver-age, to estimate traits in the MP methodology, whereas the same appraisers used 16 s to take two pictures per plant and 30 s to analyze the images. In addition, IBP methodology has the advantage that the time used to capture the images does not depend on the number of fruits or on the plant height; thus, it is faster than the MP methodology because the latter takes longer to be applied to productive and/or tall plants and is, therefore, more laborious. Thus, IBP methodology is expected to expand the size of the experiments, to make fast and accurate phenotypic assessments, as well as to help in-crease both the selection differential and the heritability coefficient, and, hence, lead to direct effects on genetic gains. It is also expected to be used at different stages of papaya breeding programs such as the germplasm as-sessment, the development of inbred lines, the assess-ment of yield competition trials, genome-wide selection studies (GWS), genome-wide association studies (GWAS) and marker-assisted selection (MAS).
Acknowledgements
The authors would like to thank the Caliman Agrícola S/A company, for financing the experiment; as well as the Coordination for the Improvement of Higher Level Personnel (CAPES); the Brazilian Nation-al Council for Scientific and TechnologicNation-al Develop-ment (CNPq); the Rio de Janeiro Research Foundation (FAPERJ) and the State University of North Fluminense “Darcy Ribeiro” (UENF) for granting scholarships to the students.
References
Campostrini, E.; Glenn, D.M.; Yamanishi, O.K. 2010. Papaya: environment and crop physiology. p. 287-308. In: Matta, F., ed. Ecophysiology of tropical tree crops. Nova Science, New York, NY, USA.
Chen, D.; Neumann, K.S.; Friedel, S.B.; Kilian, M.; Altmann, T.; Klukas, C. 2014. Dissecting the phenotypic components of crop plant growth and drought responses based on hi-throughput image analysis. The Plant Cell 26: 4636-4655.
Dias, N.L.P.; Oliveira, E.J.; Dantas, J.L.L. 2011. Evaluation of papaya genotypes using agronomic descriptors and estimation of genetic parameters. Pesquisa Agropecuária Brasileira 46: 1471-1479 (in Portuguese, with abstract in English).
Ferrão, R.G.; Cruz, C.D.; Ferreira, A.; Cecon, P.R.; Ferrão, M.A.G.; Fonseca, A.F.A.; Carneiro, P.C.S.; Silva, M.F. 2008. Genetic parameters in Conilon coffee. Pesquisa Agropecuária Brasileira 43: 61-69 (in Portuguese, with abstract in English). Hallauer, A.R.; Carena, M.J.; Filho, J.B.M. 2010. Means and
variances. p. 33-68. In: Hallauer, A.R.; Carena, M.J.; Filho, J.B.M., eds. Quantitative genetics in maize breeding. Springer, New York, NY, USA.
Heffner, E.L.; Sorrells, M.E.; Jannink, J. 2009. Genomic selection for crop improvement. Crop Science 49: 1-12.
Honsdorf, N.; Timothy, J.M.; Berger, B.; Tester, M.; Pillen, K. 2014. High-throughput phenotyping to detect drought tolerance QTL in wild Barley introgression lines. Plos One 9: e97047. Merk, H.L.; Yarnes, S.C.; Van Deynze, A.; Tong, N.; Menda, N.
2012. Trait diversity and potential for selection indices based on variation among regionally adapted processing tomato germplasm. Journal of the American Society for Horticultural Science 137: 427-437.
Oliveira, E.J.; Filho, G.A.F.; Freitas, J.P.X.; Dantas, J.L.L.; Resende,
M.D.V. 2012. Plant selection in F2 segregating populations of
papaya from commercial hybrids. Crop Breeding and Applied Biotechnology 12: 191-198.
Oliveira, J.G.; Vitória, A.P. 2011. Papaya nutritional and pharmacological characterization, and quality loss due to physiological disorders: an overview. Food Research 4: 1306-1313.
Parent, B.; Shahinnia, F.; Maphosa, L.; Berger, B.; Rabie, H.; Ken, H.; Kovalchuk, A.; Langridge, P.; Fleury, D. 2015. Combining field performance with controlled environment plant imaging to identify the genetic control of growth and transpiration underlying yield response to water-deficit stress in wheat. Journal of Experimental Botany 66: 5481-5492.
Pauli, D.; Sanchez-Andrade, P.; Carmo-Silva, E.; Gazave, E.; French, A.N.; Heun, J.; Hunsaker, D.J.; Lipka, A.E.; Setter, T.L.; Strand, R.J.; Thorp, K.R.; Wang, S.; White, J.W.; Gore, M.A. 2016. Field-based high-throughput plant phenotyping reveals the temporal patterns of Quantitative Trait Loci associated with stress-responsive traits in cotton. G3: 865-879.
Payne, A.B.; Walsh, K.B.; Subedi, P.P.; Darvis, P.P. 2013. Estimation of mango crop yield using image analysis: segmentation method. Computers and Electronics in Agriculture 91: 57-64. Pinto, F.D.O.; Luz, L.N.; Pereira, M.G.; Cardoso, D.L.; Ramos,
H.C.C. 2013. Mixed model for combining selection in segregate progeny of papaya. Revista Brasileira de Ciências Agrárias 8: 211-217 (in Portuguese, with abstract in English).
Ramos, H.C.C.; Pereira, M.G.; Viana, A.P; Luz, L.N.; Cardoso, D.L.; Ferreguetti, G.A. 2014. Combined selection in backcross
population of papaya (Carica papaya L.) by the mixed model
methodology. American Journal of Plant Sciences: 2973-2983. Resende, M.D.V. 2002. Biometric and statistical genetics in
breeding perennials = Genética biométrica e estatística no melhoramento de plantas perenes. Embrapa Florestas, Colombo, PR, Brazil (in Portuguese).
Resende, M.D.V.; Thompson, R.; Welham, S.J. 2006. Multivariate spatial statistical analysis of longitudinal data in perennial crops. Revista de Matemática e Estatística 24: 147-169. Resende, M.D.V.; Duarte, J.B. 2007. Precision and quality control
in variety trials. Pesquisa Agropecuária Tropical 37: 182-194 (in Portuguese, with abstract in English).
Roscher, R.; Herzog, K.; Kunkel, A.; Kicherer, A.; Töpfer, R.; Förstner, W. 2014. Automated image analysis framework for high-throughput determination of grapevine berry sizes using conditional random fields. Computers and Electronics in Agriculture 100: 148-158.
Shimizu, A.; Yamada, S.; Arita, Y. 2014. Diameter measurements of the upper parts of trees using an ultra-telephoto digital photography system. Open Journal of Forestry 4: 316-326. Silva, F.F.; Pereira, M.G.; Ramos, H.C.C.; Damasceno Júnior,
P.C.; Pereira, T.N.S.; Gabriel, A.P.C.; Viana, A.P.; Ferreguetti, G.A. 2008. Selection and estimation of the genetic gain in
segregating generations of papaya (Carica papaya L). Crop
Breeding and Applied Biotechnology 8: 1-8.