Simultaneous selection for yield, stability,
and adaptability of carioca and black beans
Paulo Ricardo dos Santos(1), Kleyton Danilo da Silva Costa(2), Maxwel Rodrigues Nascimento(1), Thalyson Vasconcelos Lima(3), Yure Pequeno de Souza(1), Antonio Félix da Costa(4) and José Wilson da Silva(3)
(1)Universidade Estadual do Norte Fluminense Darcy Ribeiro, Centro de Ciências e Tecnologias Agropecuárias, Avenida Alberto Lamego, no 2.000, Parque Califórnia, CEP 28013-602 Campos dos Goytacazes, RJ, Brazil. E-mail: [email protected], [email protected], [email protected] (2) Instituto Federal de Educação, Ciência e Tecnologia de Alagoas, Avenida Sergipe, s/no, Xingó, CEP 57460-000 Piranhas, AL, Brazil. E-mail: [email protected] (3) Universidade Federal Rural de Pernambuco, Departamento de Agronomia, Rua Dom Manoel de Medeiros, s/no, Dois Irmãos, CEP 52171-900 Recife, PE, Brazil. E-mail: [email protected], [email protected] (4)Instituto Agronômico de Pernambuco, Avenida General San Martin, no 1.371, Bongi, CEP 50761-000 Recife, PE, Brazil. E-mail: [email protected]
Abstract – The objective of this work was to determine the efficiency of a simultaneous selection for yield, stability, and adaptability of bean genotypes of the carioca and black groups. In the 2016 harvest, two experiments were carried out in the state of Pernambuco, Brazil: one for the carioca group, with 20 genotypes, in the municipalities of Caruaru, Arcoverde, and Belém de São Francisco; and the other for the black group, with 12 genotypes, in the municipalities of Caruaru and Arcoverde. The parameters were estimated by mixed models, and selection was performed by the harmonic mean of the relative performance of genetic values, using three strategies: selection based on the predicted genetic value, without interaction; selection based on the predicted genetic value, considering each location; and simultaneous selection for grain yield, stability, and adaptability. The environments affected the phenotypic expression of the carioca bean genotypes, indicating specific adaptation. The average heritability for grain yield showed high values for black bean genotypes, which is a favorable condition for selection, and low values for carioca bean genotypes. The black bean genotypes CNFP 15684, 'BRS Esteio', CNFP 15678, CNFP 15697, CNFP 15695, and 'IPR Uirapuru' show the best performances in the studied environments, simultaneously considering grain yield, adaptability, and stability.
Index terms: Phaseolus vulgaris, genotype x environment interaction, heritability, mixed models, REML/
Blup.
Seleção simultânea de feijões de tipo carioca e preto quanto
à produtividade, estabilidade e adaptabilidade
Resumo – O objetivo deste trabalho foi determinar a eficiência da seleção simultânea quanto à produtividade, à estabilidade e à adaptabilidade, em genótipos de feijão dos grupos carioca e preto. Na safra 2016, dois experimentos foram realizados no Estado de Pernambuco: um do grupo carioca, com 20 genótipos, em Caruaru, Arcoverde e Belém de São Francisco; e outro do grupo preto, com 12 genótipos, em Caruaru e Arcoverde. Os parâmetros foram estimados por modelos mistos, e a seleção foi realizada pelo método da média harmônica do desempenho relativo dos valores genéticos, tendo-se adotado três estratégias: seleção com base no valor genético predito, sem interação; seleção com base no valor genético predito, tendo-se considerado cada local; e seleção simultânea quanto à produtividade, à estabilidade e à adaptabilidade de grãos. Os ambientes influenciaram a expressão fenotípica dos genótipos de feijão carioca, o que indica adaptação específica. A herdabilidade média quanto à produtividade de grãos apresentou valores de elevada magnitude para os genótipos de feijão preto, o que é condição favorável à seleção, e valores baixos para os de feijão carioca. Os genótipos de feijão preto CNFP 15684, 'BRS Esteio', CNFP 15678, CNFP 15697, CNFP 15695 e 'IPR Uirapuru' apresentam os melhores desempenhos nos ambientes testados, ao se considerarem simultaneamente o rendimento de produtividade de grãos, a adaptabilidade e a estabilidade.
Termos para indexação: Phaseolusvulgaris, interação genótipo x ambiente, herdabilidade, modelos mistos
Introduction
Common bean (Phaseolus vulgaris L.), from both
carioca and black commercial groups, is a crop of
great economic relevance in Brazil. The country is the
world’s largest consumer and third largest producer of
beans (Silva & Wander, 2013; FAO, 2016).
As to consumption, bean is a highly nutritious crop and an important source of proteins, carbohydrates, vitamins, minerals, and fibers (Silva et al., 2013a).
Carioca bean accounts for 85% of the Brazilian consumption, and black bean, for 11%. The largest
producers in Brazil are the states of Bahia, Paraná, Ceará, Minas Gerais, and Piauí (Acompanhamento..., 2018).
Despite the relevance and tradition of this crop in
Brazil, the production is still insufficient to supply
the domestic market. This leads to imports from
Argentina, Chile, and the United States (Nascimento et al., 2011). Therefore, breeding programs have an
outstanding role in the development of new cultivars aiming to reduce imports.
According to Barros et al. (2013), many biotic and
abiotic problems affect bean cultivation and should be the target of breeding programs. After development, the advanced lineages for grain production should be
tested in the field, in different years and environments (Torres et al., 2015). An ideal common bean genotype should associate high yield, adaptability, and stability, and show desirable agronomic traits
such as plant architecture, resistance to disease, and
high-grain quality. However, studies on the selection gain are hampered by the effect of environment on tested lineages because of genotype x environment
interaction. This effect on the recommendation of cultivars hinders the work of breeders, who need
different criteria for the selection of superior genotypes by using alternative methods to identify those with genetic superiority (Barili et al., 2015; Torres et al., 2015; Carvalho et al., 2016).
In the occurrence of genotype x environment interaction, the study on adaptability and stability provides subsidies for selection, since adaptability is related to the genotype ability to make advantageous use of environmental changes. Stability, in turn, represents the predictability of the genotypes for environmental variations (Rosado et al., 2012). Therefore, the selected lineages should present high-grain yield, adaptability, and genotypic stability.
Some methods for the study on these variables take into account the production only (Silva et al., 2013b).
The harmonic mean of the relative performance of the
genetic values (MHPRVG) is a method proposed by Resende (2002), based on the analysis of the genetic
values through mixed models. It allows of the selection
of genotypes, simultaneously considering their yield, stability, and adaptability.
The univariate mixed model for the genotype x environment interaction considers genotypic effects to be random. Therefore, it provides genotypic stability and adaptability calculations which allows of the analysis of imbalanced data and nonorthogonal designs with the heterogeneity of variances. The
model also allows to consider correlated errors within
locations, as well as stability and adaptability in the
selection of individuals within progenies, and provides
genetic values with discounted instability; besides, it can be applied to any number of environments. It also
generates results in the unit itself, or in the scale of
the evaluated trait, which can be interpreted directly as genetic values, which is not allowed by other methods. Moreover, this model also allows of additional inferences, such as: the selection of specific genotypes for each location; selection of stable genotypes in different locations; selection of genotypes (with high adaptability) which are responsive to the improvement
of the environment; and the simultaneous selection
for yield, stability, and adaptability (Gonçalves et al., 2014).
The objective of this work was to determine the
efficiency of a simultaneous selection for yield, stability, and adaptability, in genotypes of the carioca
and black bean groups.
Materials and Methods
The experiments were carried out in 2016, at the experimental stations of Instituto Agronômico
de Pernambuco (IPA), in three municipalities of
Pernambuco state: Caruaru, Arcoverde, and Belém
de São Francisco. Caruaru shows a wavy topography,
24°C annual mean temperature, 551 mm rainfall
Regolítico eutrófico (eutrophic Entisol) (Santos et al., 2013). Belém de São Francisco shows a flat topography,
28.5°C annual mean temperature, 409 mm rainfall
index, and soil classified as Luvissolo Crômico Carbonático (Luvisol) (Santos et al., 2013).
In the 2016 crop season, 32 genotypes of common bean were evaluated (Table 1), out of which twenty were of the carioca group (cultivated in the
municipalities of Caruaru, Arcoverde, and Belém de
São Francisco), and 12 genotypes of the black group (cultivated in Caruaru and Arcoverde), which totaled five environments. The experiments were arranged
in a randomized block design, with three replicates,
and 252 experimental plots. Each experimental
unit consisted of four lines of 4 m long, at 50x20 cm spacing, with a population of 100,000 plants per hectare. Data collection was performed in the two central rows, while the border lines were neglected. Before the implementation of the experiments, the soil that received the sowing fertilization (200 kg ha-1 chemical fertilizer N-P2O5-K2O 04-20-20), according to Cavalcanti (2008), was analyzed. Soil preparation was carried out in a conventional way, with plowing
and two light harrowings.
Manual weeding was used for weed control. The methamidophos insecticide was applied weekly, at 0.5
L ha-1, for the control of thrips and whiteflies, from day 7 to day 50 after the emergence of plants, using a manual costal spray (Boiça Júnior et al., 2000). When necessary, additional irrigation was performed by a conventional sprinkler system.
During the harvest period, on the R9 phase (Silva et al., 2013a) carried out 90 days after planting, grain yield was determined in all experiments. These data
were used to estimate the genetic parameters, using the restriction maximum likelihood procedure and the best
linear unbiased prediction (REML/Blup), considering the following statistical model: y = Xr + Zg + Wi + e, in which: y refers to a data fixed-effect vector (block averages between locations); r refers to the vector of the effects of the local-replicate combinations
added to the general mean of fixed effects; g refers
to genotypic effects of genotypes (random); i refers to effects of the genotype x environment interaction (random), and of errors (e), or wastes (random); and X, Z, and W refer to the incidence matrices for r, g, and i, respectively. The equations that make the mixed
model equivalent to the prediction of r, g, and i, are:
′ ′ ′ ′ ′ ′ ′
X X X Z X W
Z X Z Z+ Z W
W'X W Z W'W+
= g i 1 2 λ λ r = X'y Z'y W'y , where λ λ 1 g 2 i 2 g 2 2 g 2 i 2 i 2
=1 - h - h
h and =
1 - h - h
h ,
in which: h2g is the individual broad-sense heritability at
block level; and h2i are the coefficients of determination of the effects of the genotype x environment interaction.
The univariate mixed model was used to evaluate the
interaction between genotypes (G) and environments (E) (Resende, 2002). This model is composed of main effects (G) and the GxE interaction by means of G + GE, to obtain the multivariate Blup. The Blup of the GxE effects was used to eliminate the “noises” of the genotype x environwment interaction.
The MHPRVG method was used for genetic evaluation by the highest values of the harmonic mean of the genotypic values (Resende, 2002)
MHPRVG = 1
Vgij n j i n =
∑
,in which: n is the number of locations where the
genotype i was evaluated; and Vgij is the genotypic
Table 1. Common bean (Phaseolus vulgaris) genotypes
from the studied carioca and black groups and their origins.
Carioca bean Origin Black bean Origin
CNFC15820 Embrapa CNFP15681 Embrapa CNFC16876 Embrapa IPR Uirapuru Iapar
CNFC16709 Embrapa CNFP15678 Embrapa CNFC15743 Embrapa CNFP15670 Embrapa CNFC15713 Embrapa CNFP15676 Embrapa CNFC15853 Embrapa CNFP15684 Embrapa CNFC15801 Embrapa IPR Tuiuiú Iapar
CNFC16902 Embrapa CNFP15695 Embrapa CNFC15826 Embrapa CNFP15676 Embrapa CNFC15854 Embrapa CNFP15697 Embrapa CNFC15859 Embrapa BRS Esteio Embrapa IPR BEM-TE-VI Iapar BRS FP 403 Embrapa
BRS FC402 Embrapa -
-CNFC15839 Embrapa -
-CNFC15805 Embrapa -
-BRS Estilo Embrapa -
-BRS Pérola Embrapa -
-CNFC15860 Embrapa -
-value of the genotype i in the location j, expressed as
the ratio of the mean of this location.
The genotypes with the best performance were assessed in three different ways for the MHPRVG
method: selection based on the predicted genetic value,
by means of the mean behavior in all locations, in the
situation, without interaction; selection based on the predicted genetic value, considering the behavior of
the genotypes in each location, in the situation with the
effect of the mean interaction; and the simultaneous
selection for yield, stability (MHVG) and adaptability (PRVG).
The model 54 of the Selegen computer system (Resende, 2016) was used to evaluate lineages and
cultivars, in a randomized complete block design, in several locations, and one observation per plot. A joint
analysis was conducted for each common bean group in the 2016 crop season, using the MHPRVG method.
Results and Discussion
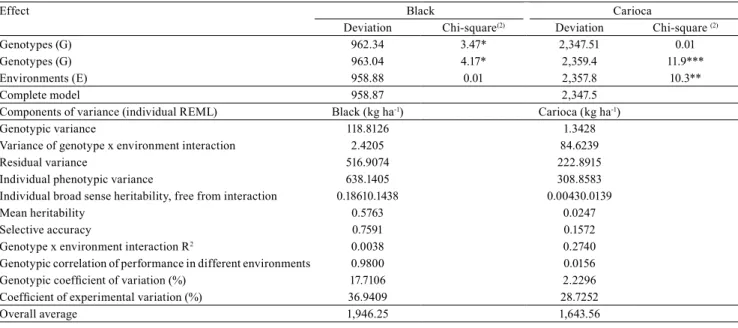
The genotypes and the genotype x environment interaction for the black bean group were significant by the chi-squared test, at 10 and 5% probability, respectively (Table 2). However, no significant
difference was observed for the environments
(p≥0.05). There was no significant difference for the genotypes of the carioca bean group, but there was a difference for genotype x environment interaction and environments which were significant at 1 and 5% probability, respectively (Table 2). These results indicate that the genotypes of the black bean group differed genetically for grain yield potential, and that they showed a different response to the environments where they were assessed. The genotypes of the carioca bean group did not differ genetically for grain yield
potential, but showed a different response in the three environments assessed. Therefore, for the two groups
of genotypes, it would be necessary to evidence the genotype x environment interaction. This could be performed through the analyses of adaptability and stability, considering that edaphoclimatic factors have the greatest effect on the adaptability and stability of the genotypes (Torres et al., 2015).
The coefficient of variation of the experiment was
36.94% for the experiments with the black group, and
28.72% for those with the carioca group (Table 2). These values were considered high. However, these results were expected, since they were related to grain yield, a trait significantly affected by the edaphoclimatic
Table 2. Estimates of the genetic parameters (individual REML) for grain yield in common bean (Phaseolus vulgaris)
genotypes of the carioca (20) and black (12) groups, assessed 90 days after emergence, in the municipalities of Caruaru, Arcoverde, and Belém do Francisco, in the state of Pernambuco, Brazil, in the 2016 crop season.
Effect Black Carioca
Deviation Chi-square(2) Deviation Chi-square (2)
Genotypes (G) 962.34 3.47* 2,347.51 0.01
Genotypes (G) 963.04 4.17* 2,359.4 11.9***
Environments (E) 958.88 0.01 2,357.8 10.3**
Complete model 958.87 2,347.5
Components of variance (individual REML) Black (kg ha-1) Carioca (kg ha-1)
Genotypic variance 118.8126 1.3428
Variance of genotype x environment interaction 2.4205 84.6239
Residual variance 516.9074 222.8915
Individual phenotypic variance 638.1405 308.8583
Individual broad sense heritability, free from interaction 0.18610.1438 0.00430.0139
Mean heritability 0.5763 0.0247
Selective accuracy 0.7591 0.1572
Genotype x environment interaction R2 0.0038 0.2740
Genotypic correlation of performance in different environments 0.9800 0.0156
Genotypic coefficient of variation (%) 17.7106 2.2296
Coefficient of experimental variation (%) 36.9409 28.7252
Overall average 1,946.25 1,643.56
characteristics of each environment (Silva et al., 2013b;
Barili et al., 2015).
The values obtained for the genetic variation
coefficient ranged from 2.22, for the genotypes of
the carioca group, to 17.71, for the black group, which indicates that the low and median fractions of the
genetic variances, respectively, were extracted from the total phenotypic variation (Table 2). The genetic variation coefficient quantifies the magnitude of the
genetic variation available for selection. Therefore,
high values are desirable, and they were observed only for the trials with genotypes from the black group (Rosado et al., 2012).
The joint evaluation of the coefficients of genetic and experimental variation is reflected in the statistics of the selective accuracy (Resende & Duarte, 2007). The genotypes of the black group obtained 75.91% accuracy, which shows a good experimental quality and, consequently, efficiency in the selection of superior genotypes for yield, as high accuracy indicates
an optimal relation between the predicted and real
values (Maia et al., 2009; Torres et al., 2015). However, the genotypes of the carioca comercial type showed 15.72% accuracy, which is considered very low and
indicates a low correspondence between the observed
phenotypic values and the predicted genotypic ones. Consequently, there is a low-selective efficiency of agronomically superior genotypes of this group.
The heritability of the average of the genotypes is
estimated when averages of the blocks are used as the
evaluation and selection criterion (Resende, 2002). The obtained values – 0.5763 and 0.0247 (Table 2) – show that the selection of the elite genotypes, based on the predicted genotypic values, is feasible for those agronomically superior of the black group. It is also
feasible for those of the carioca group, although it is
very expensive (Silva et al., 2013b). The individual broad sense heritability, free from interaction,
considers the total genetic dispersion and allows to
explore all genetic variance among the genotypes (Torres et al., 2015). For the genotypes of the black group, the variance of the genotypic effects showed a magnitude extremely superior to the variance of the effects of the genotype x environment interaction, and accounts for 18.61% of the total phenotypic variability, which is represented by the heritability of individual plots (0.1861). Similar results were observed by Torres et al. (2015), when estimating genetic parameters in
cowpea bean genotypes using REML/Blup. However, for the genotypes of the carioca group, the variance of the genotypic effects showed lower results than the variance of the effects of the genotype x environment interaction (Table 2), and accounts for only 0.44% of the total phenotypic variability, represented by the heritability of the individual plots. The results show
different possibilities of response from the commercial
carioca bean genotypes to the different environments, in the selection for high-grain yield.
As a result of the greater or lower adaptability and genetic stability of the genotypes, the variance of the genotype x environment interaction may inflate the phenotypic expression of a trait, since this estimate quantifies the total variation fraction caused by the interaction (Bastos et al., 2007).
Low-magnitude estimates of the genotype x environment interaction variance (2.4205) were obtained for the genotypes of the black group, which
shows that the interaction had little effect on their
phenotypic value (Table 2). At this scenario, genotypes with higher yields in an environment tend to keep
similar performances in different environments, since
they respond favorably to the environmental effects. They also show considerable predictability when
subjected to environmental variations. The estimates of
the genotype x environment interaction were low, with only 0.37% of the total phenotypic variability. This favored the high range of the genotypic correlation for the performance in several environments (0.98). Torres et al. (2015) obtained lower values of the correlation for genotypic performance in several environments, while evaluating the genotype x environment interaction in semi-prostrate cowpea bean genotypes, using mixed
models.
A high estimate was obtained for the variance of the
genotype x environment interaction (84.6239) for the genotypes of the carioca group, which evidences that the interaction affected the phenotypic value (Table 2). In this context, the genotypes with higher yields in an
environment tended to show different performances
in different environments (Table 3), as well as unpredictability and low adaptation to environmental
variations.
The estimates of the genotype x environment
interaction were high, corresponding to 27.39% of the
group. The estimates contributed to the achievement
of the genotypic correlation of the performance considered low in several environments (0.0156).
The individual phenotypic variance results from the sum of the genotypic variance, as well as from the
residual variance between plots, and the variance of
the genotype x environment interaction (Carvalho et al., 2016). A significant genetic progress was obtained (Table 2) for the genotypes of the black and carioca
groups, although the residual variance between plots
accounts for 81 and 72.16% of the phenotypic value, respectively. Similar results were observed by Torres et al. (2015), in cowpea bean genotypes, using mixed
models. The residual variance between plots accounted
for values above 60% of the individual phenotypic
variance.
The genotypic correlation for the performance in several environments indicates the reliability of the ordering of the best genotypes in the different environments under study (Gonçalves et al., 2014). As
to the black group, no changes were observed in the
ordering of the selected genotypes, which is evidenced by the high estimate of the genotypic correlation for the performance in several environments (0.98), and for the high-selective accuracy (0,7591). The results show a low effect of the genotype x environment interaction and favor the selection of genotypes with
wide adaptation to the different environments.
In general, significant changes were observed in the ordering of the genotypes of the carioca
commercial bean due to the low magnitude of the
genotypic correlation for the performance in different environments and due to the low-selective accuracy.
This indicates the occurrence of a complex interaction
between genotypes and environments, which favors the selection of genotypes with more specific adaptation (Rosado et al., 2012).
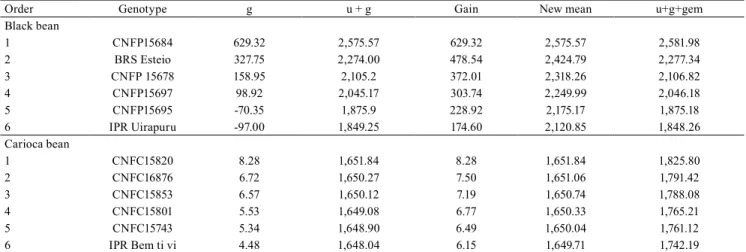
The best genotypes were selected by the three different strategies (Tables 3, 4, and 5). In the selection of the six best genotypes of the black group, according
to the mean performance in all environments, the
improved genotype CNFP 15684 showed higher-grain yield (u+g+gem = 2.581,98) (Table 3). The predicted
genetic gain of this genotype was higher than those of the commercial genotypes 'BRS Esteio' and 'IPR Uirapuru'. The same behavior of the genetic averages (predicted genotypic value, u + g) of the trait is expected when the selected genotypes are subjected to several environments (Maia et al., 2009) due to the
conservative aspect of the method, which affects the
predicted genotypic values.
When the six best genotypes of the carioca group
were selected based on the mean performance in all
environments, and on the genotypic values free from interaction, a higher-grain yield was observed in the improved genotypes – CNFC 15820, CNFC 16876, CNFC 15853, CNFC 15801, and CNFC 15743 (Table
Table 3. Estimates of genetic gain predicted for grain yield of common bean (Phaseolus vulgaris) cultivars of the carioca
group (cultivated in the municipalities of Caruaru, Arcoverde and Belém de São Francisco), and the black group (cultivated in Caruaru and Arcoverde), considering the mean performance of the environments, in the state of Pernambuco, Brazil(1).
Order Genotype g u + g Gain New mean u+g+gem
Black bean
1 CNFP15684 629.32 2,575.57 629.32 2,575.57 2,581.98 2 BRS Esteio 327.75 2,274.00 478.54 2,424.79 2,277.34 3 CNFP 15678 158.95 2,105.2 372.01 2,318.26 2,106.82 4 CNFP15697 98.92 2,045.17 303.74 2,249.99 2,046.18 5 CNFP15695 -70.35 1,875.9 228.92 2,175.17 1,875.18 6 IPR Uirapuru -97.00 1,849.25 174.60 2,120.85 1,848.26 Carioca bean
1 CNFC15820 8.28 1,651.84 8.28 1,651.84 1,825.80
2 CNFC16876 6.72 1,650.27 7.50 1,651.06 1,791.42
3 CNFC15853 6.57 1,650.12 7.19 1,650.74 1,788.08
4 CNFC15801 5.53 1,649.08 6.77 1,650.33 1,765.21
5 CNFC15743 5.34 1,648.90 6.49 1,650.04 1,761.12
3). The predicted genetic gain of these genotypes exceeded the results for the 'IPR BEM-TE-VI' genotype. The magnitudes of the genetic gain values
can be considered for recommendation of beans, for the selection of genetic material with mean performance, in the different environments assessed.
The recommendation of the genotypes with the best stability and best adaptation to the different
environments is inherent to the capitalizing of
genotype x environment interaction (Carvalho et al., 2017). Among the adaptability and stability methods, this is the least detrimental to the predicted genotypic values, since it capitalizes the effects of the genotype x environment interaction of each environment (Rosado et al., 2012; Carvalho et al., 2016).
For the commercial black bean, the genotypes CNFP 15684, 'BRS Esteio', CNFP 15678, CNFP 15697, CNFP 15695, and 'IPR Uirapuru' remained superior in
Caruaru and Arcoverde, which was also observed in
the selection by the genetic mean free from interaction in the mean of the two environments (Table 3). It can be inferred that the six genotypes selected in the two
environments do not perform a complex interaction
with the environment, which was evidenced by the constancy in which they showed up in the order of classification in the two environments (Table 4).
When the six agronomically superior genotypes
selected for the two environments were considered,
the maintenance of the genotype superiority order was already expected, due to the low values found (Table 4) for the variance of the genotype x environment interaction (2.4205) and the determination coefficients of the genotype x environment interaction (0.0038). The selected genotypes may also have their
recommendation extrapolated to cultivation in several
environments by respecting the interaction standard of the experimental network (Rosado et al., 2012).
Different results were verified for the genotypes
of the carioca group. There was a different standard for each environment in the ordering of the selected
genotype for high-grain yield (Table 4). This behavior
was expected due to the high estimates of the variance
of the genotype x environment interaction (84.6239) and the coefficients of determination of the genotype x environment interaction (0.2740). It also implies the recommendation of genotypes for specific
environments (Torres et al., 2015; Carvalho et al.,
2017). The genotype CNFC 15820 was the only one of the carioca group among the six best genotypes for the
environments Arcoverde and Belém de São Francisco.
In the selection of the six best bean genotypes of the carioca commercial type, considering all environments (Table 3), the predicted genetic gain was lower, compared with the selection by each environment (Table 4). This can be attributed to the better capitalization of the effects of the genotype x
Table 4. Estimates of the genetic gain predicted for grain
yield of common bean (Phaseolus vulgaris) cultivars of
the carioca and black groups, evaluated in three and two municipalities, respectively, in Pernambuco state, Brazil(1).
Order Genotype g+ge u+g+ge Gain New mean Carioca bean
Caruaru
1 CNFC15839 104.73 672.69 104.73 672.69 2 CNFC15826 89.68 657.64 97.2 665.16 3 CNFC16709 75.04 642.99 89.82 657.77 4 CNFC15859 64.44 632.4 83.47 651.43 5 CNFC16876 63.25 631.2 79.43 647.38
Arcoverde
1 CNFC15854 248.53 2,037.40 248.53 2,037.40 2 CNFC15820 240.98 2,029.86 244.75 2,033.63 3 BRS FC402 209.54 1,998.41 233.02 2,021.89 4 CNFC15853 206.90 1,995.78 226.49 2,015.36 5 BRS Estilo 149.70 1,938.57 211.13 2,000.00 6 CNFC16709 114.93 1,903.80 195.10 1,983.97
Belém de São Francisco
1 IPR BEM-TE-VI 494.82 3,068.65 494.82 3,068.65 2 CNFC16876 397.80 2,971.63 446.31 3,020.14 3 CNFC15801 319.59 2,893.42 404.07 2,977.90 4 CNFC15743 311.07 2,884.91 380.82 2,954.65 5 CNFC15820 296.47 2,870.30 363.95 2,937.78 6 CNFC15853 270.82 2,844.65 348.43 2,922.26
Black Bean Caruaru
1 CNFP15684 629.94 2,249.87 629.94 2,249.87 2 BRS Esteio 328.83 1,948.76 479.38 2,099.31 3 CNFP 15678 163.62 1,783.55 374.13 1,994.06 4 CNFP15697 104.52 1,724.45 306.73 1,926.66 5 CNFP15695 -66.85 1,553.08 232.01 1,851.94 6 IPR Uirapuru -98.43 1,521.50 176.94 1,796.87
Arcoverde
1 CNFP15684 641.57 2,914.14 641.57 2,914.14 2 BRS Esteio 333.36 2,605.93 487.46 2,760.03 3 CNFP 15678 157.53 2,430.10 377.48 2,650.05 4 CNFP15697 95.35 2,367.92 306.95 2,579.52 5 CNFP15695 -75.29 2,197.28 230.50 2,503.07 6 IPR Uirapuru -97.56 2,175.01 175.83 2,448.40 (1)Estimates: g+ge, genotypic effect by each environment; and u+g+ge,
genotypic value predicted with capitalization of the interaction with the
environment interaction on the selection strategy by
each environment, compared with the selection for all
environments, based on the genetic value (Rosado et al., 2012; Carvalho et al., 2016).
The study on the genotype x environment interaction is completed by the estimation of adaptability and stability, or the level of response to the environmental stimuli and to yield predictability, depending on the environmental variations (Maia et al., 2009).
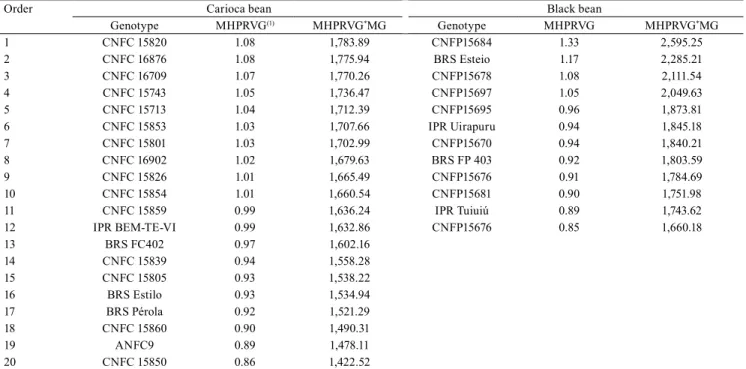
When the selection of genotypes of the carioca group in all environments was considered (Table 3), it was observed that five out of the six best genotypes were also selected based on the genotypes with the best agronomic response, using the MHPRVG method for grain yield. The genotypes CNFC 15820, CNFC 16876, CNFC 16709, CNFC 15743, and CNFC 15713 (Table 5) were selected, since they exceeded the controls 'IPR BEM-TE-VI', 'Pérola', and 'BRS Estilo'. The results for stability and adaptability for these genotypes, however,
do not agree with the results of the selection carried out
for each environment (Table 4), since a low estimative
was obtained for the correlation of the performance in
several environments (Table 2). It can be inferred, in these cases, that the selection of genotypes for high yield, predictability, and adaptability, is specific for each location (Maia et al., 2009; Torres et al., 2015).
Similarly to the selection that considers all environments (Table 3), the genotypes of the black bean group CNFP 15684, 'BRS Esteio', CNFP 15678, CNFP 15697, CNFP 15695 and 'IPR Uirapuru' showed
the best agronomic performance, when using the
MHPRVG method for grain yield, and were superior to the genotype 'Tuiuiú' (Table 5). The lower the standard deviation of the genotypic behavior between the
environments, the higher the harmonic average of the
genotypic values through the environments. Therefore, the selection by the higher values of the harmonic mean of the genotypic values implies the simultaneous selection for yield and stability (Resende, 2002).
The results for stability and adaptability for the genotypes CNFP 15684, 'BRS Esteio', CNFP 15678, CNFP 15697, CNFP 15695, and 'IPR Uirapuru', agree with the results of the selection, which previously indicated that these genotypes show a good performance
Table 5. Stability and adaptability (MHPRVG and MHPRVG * MG) of the genotypic values for grain yield of 20 common
bean (Phaseolus vulgaris) genotypes of the carioca group (in the municipalities of Caruaru, Arcoverde, and Belém de São
Francisco), and of 12 genotypes of the black group (Caruaru and Arcoverde), evaluated 90 days after emergence, in the 2016 crop season, in Pernambuco state, Brazil.
Order Carioca bean Black bean
Genotype MHPRVG(1) MHPRVG*MG Genotype MHPRVG MHPRVG*MG
1 CNFC 15820 1.08 1,783.89 CNFP15684 1.33 2,595.25 2 CNFC 16876 1.08 1,775.94 BRS Esteio 1.17 2,285.21 3 CNFC 16709 1.07 1,770.26 CNFP15678 1.08 2,111.54 4 CNFC 15743 1.05 1,736.47 CNFP15697 1.05 2,049.63 5 CNFC 15713 1.04 1,712.39 CNFP15695 0.96 1,873.81 6 CNFC 15853 1.03 1,707.66 IPR Uirapuru 0.94 1,845.18 7 CNFC 15801 1.03 1,702.99 CNFP15670 0.94 1,840.21 8 CNFC 16902 1.02 1,679.63 BRS FP 403 0.92 1,803.59 9 CNFC 15826 1.01 1,665.49 CNFP15676 0.91 1,784.69 10 CNFC 15854 1.01 1,660.54 CNFP15681 0.90 1,751.98 11 CNFC 15859 0.99 1,636.24 IPR Tuiuiú 0.89 1,743.62 12 IPR BEM-TE-VI 0.99 1,632.86 CNFP15676 0.85 1,660.18 13 BRS FC402 0.97 1,602.16
14 CNFC 15839 0.94 1,558.28 15 CNFC 15805 0.93 1,538.22 16 BRS Estilo 0.93 1,534.94 17 BRS Pérola 0.92 1,521.29 18 CNFC 15860 0.90 1,490.31
19 ANFC9 0.89 1,478.11
20 CNFC 15850 0.86 1,422.52
(Tables 3 and 4) regardless of the environment. This
standard was also observed for most of the selected
genotypes, considering all environments (Table 3).
It indicates that the simultaneous selection criterion
based on adaptability, stability, and yield, is effective to select the best genotypes by their genotypic value, with
the loss of unstable genetic materials and capitalization
of the adaptability of the most stable materials.
The maintenance of the ordering of the selected
genotypes is evident for the three selection methods
used due to the positive and high-magnitude correlation
between the genotypic behavior of the genotypes in relation to the different environments. Genotypes with high yield, predictability, and wide adaptabililty can
be selected based on these results.
It is worth noting the Blup effectiveness to eliminate
environmental effects and interaction noise (Resende, 2004), and to select genetic materials according to their adaptability and genotypic stability. This is interesting for the formation of breeding populations and, mainly,
for the recommendation of new cultivars of black and carioca beans as commercial crops.
Conclusions
1. The average heritability of the 12 genotypes of the black bean group for grain yield shows high values, which indicates a favorable condition for the highly accurate selection of the improved genotypes.
2. The average heritability of the 20 genotypes of the carioca bean group for grain yield shows low
values, which indicates an onerous condition for the
selection of the improved genotypes.
3. The black bean genotypes – CNFP 15684, 'BRS Esteio', CNFP 15678, CNFP 15697, CNFP 15695, and 'IPR Uirapuru' – show the best performance in the
two tested environments, Caruaru and Arcoverde, in
Pernambuco state, considering, simultaneously, grain yield, adaptability, and stability.
4. The harmonic mean method of relative
performance of genetic value (MHPRVG) provides an optimum selection of genotypes for yield, stability, and adaptability; therefore, it should be included
in the selective criteria for the recommendation of
agronomically superior genotypes for comercial
cultivation of black and carioca beans.
Acknowledgments
To Embrapa Arroz e Feijão, for the carioca and
black bean seeds; and to Instituto Agronômico de
Pernambuco (IPA), for support in implementing and carrying out the experiments.
References
ACOMPANHAMENTO DA SAFRA BRASILEIRA [DE]
GRÃOS: safra 2017/18: quinto levantamento, v.5, n.5, 2018. Available at: <https://www.conab.gov.br/index.php/info-agro/ safras/graos/boletim-da-safra-de-graos>. Accessed on: May 5 2018.
BARILI, L.D.; VALE, N.M. do; AMARAL, R. de C.; CARNEIRO, J.E. de S.; SILVA, F.F. e; CARNEIRO, P.C.S. Adaptabilidade e estabilidade e a produtividade de grãos em cultivares de feijão preto recomendadas no Brasil nas últimas cinco décadas.
Ciência Rural, v.45, p.1980-1986, 2015. DOI: 10.1590/0103-8478cr20141383.
BARROS, M.A.; ROCHA, M. de M.; GOMES, R.L.F.; SILVA, K.J.D. e; NEVES, A.C. das. Adaptabilidade e estabilidade produtiva de feijão-caupi de porte semiprostrado. Pesquisa Agropecuária Brasileira, v.48, p.403-410, 2013. DOI: 10.1590/ S0100-204X2013000400008.
BASTOS, I.T.; BARBOSA, M.H.P.; RESENDE, M.D.V. de; PETERNELLI, L.A.; SILVEIRA, L.C.I. da; DONDA, L.R.; FORTUNATO, A.A.; COSTA, P.M. de A.; FIGUEIREDO, I.C.R. de. Avaliação da interação genótipo x ambiente em cana-de-açúcar via modelos mistos. Pesquisa Agropecuária Tropical, v.37, p.195-203, 2007.
BOIÇA JÚNIOR, A.L.; MUÇOUÇAH, M.J.; SANTOS, T.M. dos; BAUMGARTNER, J.G. Efeito de cultivares de feijoeiro, adubação e inseticidas sobre Empoasca kraemeri Ross & Moore,
1957 e Bemisia tabaci (Gennadius, 1889). Acta Scientiarum. Agronomy, v.22, p.955-961, 2000. DOI: 10.4025/actasciagron. v22i0.2855.
BOLETIM DO CLIMA: SÍNTESE CLIMÁTICA. Recife: Apac, v.4, n.1, 2016. 32p. Available at: <http://www.apac.pe.gov.br/>. Accessed on: May 27 2018.
CARVALHO, A.D.F.; SILVA, G.O.; RESENDE, F.V. Adaptabilidade e estabilidade de populações de cenoura pelo método REML/BLUP. Horticultura Brasileira, v.35, p.69-74, 2017. DOI: 10.1590/s0102-053620170111.
CARVALHO, L.P. de; FARIAS, F.J.C.; MORELLO, C. de L.; TEODORO, P.E. Uso da metodologia REML/BLUP para seleção de genótipos de algodoeiro com maior adaptabilidade e estabilidade produtiva. Bragantia, v.75, p.314-321, 2016. DOI: 10.1590/1678-4499.275.
CAVALCANTI, F.J. de A. (Coord.). Recomendações de adubação para o Estado de Pernambuco: segunda aproximação. 3.ed. rev.
FAO. Food and Agriculture Organization of the United Nations.
Faostat: Crops. 2016. Available at: http://www.fao.org/faostat/ en#data/QC. Accessed on: May 5 2017.
GONÇALVES, G.M.; VIANA, A.P.; AMARAL JÚNIOR, A.T. do; RESENDE, M.D.V. de. Breeding new sugarcane clones by mixed models under genotype by environmental interaction.
Scientia Agricola, v.71, p.66-71, 2014. DOI: 10.1590/S0103-90162014000100009.
MAIA, M.C.C.; RESENDE, M.D.V.; PAIVA, J.R. de; CAVALCANTI, J.J.V.; BARROS, L. de M. Seleção simultânea para produção, adaptabilidade e estabilidade genotípicas em clones de cajueiro, via modelos mistos. Pesquisa Agropecuária Tropical, v.39, p.43-50, 2009.
NASCIMENTO, S.P. do; BASTOS, E.A.; ARAÚJO, E.C.E.; FREIRE FILHO, F.R.; SILVA, E.M. da. Tolerância ao déficit hídrico em genótipos de feijão-caupi. Revista Brasileira de Engenharia Agrícola e Ambiental, v.15, p.853-860, 2011. DOI: 10.1590/S1415-43662011000800013.
RESENDE, M.D.V. de. Genética biométrica e estatística
no melhoramento de plantas perenes. Brasília: Embrapa
Informação Tecnológica; Colombo: Embrapa Florestas, 2002. 975p.
RESENDE, M.D.V. de. Métodos estatísticos ótimos na análise de experimentos de campo. Colombo: Embrapa Florestas, 2004.
65p. (Embrapa Florestas. Documentos, 100).
RESENDE, M.D.V. de. Software Selegen-REML/BLUP: a useful tool for plant breeding. Crop Breeding and Applied Biotechnology, v.16, p.330-339, 2016. DOI: 10.1590/1984-70332016v16n4a49.
RESENDE, M.D.V. de; DUARTE, J.B. Precisão e controle de qualidade em experimentos de avaliação de cultivares. Pesquisa Agropecuária Tropical, v.37, p.182-194, 2007.
ROSADO, A.M.; ROSADO, T.B.; ALVES, A.A.; LAVIOLA, B.G.; BHERING, L.L. Seleção simultânea de clones de eucalipto de acordo com produtividade, estabilidade e adaptabilidade.
Pesquisa Agropecuária Brasileira, v.47, p.964-971, 2012. DOI: 10.1590/S0100-204X2012000700013.
SANTOS, H.G. dos; JACOMINE, P.K.T.; ANJOS, L.H.C. dos; OLIVEIRA, V.A. de; LUMBRERAS, J.F.; COELHO, M.R.; ALMEIDA, J.A. de; CUNHA, T.J.F.; OLIVEIRA, J.B. de. Sistema brasileiro de classificação de solos. 3.ed. Brasília: Embrapa, 2013. 353p.
SILVA, A.C.F.; MELO, P.G.S.; MELO, L.C.; BASSINELLO, P.Z.; PEREIRA, H.S. Eficiência de métodos de melhoramento para teor de fibra e produtividade de grãos em progênies de feijoeiro comum.
Bragantia, v.72, p.326-331, 2013a. DOI: 10.1590/brag.2013.046. SILVA, G.A.P.; CHIORATO, A.F.; GONÇALVES, J.G.R.; PERINA, E.F.; CARBONELL, S.A.M. Análise da adaptabilidade e estabilidade de produção em ensaios regionais de feijoeiro para o Estado de São Paulo. Revista Ceres, v.60, p.59-65, 2013b. DOI: 10.1590/S0034-737X2013000100009.
SILVA, O.F. da; WANDER, A.E. O feijão-comum no Brasil: passado, presente e futuro. Santo Antônio de Goiás: Embrapa Arroz e Feijão, 2013. 61p. (Embrapa Arroz e Feijão. Documentos, 287).
TORRES, F.E.; TEODORO, P.E.; SAGRILO, E.; CECCON, G.; CORREA, A.M. Interação genótipo × ambiente em genótipos de feijão-caupi semiprostrado via modelos mistos. Bragantia, v.74, p.255-260, 2015. DOI: 10.1590/1678-4499.0099.