DNA repair gene expressions are related to bone
marrow cellularity in myelodysplastic syndrome
Howard L Ribeiro Jr,
1,2Allan Rodrigo S Maia,
1,2Roberta Taiane G de Oliveira,
1,2Marília Braga Costa,
1,2Izabelle Rocha Farias,
1,2Daniela de Paula Borges,
1,2Juliana Cordeiro de Sousa,
1,2Silvia Maria M Magalhães,
1,2Ronald F Pinheiro
1,2,31Cancer Cytogenomic Laboratory, Center for Research and Drug Development (NPDM), Federal University of Ceara, Fortaleza, Ceara, Brazil 2Post-Graduate Program in Medical Science, Federal University of Ceara, Fortaleza, Ceara, Brazil
3Post-Graduate Program of Pathology, Federal University of Ceara, Fortaleza, Ceara, Brazil
Correspondence to
Dr Ronald F Pinheiro, Federal University of Ceara, Center for Research and Drug Development (NPDM) R. Coronel Nunes de Melo, 1000–2° andar—Rodolfo Teófilo—CEP, Fortaleza, Ceara 60430–275, Brazil; ronaldfpinheiro@uol.com.br
Received 2 December 2016 Revised 21 February 2017 Accepted 7 April 2017
To cite:Ribeiro HL, Maia ARS, de Oliveira RTG, et al.J Clin PatholPublished Online First: [please include Day Month Year] doi:10.1136/jclinpath-2016-204269
ABSTRACT
Objective To evaluate the expression of genes related to nuclear excision (ERCC8,XPAandXPC), homologous recombination and non-homologous end-joining (ATM, BRCA1,BRCA2andLIG4) repair mechanisms, using quantitative PCR methodologies, and it relation with bone marrow cellularity in myelodysplastic syndrome (MDS).
Methods and results A total of 51 adult de novo patients with MDS (3 refractory anaemia (RA), 11 refractory anaemia with ringed sideroblasts (RARS), 28 refractory cytopenia with multilineage dysplasia (RCMD), 3 refractory anaemia with excess blasts type I (RAEB-I), 5 refractory anaemia with excess blasts type II (RAEB-II), and 1 chronic myelomonocytic leukaemia (CMML) were evaluated. For karyotype, 16.2% patients were defined as very low prognosis, 59.5% low risk, 8.1% intermediate risk, 5.4% high risk and 10.8% very high risk. For bone marrow cellularity, 17.6%, 17.6% and 64.7% presented as hypocellular, normocellular and hypercellular, respectively. Patients with hypocellular MDS had significantly decreased expression ofATM ( p=0.000), BRCA1( p=0.014),BRCA2( p=0.003), LIG4 ( p=0.004) andERCC8( p=0.000) than those with normocellular/hypercellular bone marrow, whereasXPA ( p=0.049) andXPC( p=0.000) genes were increased. In patients with hypoplastic MDS, a low expression of ATM( p=0.0268),LIG4( p=0.0199) andERCC8 ( p=0.0493) was significantly associated with the presence of chromosomal abnormalities. We detected positive correlations betweenBRCA1andBRCA2 (r=0.416; p=0.007),ATMandLIG4(r=0.472; p=0.001),LIG4andBRCA1(r=0.333; p=0.026),LIG4 andBRCA2(r=0.334; p=0.025),ATMand XPA (r=0.377; p=0.008),ATMandXPC(r=0.287; p=0.046),LIG4andXPC(r=0.371; p=0.007) andXPA andXPCgenes (r=0.895; p=0.0000). We also found among all patients evaluated that correlation withLIG4 occurred most often.
Conclusions These correlations demonstrate the important intrinsic relations between single and double DNA strand breaks genes in MDS, emphasising that these genes are related to MDS pathogenesis.
INTRODUCTION
Myelodysplastic syndrome (MDS) is a heteroge-neous group of clonal haematopoietic stem cell dis-orders characterised by peripheral cytopenias due to ineffective haematopoiesis.1–3Bone marrow cel-lularity in patients with MDS is usually
hypercellu-lar or normocelluhypercellu-lar.4 According to WHO,5
10–15% of patients with MDS can present hypo-cellular bone marrow, which has prognostic signifi -cance for hypoplastic MDS (hMDS).5 6–8
Schemenau et al9 evaluated the prognostic
importance of cellularity among 1270 patients with MDS and showed that for cases with hypercellular, normocellular and hypocellular bone marrow there was a significant difference in median survival of 25 months, 42 months and 38 months, respect-ively.9 Acute myeloid leukaemia progression rates were 33% after 2 years (hypercellular), whereas normocellular and hypocellular cases showed a pro-gression of only 19%. These results suggest that hypercellular bone marrow in MDS is related to a poor prognosis.9
Patients with hypocellular bone marrow are usually younger, have immune abnormalities such as vasculitis, pyoderma and respond to antithymo-cyte globulin (Atgam) treatment.10–12 In a study of the pathogenesis of hMDS, Younget al,13reported that T cells affect bone marrow destruction as in aplastic anaemia, reinforcing hMDS as a distinct entity with a different prognosis.
DNA repair is an important mechanism for maintaining the integrity of multicellular organisms and for ensuring genomic stability.14 DNA damage constantly arises from DNA replication, spontan-eous chemical reactions and assaults by external or metabolism-derived agents.15 16At least four main,
partially overlapping damage repair pathways
operate in mammals: nucleotide-excision repair (NER), base excision repair (BER), homologous recombination (HR) and non-homologous end-joining (NHEJ). NER and BER are related to single-strand lesion and HR and NHEJ, to double-strand breaks (DSBs). DSBs are mutagenic DNA lesions3 14 17and are considered to exert important biological effects on the formation of chromosomal aberrations, cell death and transformation,3 14 17 which are common features of MDS. NER elimi-nates helix-distorting DNA damage, a broad cat-egory of damage that affects one of the two DNA
strands.15 Problems in NER are also related to
cancer and senescence.15
We previously demonstrated that polymorphisms of DNA repair genes related to HR are associated with the pathogenesis of MDS.18 19We found that
the polymorphisms of ATM, RAD51, XRCC5 and
XRCC6 are associated with the genesis and
aeti-ology of MDS.18 19 Importantly, we recently
showed that these polymorphisms are functional, influencing the level of expression ofATM, XRCC6 andLIG4.20
Ribeiro HL,et al.J Clin Pathol2017;0:1–11. doi:10.1136/jclinpath-2016-204269 1
Original article
JCP Online First, published on May 29, 2017 as 10.1136/jclinpath-2016-204269
Copyright Article author (or their employer) 2017. Produced by BMJ Publishing Group Ltd under licence.
group.bmj.com on August 22, 2017 - Published by
The aim of this study was to evaluate the relation between
expression of genes related to NER (ERCC8, XPA and XPC),
HR and NHEJ (ATM, BRCA1, BRCA2 and LIG4) repair
mechanisms and bone marrow cellularity in MDS.
PATIENTS AND METHODS Patients
Fifty-one adult de novo patients with MDS were diagnosed at Federal University of Ceara according to WHO.10 The patients
were evaluated according to WHO classification10 and the
International Prognosis Score System revised (IPSS-R).21 Bone marrow cellularity was assessed on biopsy specimens and was stratified as hypocellular, normocellular and hypercellu-lar, in relation to the patient’s age. Hypocellularity in patients with MDS was defined as <30% in those aged <70 years, and 20% in patients >70% years, according to the established cri-teria of the European consensus on grading bone marrowfi bro-sis and assessment of cellularity.22
The study was approved by the ethics committee of the Federal University of Ceara (No. 1.292.509) and conducted according to the Declaration of Helsinki. Informed consent was obtained from all participants included in this study.
Cytogenetic analysis
Conventional G-band karyotype analysis was performed on bone marrow cells of 51 de novo patients with MDS according to the protocol already established in our laboratory.23 Briefly, cultures were established in RPMI 1640 medium (Gibco, Grand Island, New York, USA) containing 30% fetal calf serum. For the 24-hour culture, colcemid was added at afinal concentration of 0.05μg/mL for the final 30 min. After harvesting, the cells were exposed to a hypotonic KCl solution (0.068 mol/L) and
fixed with Carnoy buffer (acetic acid/methanol in a 1:3 propor-tion). The slides were prepared and stained using Giemsa solu-tion. A minimum of 20 metaphases was analysed whenever possible. The karyotype was prepared using a CytoVision Automated Karyotyping System (Applied Imaging, San Jose, California, USA) and described according to the International System for Human Cytogenetic Nomenclature (2013).
Total RNA extraction
Total RNA extractions from isolated mononuclear cells (bone marrow), obtained from patients with MDS, were performed with TRizol Reagent (Invitrogen, Carlsbad, California, USA), according to the manufacturer’s protocol.
Table 1 Characteristics of patients with MDS according to bone marrow cellularity
Variables Hypocellular MDS (n=9) Normal/hypercellular MDS (n=9/n=33) p Value
Age (years), mean (range) 43 (22–58) 67 (41–88) 0.000
Gender
Male 4 (44.4) 20 (47.6) 0.863
Female 5 (55.6) 22 (52.4)
Haemoglobin (g/dL), mean (range) 8.87 (6.2–13.1) 8.46 (4.9–12.9) 0.620
ANC (×10L−1), mean (range) 527.11 (217–1075) 2185.55 (144–7429) 0.000
Platelets (mm3), mean (range) 827 900 (12 100
–300 000) 7 857 110 (10 500–676 000) 0.140
Ring sideroblasts (%), mean (range) 8 (0–70) 19 (0–80) 0.290
Blasts (%), mean (range) 2 (0–11) 3.12 (0–37) 0.634
Transfusional dependence
Dependence 4 (44.4) 23 (56.1) 0.525
Non-dependence 5 (55.6) 18 (43.9)
WHO classification
RA 0 (0.0) 3 (7.1)
RARS 1 (11.1) 10 (23.8)
RCMD 7 (77.8) 21 (50.0)
RAEB 1 (11.1) 7 (16.7)
CMML-1 0 (0.0) 1 (2.4)
High-grade (RA, RARS, RCMD and CMML) 8 (88.9) 35 (83.3)
Low-grade (RAEB) 1 (11.1) 7 (16.7) 0.173
Karyotype
Normal 2 (28.6) 19 (63.3) 0.095
Abnormal 5 (71.4) 11 (36.7)
No metaphase 2 (14.3) 12 (85.7)
Cytogenetics prognosis
Very low+low+intermediate 6 (85.7) 29 (96.7) 0.249
High+very high 1 (14.3) 1 (3.3)
IPSS-R score
Very low+low+intermediate 5 (71.4) 26 (86.7) 0.325
High+very high 2 (28.6) 4 (13.3)
AML transformation 2 (25.0) 5 (12.8) 0.378
Results are shown as number (%) unless stated otherwise. Bold text indicates significant differences (p<0.05) between groups.
cDNA synthesis
cDNA was generated from total RNA using the high-capacity cDNA reverse transcription kit (Applied Biosystems, San Jose, California, USA), according to the manufacturer’s protocol. cDNA synthesis was generated using Mastercycler Pro Vapor Protect Technology machine (Eppendorf, Hamburg, Germany). cDNA samples were stored at−20°C.
Quantitative real-time PCR
Quantitative real-time PCR reactions were based on TaqMan methodology (Applied Biosystems, Carlsbad, California, USA) and run on a 7500 Fast System (Applied Biosystems, Carlsbad, California, USA). Predeveloped TaqMan gene expression
assays forATM(Hs01112344_m1),BRCA1(Hs01556191_m1),
BRCA2 (Hs01037423), LIG4 (Hs00934061_m1), ERCC8
(Hs01122124_m1), XPA (Hs00166045_m1) and XPC
(Hs01104213_m1) as well as the TaqMan Universal Master Mix II, with uracil N-glycosylase (Applied Biosystems, Carlsbad, California, USA) were used to quantify mRNA expression. The expression level of theβ2-microglobulin gene (B2M) and ubiqui-tin (UBC) were used to normalise differences in input cDNA. Each sample was performed in duplicate and the expression ratios were calculated using the 2−ΔCqmethod.24
Statistical analysis
Data on relative mRNA expression (ΔCq values—quantitative
cycle) were expressed as mean and range (maximum and minimum) in order to determine the possible association between relative gene expressions and the analysed variables. Normality was evaluated by Shapiro–Wilk test. Outliers were removed.
Student’s t-test or one-way analysis of variance with Tukey/ Games–Howell post hoc test were used to analyse the associa-tions between gene expression and the variables. The homogen-eity of variances for all variables was tested by Levene’s test. Multinomial logistic regression (MLR) analysis was used to esti-mate the ORs for each gene that might contribute to cellularity.
The best DNA repair expression cutoff point predicting MDS overall survival was calculated using the web-based Cutoff Finder software9 (Cutoff Finder—http://molpath.charite.de/cutoff/index. jsp) by Kaplan–Meier curve analysis based on the log-rank test.
Pearson’s correlation test was used to obtain r and r2values. Statistical analyses were performed using the GraphPad Prism 5 (GraphPad Prism software, La Jolla, California, USA) and SPSS 20.0 (SPSS Inc, Chicago, Illinois, USA) computer software pro-grams. Probability level ( p value) <0.05 was assumed.
RESULTS Patients
Characteristics of the patients with MDS are shown intable 1. A total of 51 adult de novo patients with MDS (3 refractory anaemia (RA), 11 refractory anaemia with ringed sideroblasts (RARS), 28 refractory cytopenia with multilineage dysplasia (RCMD), 3 refractory anaemia with excess blasts type I (RAEB-I), 5 refractory anaemia with excess blasts type II (RAEB-I(RAEB-I), and 1 chronic myelomonocytic leukaemia (CMML) were analysed according to WHO classification.10 Cytogenetic analyses were performed in 37/51 (72.5%) patients. Of those, 21 (56.8%) showed normal karyotype, 16 (43.2%) showed abnormal karyo-type; 14 (27.5%) presented no metaphases (table 1). For
karyo-type, 6 (16.2%) patients were defined as having a very low
prognosis, 22 (59.5%) as low risk, 3 (8.1%) as intermediate risk, 2 (5.4%) as high risk and 4 (10.8%) as very high risk,
according to IPSS-R21(table 1). Table
2 Gene expr ession of pa tients with MDS according to bone marr ow cellularity AT M gene expr ession (2 − Δ Cq ) BRC A1 gene expr ession (2 − Δ Cq ) BRC A2 gene expr ession (2 − Δ Cq ) LIG4 gene expr ession (2 − Δ Cq ) BM cellularity Mean (r ange) p V alue Mean (r ange) p V alue* Mean (r ange) p V alue* Mean (r ange) p V alue DSB Hypocellular 0.001849 (0.003379 – 0.000663) 0.000 † 0.003351 (0.007095 – 0.001553) 0.014 ‡ 0.001423 (0.0035092 – 0.0000601) 0.003 ‡ 0.000767 (0.001238 – 0.000335) 0.004 † Normocellular 0.00474 (0.008631 – 0.00107) – 0.005962 (0.011155 – 0.001788) – 0.002212 (0.0033876 – 0.000504) – 0.001443 (0.002379 – 0.000692) – Hyper cellular 0.004471 (0.010709 – 0.001067) 0.000 † 0.006369 (0.012149 – 0.002896) 0.014 ‡ 0.003845 (0.0091746 – 0.0004713) 0.003 ‡ 0.001297 (0.002429 – 0.000464) 0.004 † BM cellularity ERCC8 gene expr ession ( 2 − Δ Cq ) XP A gene expr ession ( 2 − Δ Cq ) XPC gene expr ession ( 2 − Δ Cq )* Mean (Range) p value Mean (Range) p value* Mean (Range) p value* SSB Hypocellular 0.0001183 (0.000048 – 0.000187) 0.000 † 0.001730 (0.0005042 – 0.002810) 0.049 † 0.01657 (0.01438 – 0.01834) 0.000 § Normocellular 0.0002028 (0.000118 – 0.000307) –– 0.001383 (0.0005689 – 0.002637) – 0.01212 (0.003582 – 0.02825) 0.000 § Hyper cellular 0.0002028 (0.000118 – 0.000307) 0.000 † 0.001198 (0.0005661 – 0.002416) 0.049 † As terisk indica tes significant differ ences (p<0.05) betw een gr oups. *These genes w er e analy sed for the hypocellular versus normocellular+hypercellular gr oups. † These da ta w er e analy sed by one-w ay analy sis of variance (ANO VA) with the Games – Ho w ell pos t hoc tes t. ‡ These da ta w er e analy sed by one w ay ANO VA with the Tuk ey pos t hoc tes t. §These da ta w er e analy sed by a two-sided Student t tes t. BM, bone marr ow; DSB, double-s tr and br eak genes rela ted to double DNA str and br eak repair pa thw ay; MDS, my elody splas tic syndr ome; SSB, single-s tr and br eak genes rela ted to single DNA str and br eak repair pa thw ay .
Ribeiro HL,et al.J Clin Pathol2017;0:1–11. doi:10.1136/jclinpath-2016-204269 3
Original article
group.bmj.com on August 22, 2017 - Published by
For bone marrow cellularity, 9 (17.6%) patients presented hypocellular bone marrow, 9 (17.6%) normocellular and 33 (64.7%) hypercellular (table 1). For patients with hypocellular
MDS, 5/7 (71.4%) had chromosomal abnormalities (table 1),
whereas for patients with normocellular/hypercellular hMDS
11/30 (36.7%) were found to have abnormalities (table 1).
We determined that hMDS was associated with a lower count of neutrophils ( p=0.000) and younger patients ( p=0.000) (table 1).
mRNA expression of DNA repair genes in relation to bone marrow cellularity
We evaluated mRNA expression ofATM,BRCA1,BRCA2,LIG4,
ERCC8,XPA andXPCgenes related to the bone marrow cellu-larity analysis. The mRNA expressions of patients with MDS are shown intable 2.
Patients with hypocellular MDS presented significantly lower
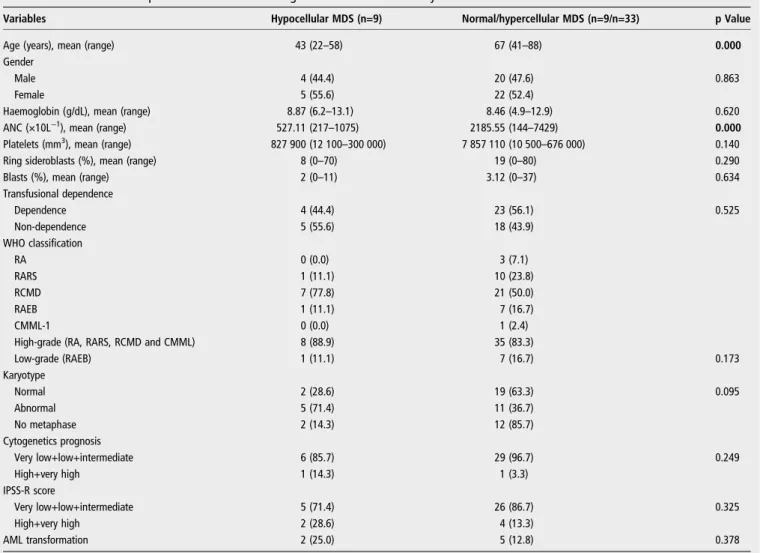
ATM ( p=0.000; 95% CI=0.001330 to 0.003914) mRNA
expression levels than patients with hypercellular bone marrow (figure 1A). We also detected an important decrease ofBRCA1
expression ( p=0.014; 95% CI 0.000514 to 0.005521),BRCA2
( p=0.003; 95% CI 0.000709 to 0.004136), LIG4 ( p=0.004;
95% CI 0.000162 to 0.000899) and ERCC8 ( p=0.000; 95%
CI 0.000070 to 0.000245) genes (figure 1B–E) in hMDS. On the other hand, we found that there is an increase ofXPA
( p=0.049; 95% CI 0.000000182 to 0.001064) and XPC
( p=0.000; 95% CI 0.002192 to 0.006704) expression in hMDS (figure 1F, G).
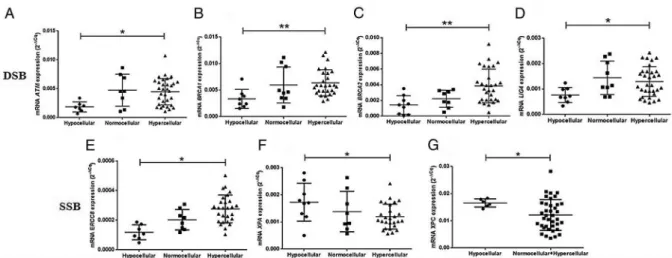
Analysis of karyotype in patients with hypoplastic MDS in relation to DNA repair genes
Patients with hMDS who showed low expression of ATM
( p=0.0268; 95% CI 0.005891 to 0.0006105), LIG4
( p=0.0199; 95% CI 0.001239 to 0.0001663) and ERCC8
( p=0.0493; 95% CI=0.000303 to 0.0000007) genes were
significantly associated with the presence of chromosomal
abnormalities (seefigure 2A–C).
Low expression was considered when the mean of values of ATM, LIG4 and ERCC8 gene expressions were significantly lower than the mean observed for patients with hMDS with or without presence of chromosomal abnormalities (table 3).
Overall survival by Cutoff Finder of DNA repair genes in patients with MDS
We determined the cutoff value using the Cutoff Finder biostat-istical tool to discriminate survival by Kaplan–Meier with log-rank post-test9(table 4). This method correlates the dichoto-mised biomarker with a binary outcome using logistic regression.9
First, we selected 0.001638 as the optimal cutoff value for all
subsequent analyses to differentiate between lower LIG4
(<0.001638) and higher LIG4 (>0.001638) gene expression (figure 3A). Overall, 36 (70.6%) patients with MDS were
con-sidered to be lower LIG4 and 15 (29.4%) considered higher
LIG4(figure 3A, B). LowerLIG4patients with MDS were asso-ciated with a higher overall survival ( p=0.017; HR=2.42; 95% CI 1.14 to 5.13) (figure 3C).
Figure 2 Plots ofATM,LIG4andERCC8gene amplification analysis compared with the presence of chromosomal abnormalities in patients with hypocellular myelodysplastic syndrome. Asterisk indicates significant differences ( p<0.05).
Figure 1 DNA repair genes analysis according to bone marrow cellularity. (A) mRNAATMexpression. (B) mRNABRCA1expression. (C) mRNA
BRCA2expression. (D) mRNALIG4expression. (E) mRNAERCC8expression. (F) mRNAXPAexpression. (G) mRNAXPCexpression. Asterisk indicates
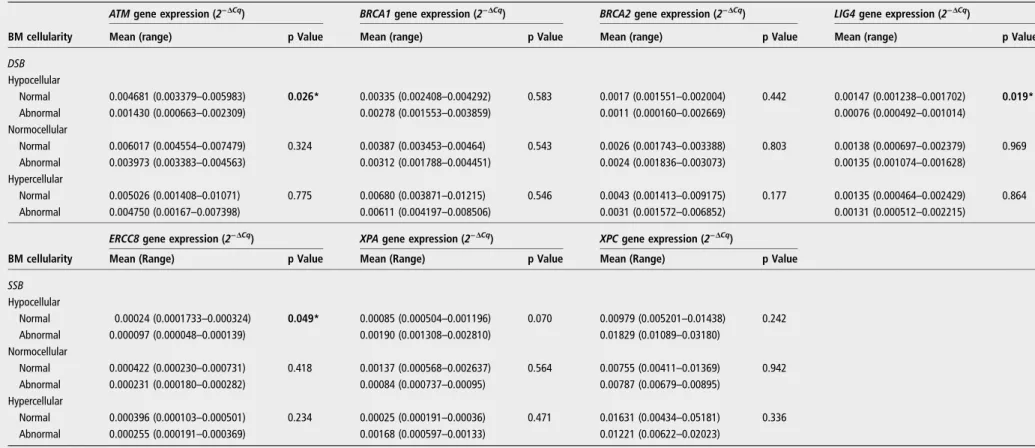
Table 3 Comparison of DNA repair gene expression according to presence of chromosomal abnormalities in subgroups of bone marrow cellularity
ATMgene expression (2−ΔCq) BRCA1gene expression (2−ΔCq) BRCA2gene expression (2−ΔCq) LIG4gene expression (2−ΔCq)
BM cellularity Mean (range) p Value Mean (range) p Value Mean (range) p Value Mean (range) p Value
DSB
Hypocellular
Normal 0.004681 (0.003379–0.005983) 0.026* 0.00335 (0.002408–0.004292) 0.583 0.0017 (0.001551–0.002004) 0.442 0.00147 (0.001238–0.001702) 0.019* Abnormal 0.001430 (0.000663–0.002309) 0.00278 (0.001553–0.003859) 0.0011 (0.000160–0.002669) 0.00076 (0.000492–0.001014)
Normocellular
Normal 0.006017 (0.004554–0.007479) 0.324 0.00387 (0.003453–0.00464) 0.543 0.0026 (0.001743–0.003388) 0.803 0.00138 (0.000697–0.002379) 0.969 Abnormal 0.003973 (0.003383–0.004563) 0.00312 (0.001788–0.004451) 0.0024 (0.001836–0.003073) 0.00135 (0.001074–0.001628)
Hypercellular
Normal 0.005026 (0.001408–0.01071) 0.775 0.00680 (0.003871–0.01215) 0.546 0.0043 (0.001413–0.009175) 0.177 0.00135 (0.000464–0.002429) 0.864 Abnormal 0.004750 (0.00167–0.007398) 0.00611 (0.004197–0.008506) 0.0031 (0.001572–0.006852) 0.00131 (0.000512–0.002215)
BM cellularity
ERCC8gene expression (2−ΔCq) XPAgene expression (2−ΔCq) XPCgene expression (2−ΔCq)
Mean (Range) p Value Mean (Range) p Value Mean (Range) p Value
SSB
Hypocellular
Normal 0.00024 (0.0001733–0.000324) 0.049* 0.00085 (0.000504–0.001196) 0.070 0.00979 (0.005201–0.01438) 0.242 Abnormal 0.000097 (0.000048–0.000139) 0.00190 (0.001308–0.002810) 0.01829 (0.01089–0.03180)
Normocellular
Normal 0.000422 (0.000230–0.000731) 0.418 0.00137 (0.000568–0.002637) 0.564 0.00755 (0.00411–0.01369) 0.942 Abnormal 0.000231 (0.000180–0.000282) 0.00084 (0.000737–0.00095) 0.00787 (0.00679–0.00895)
Hypercellular
Normal 0.000396 (0.000103–0.000501) 0.234 0.00025 (0.000191–0.00036) 0.471 0.01631 (0.00434–0.05181) 0.336 Abnormal 0.000255 (0.000191–0.000369) 0.00168 (0.000597–0.00133) 0.01221 (0.00622–0.02023)
Asterisk in bold text indicates significant differences (p<0.05) between groups analysed byStudent’s t-testtwo sided.
BMC, bone marrow cellularity; DSB, double-strand break genes related to double DNA strand break repair pathway; SSB, single-strand break genes related to single DNA strand break repair pathway.
Ribeir
o
HL,
et
al
.
J
Clin
Pa
thol
2017;
0
:1
–
11.
doi:10.11
36/jclinpa
th-2016-2
04269
5
Original
article
group.bmj.com
on August 22, 2017 - Published by
http://jcp.bmj.com/
Based on 0.001674 cutoff point value forXPAgene analysis, we found that there were 21 (41.2%) patients with a higherXPA and 30 (58.8%) patients with a lower XPA (figure 3A, B). We observed that higherXPA(>0.001674) patients with MDS were
associated with a lower overall survival ( p=0.019; HR=3.23; 95% CI 1.15 to 9.06) (figure 3E, F).
No difference in overall survival was detected for other genes
related to HR (ATM, BRCA1, BRCA2) and NER (ERCC8 and
Table 4 Multinominal logistic regression for the DNA repair gene expressions concerning bone marrow cellularity of patients with MDS
Multinominal logistic regression†
Gene BMC Cases (n) Cut-off point* χ2 Wald p Value OR 95% CI
ATMexpression 0.001821 0.052
Lower‡ Hypocellular 4 (36.4) – – – –
Normocellular 2 (18.2) – – – –
Hypercellular 5 (45.4) – – – –
Higher§ Hypocellular 3(8.3) – – – –
Normocellular 6 (16.7) – – – –
Hypercellular 27 (75.0) – – – –
BRCA1expression 0.0105 0.817
Lower‡ Hypocellular 8 (19.5) – – – –
Normocellular 8 (19.5) – – – –
Hypercellular 25 (61.0) – – – –
Higher§ Hypocellular 0 (0.0) – – – –
Normocellular 1 (25.0) – – – –
Hyercellular 3 (75.0) – – – –
BRCA2expression 0.001741 0.007
Lower‡ Hypocellular 6 (50.0) 8.075 0.004 12.500 2.190 to 71.363
Normocellular 2 (16.7) 0.563 0.453 2.083 0.306 to 14.168
Hypercellular 4 (33.3) – – – –
Higher§ Hypocellular 3 (8.8) 8.075 0.004 0.080 0.014 to 0.457
Normocellular 6 (17.7) 0.563 0.453 0.480 0.071 to 3.264
Hypercellular 25 (73.5) – – – –
LIG4expression 0.001638 0.196
Lower‡ Hypocellular 8 (22.2) – – – –
Normocellular 6 (16.7) – – – –
Hypercellular 22 (61.1) – – – –
Higher§ Hypocellular 0 (0.0) – – – –
Normocellular 3 (23.1) – – – –
Hypercellular 10 (76.9) – – – –
ERCC8expression 0.0002351 0.019
Lower‡ Hypocellular 7 (30.4) 4.712 0.030 11.900 1.272 to 111.351
Normocellular 6 (26.1) 3.216 0.073 5.100 0.859 to 30.265
Hypercellular 10 (43.5) – – – –
Higher§ Hypocellular 1 (5.0) 4.712 0.030 0.084 0.009 to 0.786
Normocellular 2 (10.0) 3.216 0.073 0.196 0.033 to 1.164
Hypercellular 17 (85.0) – – – –
XPAexpression 0.001674 0.172
Lower‡ Hypocellular 3 (9.7) – – – –
Normocellular 7 (22.6) – – – –
Hypercellular 21 (67.7) – – – –
Higher§ Hypocellular 6 (30.0) – – – –
Normocellular 9 (17.6) – – – –
Hypercellular 12 (60.0) – – – –
XPCexpression 0.009534 0.345
Lower‡ Hypocellular 1 (6.2) – – – –
Normocellular 4 (25.0) – – – –
Hypercellular 11 (68.8) – – – –
Higher§ Hypocellular 8 (22.9) – – – –
Normocellular 5 (14.3) – – – –
Hypercellular 22 (62.9) – – – –
Bold text indicates significant differences (p<0.05) between groups analysed by one-way analysis of variance. *Cut-off points established by the Cutoff Finder web tool.
†Multinominal logistic regression analysis with significant differences in p<0.05.
‡Patients were included when the gene expression was lower than or equal to the cutoff point according to Cutoff Finder software. The reference category is higher for MLR analysis. §Patients were included when the gene expression was higher than the cutoff point according to Cutoff Finder software. The reference category is lower for MLR analysis.
χ2, Pearson
XPC)when their values were dichotomised as biomarkers with a binary outcome using logistic regression (data not presented).
MLR analysis of expressions of DNA repair genes
The expression of genes related to DSBs (ATM,BRCA1,BRCA2,
LIG4) and single-strand breaks (SSBs) (ERCC8, XPA, XPC) was divided into two groups: low and high expression, according to cutoff point established by Cutoff Finder biostatistical web application.9
We identified two subgroups of patients according to gene expression: lower group (when expression was lower than or equal to the cutoff value) and higher group (when expression
was higher than the cutoff value).9 We detected that the
decreased expression of BRCA2 ( p=0.004, OR=12.500, 95%
CI 2.190 to 71.363) andERCC8( p=0.030, OR=11.900, 95%
CI 1.272 to 111.3512) genes were associated with diagnosis of hMDS (table 4).
No significant associations were found between the ATM,
BRCA1,LIG4,XPAandXPCexpressions and the bone marrow cellularity by MLR analysis ( p>0.05) (table 3).
Correlations of the mRNA expressions of DNA repair genes in patients with MDS
By Pearson’s correlation analysis, we observed significant
corre-lations between the DSB (ATM, BRCA1, BRCA2,LIG4) and SSB
(ERCC8, XPA and XPC) genes in MDS, demonstrating that
these genes work in a dependent manner as a cascade of events (table 5).
We observed positive correlations betweenBRCA1andBRCA2
(r=0.416; r2=0.173; p=0.007) (figure 4A), ATM and LIG4
(r=0.472; r2=0.222; p=0.001) (figure 4B); LIG4 and
BRCA1(r=0.333; r2=0.110; p=0.026) (figure 4C),LIG4 and BRCA2 (r=0.334; r2=0.111; p=0.025) (figure 4D), ATM andXPA(r=0.377; r2=0.142; p=0.008) (figure 4E),ATM and
Figure 3 Analysis of cutoff points forLIG4andXPAgenes as predictive marker for higher survival of patients with myelodysplastic syndrome. Red lines mark the optimal cutoff point forLIG4gene expression. (A, D) Histogram ofLIG4andXPAgene expressions in 51 patients with myelodysplastic syndrome (MDS). (B, E) HR for disease-free survival depending on the cutoff point. (C, F). HR for overall survival depending on the cutoff point. The plots were generated using the biostatistical tool Cutoff Finder software.
Ribeiro HL,et al.J Clin Pathol2017;0:1–11. doi:10.1136/jclinpath-2016-204269 7
Original article
group.bmj.com on August 22, 2017 - Published by
XPC(r=0.287; r2=0.082; p=0.046) (figure 4F),LIG4andXPC (r=0.371; r2=0.137; p=0.007) (figure 4G) and XPA and XPC genes (r=0.895; r2=0.801; p=0.0000) (figure 4H).
DISCUSSION
We evaluated genes related to double and single DNA strand breaks in patients with MDS and detected that these genes are positively correlated and work in a dependent manner as a cascade of events and may be related to pathogenesis and prog-nosis of MDS. We found that genes recruited and activated by DNA double (ATM) and single (ERCC8) strand breaks are downregulated in hMDS. Ataxia telangiectasia mutated (ATM) is a serine/threonine protein kinase that, once activated, phosphor-ylates several key proteins that initiate activation of the DNA damage checkpoint, leading to cell cycle arrest, DNA repair or
apoptosis.19 25 ERCC8(CSA), together with ERCC6(CSB), is
the cell signalling that begins the transcription-coupled repair subpathway of NER.26As both genes act as primary sensors of DNA lesions, we suggest that DNA repair is deficient in hMDS and DNA damage tends to accumulate.
Importantly, we also found that for patients with hMDS with low expression ofATMandERCC8there was a significant asso-ciation with the presence of chromosomal abnormalities, reinforcing the intrinsic link between single- and double-strand breaks in MDS, principally in hypoplastic MDS. SSBs are not
usually associated with a major DNA lesion and,19
conse-quently, chromosomal breaks, but may be the first step to a
DSB if not properly corrected.27 The estimated numbers of
SSBs and spontaneous base losses in nuclear DNA are as high as 104 per cell per day.19 If the cell signalling of this type of lesion shows low expression, it may help to increase the chance of DSBs and consequent chromosomal abnormalities, as presented here.
Among several protein complexes involved in HR repair
path-ways,BRCA1/2, which are members of the BRCA family, were
initially identified as biomarkers of breast cancer.28–30BRCA1/2
work with proteins of theRADcomplex to control of genomic
stability.28–30 To the best of our knowledge, this is the
first report to demonstrate that both genes show low expression in hMDS and are intrinsically and positively correlated, reinforcing the suggestion thatBRCA1/2work in a similar way. This result
Table 5 Pearson’s correlation analysis of DNA repair genes in patients with MDS
Pearson’s correlation analysis ATM BRCA1 BRCA2 LIG4 ERCC8 XPA XPC
ATM
Pearson correlation (r) 1 0.255 0.232 0.472 0.267 0.377 0.287
r2
– 0.065 0.053 0.222 0.071 0.142 0.082
p Value (2-tailed) – 0.099 0.135 0.001 0.088 0.008 0.046
N 49 43 43 49 42 49 49
BRCA1
Pearson correlation (r) 0.255 1 0.416 0.333 0.303 0.153 0.257
r2 0.065
– 0.173 0.110 0.091 0.023 0.066
p Value (2-tailed) 0.099 – 0.007 0.026 0.061 0.315 0.088
N 43 45 41 45 39 45 45
BRCA2
Pearson correlation (r) 0.232 0.416 1 0.334 0.272 −0.195 0.003
r2 0.053 0.173
– 0.111 0.073 0.038 0.000009
p Value (2-tailed) 0.135 0.007 – 0.025 0.090 0.199 0.987
N 43 41 45 45 40 45 45
LIG4
Pearson correlation (r) 0.472 0.333 0.334 1 0.243 0.219 0.371
r2 0.222 0.110 0.111
– 0.059 0.047 0.137
p Value (2-tailed) 0.001 0.026 0.025 – 0.116 0.123 0.007
N 49 45 45 51 43 51 51
ERCC8
Pearson correlation (r) 0.267 0.303 0.272 0.243 1 −0.173 −0.173
r2 0.071 0.091 0.073 0.059
– 0.0299 0.0299
p Value (2-tailed) 0.088 0.061 0.090 0.116 – 0.267 0.275
N 42 39 40 43 43 43 43
XPA
Pearson correlation (r) 0.377 0.153 −0.195 0.219 −0.173 1 0.895
r2 0.142 0.023 0.038 0.047 0.0299
– 0.801
p Value (2-tailed) 0.008 0.315 0.199 0.123 0.267 – 0.0000
N 49 45 45 51 43 51 51
XPC
Pearson correlation (r) 0.287 0.257 0.003 0.371 −0.173 0.895 1
r2 0.082 0.066 0.000009 0.137 0.0299 0.801
–
p Value (2-tailed) 0.046 0.088 0.987 0.007 0.275 0.0000 –
N 49 45 45 51 43 51 51
also corroborates the importance of both genes in maintaining genomic stability because their low expression among patients reported here was associated with an increase of chromosomal abnormalities.
The low expressions of BRCA1 and BRCA2 genes have also
been reported in solid tumours, such as epithelial ovarian car-cinoma, prostate cancer and breast cancer.31 32Using MLR
ana-lysis, we detected that decreased expression of BRCA2 was
associated with an increased chance of developing hMDS with an OR of 12. We were initially surprised with this result because BRCA2is associated with DNA repair, but Jeonget al33showed thatBRCA2deficiency leads to T cell loss and immune dysfunc-tion. In a very elegant murine model, the researchers demon-strated that mice with deficiency of BRCA2 show reduction in splenic T cell number and less interferon γ and interleukin 4, suggesting a functional defect of BRCA2-deficient T cells.33 BRCA2deficiency mice showed a greatly reduced production of IgM (ninefold reduction) compared with IgG1 (threefold reduc-tion) or IgG2a (less than threefold reducreduc-tion) isotypes.32 All these results suggest thatBRCA2is also linked to immune abnor-malities.32 As hMDS is considered an immune disorder,34 35
our result, showing decreased expression of BRCA2 with
increased chance of developing hMDS, was probably not obtained by chance. New reports and in vitro models are neces-sary to confirm our associations.
LIG4(DNA ligase 4) encodes a protein that is a DNA ligase which joins SSBs in a double-stranded polydeoxynucleotide in an ATP-dependent reaction.36This protein is essential for V(D)J recombination, generation of the T cell receptor,
immunoglobu-lin molecules and DNA DSB repair through NHEJ.36We were
interested to detect low expression of LIG4 among patients
with hMDS because deficiency of LIG4 has been associated
with pancytopenia, combined immunodeficiency, cellular radio-sensitivity, and recently, its mutation was associated with altera-tions of T and B cell counts with an increased percentage of
memory cells and hypogammaglobulinaemia,37 all markers of
immune dysregulation. Hypoplastic MDS is considered an
‘autoimmune disorder’ owing to the concept that T cells
contribute to bone marrow failure and that T cell depleting agents, such as rabbit and equine antithymocyte globulin, are important options of treatment.32 33
Importantly, we also detected among all patients evaluated (not only patients with hMDS) that correlation with theLIG4 gene occurred most often. It was positively correlated with ATM,BRCA1,BRCA2andXPC genes, which are linked to HR and NER. These correlations demonstrate the important intrin-sic relations between single and double DNA strand breaks in MDS, reinforcing the suggestion that these genes are all related to MDS pathogenesis.
We detected an increased expression of XPC and XPA in
hMDS. Damage to DNA single strand that occurs in the genome is recognised by the XPC and XPE protein complexes,
which are specific components of the global genome NER
system.26 38 The DNA helix is opened by the XPB and XPD
helixes of the repair, allowing damage verification by the XPA protein.26 38 So, one important cell signalling (XPC) and the
‘check’(XPA) of NER are hyperactivated in hMDS. As expected,
we also found that these two genes were also positively corre-lated. Using the Cutoff Finder biostatistical tool to discriminate the survival by Kaplan–Meier with log-rank post-test, we also found that patients with higher XPA (>0.001674) expression had a shorter overall survival ( p=0.019; HR=3.23; 95% CI 1.15 to 9.06). This method correlates the dichotomised bio-marker with a binary outcome using logistic regression.9This is the first report to demonstrate the importance of the single-strand DNA repair system in MDS and these modifications may be the first step in genomic instability which, if not properly corrected, would predispose to DSBs and, consequently, chromosomal abnormalities.
When evaluating patients with hMDS, most researchers have focused on evaluation of immunological abnormalities.34–35 39 We show, for the first time, that genes related to DNA repair may also be associated with the pathogenesis of hMDS. Recently, Danjou et al,39 evaluated a large cohort of patients with MDS exploring 147 954 single nucleotide polymorphisms localised in regions which display some degree of association
Figure 4 Plots of Pearson’s correlation analysis of DNA repair gene expressions of patients with myelodysplastic syndrome.
Ribeiro HL,et al.J Clin Pathol2017;0:1–11. doi:10.1136/jclinpath-2016-204269 9
Original article
group.bmj.com on August 22, 2017 - Published by
with immunological disorders. One of the most significant results was related to the gene RTEL1, an ATP helicase impli-cated in telomere-length regulation, DNA repair and genomic instability.39 Of utmost importance, mutations in RTEL1 are responsible for nail dystrophy, mucosal leucoplasia and progres-sive bone marrow failure, the hallmark of MDS.39The authors demonstrate the intrinsic association of immunological disorders and genes related to DNA repair, reinforcing our proposal that DNA repair genes may be intrinsically related to the pathogen-esis of hMDS.
Our study has some limitations. Limitations due to sample size are common in scientific publications, as stated by Danjou et al39and Gonçalveset al.40We found significant associations and correlations, but the number of cases evaluated was low and we cannot exclude the possibility that the absence of associa-tions related to other genes might be explained by this factor. We must also emphasise that the number of cases with hMDS was low, only nine cases. Hypolastic MDS is a rare entity among cases of MDS—<10% of cases—which makes it difficult to study large numbers.
We believe that the pathogenesis of hMDS is associated with an immune-mediated process,34and also with the repair mech-anism of DSB and SSB lesions. One important question arises: might the expression of these genes be new biomarkers of MDS? New reports are necessary to confirm or not our results.
Take home messages
▸ Previously, our group has shown that double and single
DNA strand breaks are related to the pathogenesis of myelodysplastic syndrome (MDS).
▸ Our study determined that DNA repair gene expressions are
positively correlated and work in a dependent manner as a cascade of events and may be related to the pathogenesis and prognosis of MDS.
▸ To the best of our knowledge, our study demonstrates for
thefirst time that hypoplastic MDS is associated with an immune-mediated process, and also with the repair mechanism of double-and single-strand breaks.
Handling editor Mary Frances McMullin.
Contributors HLRJ, ARSM, RTGdO, MBC, IRF, DdPB, JCdS, SMMM and RFP designed the study. provided patient materials and were responsible for the collection and assembly of data. HLRJ, ARSM, RTGdO, MBC, IRF, DdPB, JCdS, SMMM and RFP performed the molecular procedures and analysed the data. All authors drafted and edited the manuscript and approved thefinal version of manuscript before publication.
Funding This study was conducted with partial support from the National Counsel of Technological and Scientific Development (CNPq) and Cearense Foundation for the Support of Scientific and Technological Development (FUNCAP).
Competing interests None declared.
Ethics approval The study was approved by the ethics committee of the Federal University of Ceara (No. 1.292.509) and conducted according to the Declaration of Helsinki.
Patient consent Obtained.
Provenance and peer reviewNot commissioned; externally peer reviewed.
REFERENCES
1 Greenberg PL. Synergistic interactions of molecular and clinical advances for characterizing the myelodysplastic syndrome.J Natl Compr Canc Netw 2015;13:829–32.
2 Balleari E, Salvetti C, Del Corso L,et al. Age and comorbidities deeply impact on clinical outcome of patients with myelodysplastic syndrome.Leuk Res 2015;39:846–52.
3 Cazzola M, Della Porta MG, Travaglino E,et al. Classification and prognostic evaluation of myelodysplastic syndrome.Semin Oncol2011;38:627–34. 4 Yue GI, Hao S, Fadare O,et al. Hypocellularity in myelodysplastic syndrome is an
independent factor which predicts a favorable outcome.Leuk Res2008;32:553–8. 5 Vardiman JW, Thiele J, Arber DA,et al. The 2008 revision of the World Health
Organization (WHO) classification of myeloid neoplasms and acute leukemia: rationale and important changes.Blood2009;114:937–51.
6 Invernizzi R, Quaglia F, Porta MG. Importance of classical morphology in the diagnosis of myelodysplastic syndrome.Mediterr J Hematol Infect Dis2015;7: e2015035.
7 Della Porta MG, Travaglino E, Boveri E,et al. Minimal morphological criteria for defining bone marrow dysplasia: a basis for clinical implementation of WHO classification of myelodysplastic syndromes.Leukemia2015;29:66–75. 8 Bennett JM, Orazi A. Diagnostic criteria to distinguish hypocellular acute myeloid
leukemia from hypocellular myelodysplastic syndromes and aplastic anemia: recommendations for a standardized approach.Haematologica2009;94:264–8. 9 Schemenau J, Baldus S, Anlauf M,et al. Cellularity. characteristics of hematopoietic
parameters and prognosis in myelodysplastic syndromes.Eur J Haematol 2015;95:181–9.
10 Budczies J, Klauschen F, Sinn BV,et al. Cutofffinder: a comprehensive and straight forward web application enabling rapid biomarker cutoff optimization.PLoS ONE 2012;7:e51862.
11 Brunning RD, Germing U. Myelodysplastic syndromes. In: Orazi A, Weiss LM, Foucar K,et al.Neoplastic hematopathology. 3rd edn. Philadelphia: Lippinscott Williams & Wilkins, 2014:1076–107.
12 Batista MD, Fernandes RL, Rocha MAD,et al. Pioderma gangrenoso bolhoso e síndrome mielodisplásica.An Bras Dermatol2016;81:309–S312.
13 Young NS, Calado RT, Scheinberg P. Current concepts in the pathophysiology and treatment of aplastic anemia.Blood2006;108:2509–19.
14 Belli CB, Pinheiro RF, Bestach Y,et al. Myelodysplastic syndromes in South America: a multinational study of 1080 patients.Am J Hematol2015;90:851–8.
15 Hoeijmakers JH. DNA damage, aging and cancer.N Engl J Med2009;361:1475–85. 16 Mandal PK, Blanpain C, Rossi DJ. DNA damage response in adult stem cells:
pathways and consequences.Nat Rev Mol Cell Biol2011;12:198–202. 17 Malcovati L, Hellström-Lindberg E, Bowen D,et al. Diagnosis and treatment of
primary myelodysplastic syndromes in adults. Recommendations from the European LeukemiaNet.Blood2013;122:2943–64.
18 Ribeiro HL Jr, Oliveira RT, Maia AR,et al. ATM polymorphism is associated with low risk myelodysplastic syndrome.DNA Repair (Amst)2013;12:87–9.
19 Ribeiro HL Jr, de Oliveira RTG, Maia AR,et al. Polymorphisms of DNA repair genes are related to the pathogenesis of myelodysplastic syndrome.Hematol Oncol 2015;33:220–8.
20 Ribeiro HL Jr, Soares Maia AR, Costa MB,et al. Influence of functional polymorphisms in DNA repair genes of myelodysplastic syndrome.Leuk Res 2016;48:62–72.
21 Greenberg PL, Tuechler H, Schanz J,et al. Revised international prognostic scoring system for myelodysplastic syndromes.Blood2012;120:2454–65.
22 Thiele J, Kvasnicka HM, Facchetti F,et al. European consensus on grading bone marrowfibrosis and assessment of cellularity.Haematologica2005;90:1128–32. 23 Chauffaille ML. Adding FISH to karyotype in myelodysplastic syndrome investigation
diagnosis: are all questions answered?Leuk Res2010;34:413–5.
24 Livak KJ, Schmittgen TD. Analysis of relative gene expression data using real time quantitative PCR and the 2(-Delta DeltaC(T)) method.Methods2001;25:402–8. 25 Kasparek TR, Humphrey TC. DNA double-strand break repair pathways:
chromosomal rearrangements and cancer.Semin Cell Dev Biol2011;22:886–97. 26 Alekseev S, Coin F. Orchestral maneuvers at the damaged sites in nucleotide
excision repair.Cell Mol Life Sci2015;72:2177–86.
27 Belli M, Sapora O, Tabocchini MA. Molecular targets in cellular response to ionizing radiation and implications in space radiation protection.J Radiat Res
2002;43:13–19.
28 Friedenson B. The BRCA1/2 pathway prevents hematologic cancers in addition to breast and ovarian cancers.BMC Cancer2007;7:7–152.
29 Scardocci A, Guidi F, D’alou F,et al. Reduced BRCA1 expression due to promoter hyermethylation in therapy-related acute myeloid leukaemia.Br J Cancer 2006;95:1108–13.
30 Wang K, Ye Y, Xu Z,et al. Interaction between BRCA1/BRCA2 and ATM/ATR associate with breast cancer susceptibility in a Chinese Han population.Cancer Genet Cytogenet2010;200:40–6.
31 Bai X, Fu Y, Xue H,et al. BRCA1 promoter hypermethylation in sporadic epithelial ovarian carcinoma: association with low expression of BRCA1, improved survival and co-expression of DNA methyltransferases.Oncol Lett2014;7:1088–96. 32 Moro L, Arbini AA, Marra E,et al. Down-regulation of BRCA2 expression by collagen
type I promotes prostate cancer cell proliferation.J Biol Chem2005;280:22482–91. 33 Jeong JH, Jo A, Park P,et al. Brca2 deficiency leads to T cell loss and immune
34 Calado RT. Immunologic aspects of hypoplastic myelodysplastic syndrome.Semin Oncol2011;38:667–72.
35 Serio B, Risitano A, Giudice V,et al. Immunological derangement in hypocellular myelodysplastic syndromes.Transl Med UniSa2014;4:31–42.
36 Lieber MR. The mechanism of human nonhomologous DNA end joining.J Biol Chem2008;283:1–5.
37 Felgentreff K, Baxi SN, Lee YN,et al. Ligase-4 deficiency causes distinctive immune abnormalities in asymptomatic individuals.J Clin Immunol2016;36:341–53.
38 Iyama T, Wilson DM. DNA repair mechanisms in dividing and non-dividing cells. DNA Repair (Amst)2013;12:620–36.
39 Danjou F, Fozza C, Zoledziewska M,et al. A genome-wide association study by ImmunoChip reveals potential modifiers in myelodysplastic syndromes.Exp Hematol 2016;44:1034–8.
40 Gonçalves AC, Alves R, Baldeiras I,et al. Genetic variants involved in oxidative stress, base excision repair, DNA methylation, and folate metabolism pathways influence myeloid neoplasias susceptibility and prognosis.Mol Carcinog2017;56:130–48.
Ribeiro HL,et al.J Clin Pathol2017;0:1–11. doi:10.1136/jclinpath-2016-204269 11
Original article
group.bmj.com on August 22, 2017 - Published by