UNIVERSIDADE DE LISBOA FACULDADE DE CIÊNCIAS DEPARTAMENTO DE INFORMÁTICA
SECURITY METRICS TO EVALUATE QUALITY OF
PROTECTION
VERSÃO PUBLICA
Alberto Manuel Giroto Bruno
MESTRADO EM SEGURANÇA INFORMÁTICA
UNIVERSIDADE DE LISBOA FACULDADE DE CIÊNCIAS DEPARTAMENTO DE INFORMÁTICA
SECURITY METRICS TO EVALUATE QUALITY OF
PROTECTION
Alberto Manuel Giroto Bruno
Orientador Rahul Telang Co-Orientador
Marcelo Pasin
MESTRADO EM SEGURANÇA INFORMÁTICA
Resumo
As organizações precisam estar conscientes de qual o grau de protecção contra ameaças à segurança da sua informação.
A fim de establecer prioridades nos investimentos, as organizações precisam conhecer o "estado da arte" da sua segurança, para definir que sistemas precisam, mais cedo, de mais atenção. Isso só é possível com números que permitam identificar o nível de segurança dum sistema de informação e compará-lo com os outros. Para atingir este objectivo, as organizações devem definir quais são os factos relevantes que devem ser medidos, e como extrair informações significativas a partir dessas medidas.
As métricas de segurança ajudam as organizações a compreender a Qualidade de Protecção (QoP - Quality of Protection) dos seus sistemas de informação. Estas são uma valiosa ferramenta para diagnosticar problemas. No entanto, devem ser usadas com precaução, uma vez que, por exemplo, valores idênticos podem, em contextos diferentes, não ter o mesmo significado. O que exige sentido critico, ao técnico que analisa tais metricas, para perceber o seu real significado. As métricas de segurança devem ser usadas da mesma forma que um médico usa os resultados das análises de sangue, ou da pressão arterial, não como um resultado "per se", mas como um indicador de um possível problema.
Este projecto tem como objectivo a implementação de um conjunto de métricas de segurança, para avaliar quão vulneráveis estão os sistemas de informação duma organização e qual é o nível de ameaça que enfren-tam. Pretende-se ainda combinar essas métricas para determinar a sua QoP.
Para atingir estes objectivos, vamos identificar que métricas são pertinentes para cada tipo de componente do sistema de informação, vamos definir um modelo para calcular as métricas recolhidas e obter a informação sobre o risco de segurança do sistema, e finalmente vamos submeter a nossa proposta a um sistema real para verificar a aplicabilidade prática deste trabalho.
Abstract
Organizations need be aware of how protected they are against information security threats.
In order to prioritize their investments, organizations need to know the “state of the art” about their security, to determine which system needs closer attention, sooner. This is only possible with numbers that allow define system’s security level, and compare it with others. In order to achieve this goal, organizations must define which are the relevant facts that should be measured, and how to extract meaningful information from those measures.
Security metrics help organizations to understand the QoP (Quality of Protection) of their information sys-tems. Security metrics are a valuable tool for diagnosing problems. Nevertheless, it should be used with caution, given that, for example, identical values may, in different contexts, not have the same meaning, which demands critical judgement by the technician, which analyzes such metrics, to realize their true mea-ning. Security metrics should be used the same way a physician uses blood test results, or blood pressure monitoring, not as an outcome “per se” but as an indicator of a possible problem.
This project aims to propose the implementation of a set of security metrics, to evaluate how vulnerable are information systems, and what is the threat level they face. We also want to combine these metrics to determine their QoP.
To achieve our goals, we will identify which metrics are relevant for each type of information system com-ponent, we will define a model to compute the metrics collected and derive the information system security risk, and finally we will apply our proposal to a real system to verify the practical applicability of this work.
Acknowledgments
I would like to thank my advisor Professor Rahul Telang for his valuable advices, and guidance. Professor Marcelo Pasin for his availability.
I also would like to thank my collegues and friends at Portugal Telecom who helped me to collect data from systems, and provided me technical support, a special thank to José Aser, Ricardo Oliveira and Luis Sousa. Finnaly I would like to thank my sister Marta for her availability, and support in the statistical area.
Dedicated to Sonia, Sofia and Ricardo for all their love, affection and patience
Contents
1 Introduction 1
2 Related Work 4
2.1 OCTAVE – Allegro . . . 4
2.2 ISO/IEC 27004 Information Technology – Security Techniques – Information Security Ma-nagement – Measurement . . . 5
2.3 Relative Attack Surface Measures . . . 6
3 Computation Model 7 3.1 Intended Characteristics . . . 7 3.2 Terms Definition . . . 8 3.3 Model’s Rational . . . 8 3.4 Threshold Definition . . . 9 3.5 Weight Definition . . . 11
3.6 Vulnerability Index Calculation . . . 11
3.7 Threat Index . . . 12
3.8 Risk Index Calculation . . . 13
4 Metrics 14 4.1 Vulnerability Metrics . . . 14
4.1.1 Components . . . 15
4.1.1.1 Operating System . . . 15
4.1.1.2 Database Management System . . . 16
4.1.1.3 Application Server and Web Server . . . 16
4.1.1.4 Business Applications . . . 16
4.1.2.1 Patching . . . 16 4.1.2.2 Access Control . . . 17 4.1.2.3 Known Vulnerabilities . . . 18 4.1.2.4 Anti-virus . . . 18 4.1.2.5 Code Quality . . . 19 4.2 Threat Metrics . . . 19 4.2.1 SPAM . . . 19 4.2.2 Virus . . . 20 4.2.3 Web Filtering . . . 20 4.2.4 Firewall . . . 21 4.2.5 Security Incidents . . . 21 4.2.5.1 Reported by IDS . . . 21 4.2.5.2 Reported by Users . . . 21 5 Experimental Work 23 5.1 System Assessment . . . 23
5.2 Security Policy – Summary of Relevant Rules . . . 25
5.3 Vulnerability Index – Collected Metrics . . . 25
5.3.1 Presentation Tier . . . 26 5.3.1.1 Operating System . . . 26 5.3.1.2 Web Server . . . 28 5.3.2 Logic Tier . . . 29 5.3.2.1 Operating System . . . 30 5.3.2.2 Application Server . . . 30 5.3.2.3 Bussiness Aplications . . . 30 5.3.3 Data Tier . . . 30 5.3.3.1 Operating System . . . 31 5.3.3.2 DBMS . . . 31
5.4 Vulnerability Index – Thresholds and Weights . . . 32
5.5 Vulnerability Index – Calculation . . . 36
5.6 Threat Index – Collected Metrics . . . 37
5.6.2 Data Centre Level . . . 38
5.7 Threat Index – Thresholds and Weights . . . 39
5.7.1 Security Incidents . . . 40 5.7.1.1 Reported by IDS . . . 40 5.7.1.2 Reported by Users . . . 41 5.7.2 SPAM . . . 43 5.7.3 Web Filtering . . . 44 5.7.4 Virus . . . 45 5.7.4.1 Desktop . . . 45 5.7.4.2 Server . . . 46 5.7.5 Firewalls . . . 48 5.7.5.1 PTFWEXT01 . . . 48 5.7.5.2 PTFWFE01 . . . 49 5.7.5.3 PTFWBE01 . . . 50
5.8 Threat Index – Calculation . . . 53
5.9 Risk Index and Analysis of Results . . . 54
6 Future Work 55
7 Conclusions 57
List of Figures
3.1 Risk Index Graph . . . 9
3.2 Graph Weights . . . 11
3.3 Vulnerability Branch Graph . . . 12
3.4 Threat Branch Graph . . . 13
5.1 System Architecture . . . 24
5.2 Security Incidents – Boxplots . . . 41
5.3 Incident Calls – Boxplots . . . 42
5.4 SPAM – Boxplots . . . 43
5.5 Virus Detected in Desktops – Time Series . . . 45
5.6 Virus Detected in Desktops – Boxplots . . . 46
5.7 Virus Detected in Servers – Time Series . . . 46
5.8 Virus Detected in Servers – Histogram . . . 47
5.9 Firewall PTFWEXT01 – Boxplot . . . 48
5.10 Firewall PTFWFE01 – Boxplot . . . 50
List of Tables
4.1 Components, Groups and Metrics . . . 15
5.1 Assets, Components and Groups – Weights . . . 26
5.2 Operating System Collected Metrics – Weights, Values, and Indexes (Presentation Tier) . . . 27
5.3 Web Server Collected Metrics – Weights, Values, and Indexes . . . 29
5.4 Operating System Collected Metrics – Weights, Values, and Indexes (Logic Tier) . . . 29
5.5 Application Server Collected Metrics – Weights, Values, and Indexes . . . 30
5.6 Operating System Collected Metrics – Weights, Values, and Indexes (Data Tier) . . . 31
5.7 DBMS Collected Metrics – Weights, Values, and Indexes . . . 32
5.8 Oracle Dangerous Privileges . . . 33
5.9 Patching Thresholds . . . 34
5.10 Access Control Thresholds . . . 35
5.11 Anti-virus Thresholds . . . 36
5.12 Known Vulnerabilities Thresholds . . . 36
5.13 Assets, Components and Groups – Weights and Indexes . . . 37
5.14 Threat Collected Metrics and Weights . . . 38
5.15 Firewall – Log Message Codes . . . 39
5.16 Security Incidents – Time Series . . . 40
5.17 Security Incidents – Percentiles . . . 41
5.18 Security Incidents – Thresholds . . . 41
5.19 Incident Calls – Time Series . . . 42
5.20 Incident Calls – Percentiles . . . 42
5.21 Incident Calls – Thresholds . . . 43
5.22 SPAM – Time Series . . . 43
5.24 SPAM – Thresholds . . . 44
5.25 Web Filtering – Time Series . . . 44
5.26 Web Filtering – Thresholds . . . 45
5.27 Virus Detected in Desktops – Percentiles . . . 46
5.28 Virus Detected in Desktops – Thresholds . . . 46
5.29 Virus Detected in Servers – Percentiles . . . 47
5.30 Virus Detected in Servers – Thresholds . . . 47
5.31 Firewall PTFWEXT01 – Time Series . . . 48
5.32 Firewall PTFWEXT01 – Percentiles . . . 49
5.33 Firewall PTFWEXT01 – Thresholds . . . 49
5.34 Firewall PTFWFE01 – Time Series . . . 49
5.35 Firewall PTFWFE01 – Percentiles . . . 50
5.36 Firewall PTFWFE01 – Thresholds . . . 50
5.37 Firewall PTFWBE01 – Time Series . . . 51
5.38 Firewall PTFWBE01 – Percentiles . . . 51
5.39 Firewall PTFWFE01 – Thresholds . . . 52
5.40 Firewall PTFWBE01 – Percentiles (cardinal values) . . . 52
5.41 Firewall PTFWFE01 – Thresholds (cardinal values) . . . 52
5.42 Sub-metrics – Calculation Parameters . . . 53
5.43 Metrics – Calculation Parameters . . . 53
5.44 Groups – Calculation Parameters . . . 53
Chapter 1
Introduction
Information security is increasingly a topic on agenda. Every day we read news about system intrusion, data breaches, identity theft, denial of service, viruses, worms, etc. Some consequences of such events are reputation damage, or losses either direct (e.g., due to productivity decrease, and costs to fix the damage) or indirect (e.g., due to liability, and market-share reduction). To know how secure a system is, or how protected it is against these threats is a growing concern for organizations. Therefore organizations wonder if they are safe, or which is their degree of exposure.
A wise mind knows that there is no such thing as perfect security in information systems. Thus the goal must be to achieve a security level close to perfect security, but without incur in higher costs than the value of the protected object.
In order to decide where to invest and how to prioritize investments, organizations need to know how well protected each system is, which systems have higher risks, and how much should be invested to achieve the desired protection level. This is possible only with numbers that allow setting the security level of a system and with comparison of the level of protection of each system. To obtain relevant information, organizations must to define what should be measured, i.e., which are the facts that have impact in security, and how to extract meaningful numbers from that facts.
The measurement field in information security is not, however, as developed as, for instance, the field of QoS (Quality of Service). Which security metrics should be used, what they mean, how they relate to each other, and how to extract coherent numbers from them is far from being a consensual matter. “Even the term “security metrics” is often ambiguous and confusing in many contexts of discussion in information security” [1]. Thus in spite of the growing attention that IT (Information Technology) professionals have devoted to the QoP subject, and the general consensus about the fundamental role metrics play in better knowing security issues; it still needs deeper study, and it has not yet gained broad agreement.
Mainly due to subject immaturity, but also due to the information sensitivity of the measured object in this field, it is often difficult to collect data to calculate metrics. Also as stated in [2] “Practical challenges range from the lack of common definitions for terms and metrics to determining how to share information meaningfully. The vocabulary of information security is fraught with imprecision and overlapping meanings. Fundamental concepts and words, such as incident, attack, threat, risk, and vulnerability, mean different
things to different people. Basic metrics for counting events are difficult to collect because the terms are unclear.”
Still, we believe that the use of security metrics is the way to achieve a better understanding about the QoP of organization’s information systems. Security metrics can help in diagnosing the problems, and should be seen the same way the physician sees prescriptions for blood tests, or level of blood pressure. Sometimes the same results may have different meanings; it is the human’s educated mind that has to extract information from such results.
In this context, this project main goal is to identify how well protected is an asset or an information system “per se” (we consider a system as a group of assets working together for the same purpose), based on security metrics collected from the systems them self, from defence mechanisms and from publicly available data. Also, we totally agree with the sentence: “The scientific research world has always split into those two broad camps. The theorists rely on the experimentalists to gather the data by which competing theories are tested, and the experimentalists rely on the theorists to show how to extract order, structure and knowledge out of the mass of data.”1Thus we believe that just collect data is not enough, and that, some usefull information
should be extracted from such data. Therefore, we are ambitious about doing both, so a model to compute the collected information and derive the system’s QoP, will be proposed.
The model aims to identify the risk to which an information system is subject. This model is based on the equation Risk = T hreat × V ulnerability and with this project we want to:
• suggest several metrics that we consider representative of the information we want to get (we intend that this set of metrics be automatically or easily collected, and we will not use metrics derived from questionnaires or from expert opinion);
• define a high level process of information gathering, suggesting how and where this metrics can be collected;
• define a model that allows to organize and to combine each metric in a coherent set, and which will allow to derive a risk index for an information system;
• collect the defined metrics from a real live system in order to prove the practical applicability of our model.
More than a closed and final work, we seek that current work be a starting point for organizations begin collecting and correlating security data, producing indicators that will improve knowledge of information security, allowing to check their evaluation over time. New metrics may be (and should be) added to our model either due to technological evolution (which, for instance, will lead to new threats, or will made possible new data gathering), or because new systems or new components are added to information systems (different systems/components may have different security metrics depending of factors like architecture, hardware and software used, among others).
This work also intends to be an add-on to Pulso2application, so its development will take into consideration functionalities already implemented by Pulso.
1John Leach, securitymetrics.org mailing list message, “Modelers v measurers (was: Risk metrics),” January 31, 2006. [2] 2System developed at Portugal Telecom to assess their systems’ QoS.
Note: the present work has a confidential version. Some contents were removed from this public version, namely: confidential data from several tables, confidential data from graphics, and a part of Section 5.9. In tables that had some correlation with other tables, or graphics , we replaced the data by variables, otherwise the data was simply removed.
Chapter 2
Related Work
2.1
OCTAVE – Allegro
OCTAVE-Allegro [3] intends to be a more agile version of OCTAVE [4], evaluating organization’s operatio-nal risk environment, focusing the assessment in information assets based on their journey thru organization assets, seeing all other assets as mere containers where information assets are stored, transported or proces-sed. “A container can be a person (since people can store information as knowledge, transport information by communicating, or process information by thinking and acting), an object (e.g., a piece of paper), or a technology (e.g., a database). Thus, threats to information assets are identified and examined through the consideration of where they live, which effectively limits the number and types of assets brought into the process”[3].
OCTAVE-Allegro defines eight process steps (the output of each step will be used as input to the next one) grouped in four phases:
1. Establish Drivers
defines risk measurement criteria, identifying the organizational drivers and the most sensitive risk areas for organization mission and objectives;
2. Profile Assets
creates a consistent description of information assets and their security requirements and identifies the containers where they are processed, stored, and transported, whether internal or external to organiza-tion;
3. Identify Threats
real-world scenarios are surveyed, identifying areas of concern and their corresponding undesirable outcomes, these areas of concern are then expanded to threat scenarios that further detail the properties of a threat;
this phase ensures that consequence of risk are captured, then a quantitative measure of the impact a threat may cause in the organization is computed, and a relative risk score is derived. Finally risks are prioritized based on their relative scores, and their mitigation strategy is defined.
OCTAVE-Allegro is an outstanding and well-structured process to think about the security risks a organi-zation faces. Nevertheless, implementing such a process will be heavily time/resource consuming and in consequence most organizations will not be able to deploy it. Therefore, we intend to present a light weight process for measure QoP. Our process will implement a different perspective, instead of defining how well protected is an information asset all over its containers, will define for each information system (which will be a set of technological containers) how well protected are all the information assets it contains. Our method will allow a gradual approach to security measurements instead of all at once.
2.2
ISO/IEC 27004 Information Technology – Security Techniques –
Information Security Management – Measurement
It is an international information security standard developed by ISO (International Organization for Standar-dization) and IEC (International Electrotechnical Commission).
It is devoted to development and use of measurement in order to determine the effectiveness of an ISMS (Implemented Information Security Management System) as specified in ISO/IEC 27001.
This standard provides an information security measurement overview, describes the activities involved in a program of measures and measurement, and defines its objectives and success factors.
Consists of the following sections:
1. Management responsibilities
defines the management responsibilities in establishing the program involving relevant stakeholders in measurement activities, verifying measurement results, and improve the ISMS based on gathered results;
2. Measures and measurement development
provides guidance on how to develop measures and measurement for the purpose of assessing the effectiveness of ISMS; defining measurement scope, information needs, objects of measurement, de-velopment process, data collection process and analysis, implementation, and documentation;
3. Measurement operation
establishes how security measurement activities such as: data collection, data storing, data verification, and integration on the operation of ISMS should be conducted in order to provide accurate information about effectiveness of ISMS;
4. Data analysis and measurement results reporting
defines how gathered data should be analyzed, how to develop measurement results and to communi-cate results to relevant stakeholders;
5. Information Security Measurement Programme Evaluation and Improvement
establishes the need for regularly evaluate the measurement programme effectiveness, guarantying that: the program produces relevant results in accordance with information needs, is executed as planned, addresses changes in ISMS, and implements improvements.
This standard deeply details the measurement process and is a good guide, on how to implement a mea-surement programme, and in detailing the activities involved. For instance, it describes in detail how to collect, aggregate, derive measure, and produce indicators. Nevertheless, it is short on information about which concrete measurements can be collected (e.g., which attributes may be relevant for some object of measurement) in order to identify the ISMS effectiveness.
2.3
Relative Attack Surface Measures
The work presented in [5] proposes a metric which allow to compare the security of two systems by measuring and comparing their attack surface, “rather than attempt to measure the security of a system in absolute terms with respect to a yardstick, a more useful approach is to measure its “relative” security. We use “relative” in the following sense: Given System A, we compare its security relative to System B, and we do this comparison with respect to a given number of yardsticks, which we call dimensions. So rather than say “System A is secure” or “System A has a measured security number N” we say “System A is more secure than System B with respect to a fixed set of dimensions””[5].
It starts by defining a set of attack vectors, which then are categorized into different abstract dimensions defining the system’s attack surface.
The defined dimensions are: process targets, data targets, process enablers and channels, where targets can be constrained by access rights. The measure of the attack surface is then a function of the contributions of each dimension to the attack surface and, in turn each dimension is a function of the attack vectors to which a weight is attributed in function of its importance to the dimension it belongs.
This method can only be applied to systems that have the same operating environment and the same threat model. It is useful only to compare different versions of the same system or the same system with different configurations.
Chapter 3
Computation Model
The aim of this study is to suggest a practical approach to security metrics usage. In this chapter, we intend to define a simple model, easy to deploy, and adaptable, which should help organizations to give a first step toward defining, extracting, collecting and correlating useful information about the QoP of their information systems.
3.1
Intended Characteristics
We intend that our model is easily implementable and flexible enough to allow the introduction of new metrics to comport and to be adaptable to:
• constant information technology evolution, which leads to deployment of new products, evolution of old ones and to the consequent emergence of new threats and vulnerabilities from time to time;
• creative and innovative nature of attacks, which will probably lead to finding new kinds of vulnerabili-ties;
• different needs from different organizations, which will not be able/want to collect the same metrics (a metric that is important for an organization may not be important in other contexts, additionally, an organization can deploy new defences and most be able to understand how these new defences improved his security);
• organization expertise growing, after using security metris for a while, organizations will likely find out that some of the metrics initially collected, do not give the expected information and will also realize that others may be collected and tried in order to improve the QoP indicator;
• different attack surface of assets, which influence the possible kind of attacks it can suffer; consequently metrics that are meaningful for some kind of asset or component may be meaningless for another (different metrics can be defined for each kind of asset, and would be impossible in the context of this work to define all sets of metrics for each kind of asset).
Therefore, a rigid model can become outdated sooner than it is deployed, so only an adaptable model which is able to comport, and extract useful information from new metrics without jeopardize the old ones, will succeed.
It is also an objective of this work to produce information that can be easily understood by non-technical staff. Looking at the results produced by the model should be clear for non-technical people which is the QoP presented by an information system.
This model is focused in define/compute security metrics to measure QoP in scenarios of unauthorized access from malicious entities, either by failure of proper controls, or by vulnerability exploitation. However we believe that with an appropriate set of metrics and data it can be extended to measure QoP in unintentional failures/attacks scenarios.
3.2
Terms Definition
Information System designates a collection of assets, each one with specific roles, which collaborate in order to provide a set of related business functions to the organization.
Asset a single equipment composed of hardware and software, which has a specific role in an information system, for instance, application servers, or database servers are assets.
Component element that is part of an asset, for instance operating system, or database management sys-tem. Each component will have a specific set of group metrics.
Metric Group is a set of related metrics, which can produce an indicator about some aspect of system security. For instance we will define a set of metrics that are related with patching activity and we will group all of them in a group called Patching.
Metric is a number that measures some security related issue, or a logical value indicating the presence or absence of a security mechanism. It can be a cardinal number, a percentage, an average, or a boolean value.
Sub-metric represnts a sub-part of a metric, it is used when a metric can be specialized in several parts. For instance, if one have information allowing to define several impact levels (like low, medium, or high) one can create sub-metircs according to it, each part will have a different contribution to the overall metric.
3.3
Model’s Rational
The main block of our model is based on the well known equation Risk = T hreat × V ulnerability. According to [6], “The correct measure of how secure a system is depends as much on the number and severity of the flaws of the system (vulnerability) as on the potential of the attacks it may be subjected to (threat). This measure is called risk, (...)Risk - combined measure of the level of threat to which a computing
Risk index
Threat index
System Vulnerability
index
Figure 3.1: Risk Index Graph
or communication system is exposed, and of the degree of vulnerability it possesses”. Where Vulnerability is a “non-malicious fault or weakness in a computing or communication system that can be exploited with malicious intention”and threat is the “potential of attack on computing or communication systems”. Therefore this is our starting point and our goal is to define and to gather information that will allow to calculate the level of threat and the level of vulnerability of a system. Then based on these two parameters we will compute the risk of the system as shown in Figure 3.1. It becomes obvious that the higher the risk the lower the QoP (which is our final objective). To calculate threat and vulnerability indexes, our model will combine several sets of metrics collected from different data sources.
Firstly, we use a graph to represent the model. In the graph, each leaf will have a base metric; each parent node will have a value computed from a set of base metrics, collected from several data sources or from their child nodes; and each edge will have a weight representing the relative importance of the node to its parent node (for instance, in an information system that uses a central authentication server, the weight of this asset should probably be higher than the weight of other assets, due to its importance in keeping the information system secure). This mechanism will allow to define distinct levels of severity for each metric according to its importance to the overall vulnerability/threat of the information system.
This graph representation is inspired in Pulso’s QoS calculation model [7], and the graph structure used here is mainly imported from that model. Even though, it is not a request from PT (Portugal Telecom), which proposed the thesis theme, it is our understanding that the similarity among the two models it is natural and desirable. On one hand it is well suited to our calculation needs, and on the other hand it will be beneficial for PT since it will allow reusing some pieces already in place, and will also facilitate model understanding for non-technical people which is already familiarized with the QoS model.
Notwithstanding we do not present (in the context of this work) an implementation of our model, it is our understanding that even if the model has to be developed from scratch, it will be a straight forward process. Thus any organization besides PT can take advantage of it with little effort.
3.4
Threshold Definition
In order to extract some meaning and order from each metric and to avoid that metrics with higher nominal space of results to have, just because of that fact, a superior weight; it is important that all metrics are transformed in a common set of categories independently of their different natural space of results. For
instance if we are measuring the number of firewall blocked connections, what does means a value of 1500? Is it high or is it low? And how do we mix it with a metric with a different space of results like, for instance, the percentage of spam in received mail. If we do not adjust the scales it will be like comparing apples with oranges. Therefore, to simplify model computations, each and every metric must be converted to a common scale. In our universe, one possible approach is to define a set of categories which will define a level of impact in terms of security. For instance we can define a Likert scale with the following five categories:
• 0 - no security impact;
• 1 - minimal security impact;
• 2 - medium security impact;
• 3 - high security impact;
• 4 - top security impact.
Then each metric’s value must be converted to 0, 1, 2, 3 or 4 according to the impact it will have in terms of vulnerability/threat.
This process raises, however, another question: how to convert metrics’ values to one of these categories? It is our understanding that several methods can be applied, and different metrics may employ different methods, depending on the metric characteristics (space of results, dispersion, sample size, etc). One method may be more adequate than other. We can devise four main methods to achieve this goal:
1. Causation
Causation can be used if we know, supported by evidence, that a certain value of the metric will cause a certain effect; i.e., that the same value of the metric will cause always the same impact. In security field, this method seems hard to apply since things are not completely black or white and usually depends of the conjugation of several factors.
2. Expert knowledge
This method is based on the empirical knowledge of individuals that worked on the area, which is being object of study, for a long period of time. These individuals, by experience, know that when a metric reaches a certain value probably an impact of certain level will happen. Combining the knowledge of a high number of experts will certainly improve classification quality.
3. Statistical analysis
If we have samples that are representative of all metrics’ values and that are big enough we can ap-ply statistical analysis to that sample, in order to help us determining which values belong to which category. The rational behind this method is that an attack has a high impact only if the organization is not prepared to deal with that attack. Also an organization to survive has to be well adapted to the conditions of the environment where it belongs, so it is expectable that an organization is prepared to deal with the usual attack level in its environment, i.e., it has an adequate number of resources to face it. Therefore if we can extract from our sample which is the usual attack level we can state that every thing above will represent a high impact and every thing bellow will represent a low impact.
4. Comparing with a normal pattern
If we have access, for instance, to a public reliable source, and if we can extract a definition of what is normal then we can use this data to help setting the categories of a metric.
3.5
Weight Definition
As stated before, different metrics will have different relevance in defining a global index, so our model addresses this issue by assigning a weight to each metric; this weight defines the relative importance of a metric in relation to its brothers (see Figure 3.2).
In the first stages of model implementation, it is unlikely that one have enough information correlating se-curity incidents and metrics, in order, to allow us defining accurate weights for each metric or even for each metric’s group. So as a first approach one will have to rely on experts’ opinion to obtain weights. Also, hardly one will find two experts that assign exactly the same weights to the same metric, but this is an insuperable constrain. Therefore the best way to improve the quality of weights (in the first stages) is to increase number of inquired experts and combine their opinions.
One can also perform sensitivity analysis to determine the influence each metric and its respective weight have in the overall index, in order to adjust weights accordingly.
When the model is in production for some time and some experience and causation information exists, then the weights can be fine tuned in order to improve the model results.
Assetn1 Vulnerability index Component1 Vulnerability index Component2 Vulnerability index Componentn2 Vulnerability index weight Comp1 weight Comp2 weight Compm1 Group1 index Groupn3 index Group2 index weight Grp1 weight Grp2 weight Grpm2 Metric1 Metric2 Metricn4 weight Mtr1 weight Mtr2 weight Mtrm3
Figure 3.2: Graph Weights
3.6
Vulnerability Index Calculation
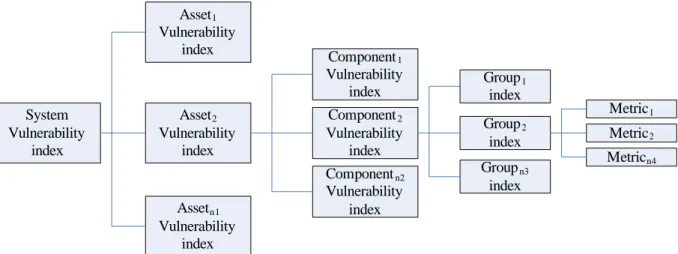
Figure 3.3 represents the vulnerability branch of our model, the tree has four levels representing: assets (e.g., web server, database server), components (e.g., database management system, operating system), security groups (patching, access control), and base metrics.
The leaves of our tree have the base metrics (in some particular cases, we can have sub-metrics, but they will end up producing a metric, so for sake of simplicity, we will not consider them here) collected from the components of each asset. Each metric is computed in order to match an interval threshold.
These metrics are organized in groups, each representing some aspect related to security (e.g., patching, or access control); for each group, we will compute an index based on the weights and thresholds of its leaves.
System Vulnerability index Asset1 Vulnerability index Asset2 Vulnerability index Assetn1 Vulnerability index Component1 Vulnerability index Component2 Vulnerability index Componentn2 Vulnerability index Group1 index Groupn3 index Group2 index Metric1 Metric2 Metricn4
Figure 3.3: Vulnerability Branch Graph
The calculation of vulnerability index is based on the idea that each metric will contribute with its share to the overall vulnerability of the information system. Thus to calculate the parent node index, we use a weighted mean of its child nodes.
index (P arent) =
n
X
i=1
(weight (Childi) × index (Childi)) n
X
i=1
weight (Childi)
, (3.1)
where n is the number of child nodes, and weight is the function that gives the weight value of Childinode.
3.7
Threat Index
Our first approach to define threat index was to calculate it in a similar way as the vulnerability index, i.e., using a bottom up method, calculating a threat index for each system component and use the obtained values to calculate the asset threat index and do likewise for the upper level indexes. However the data that allow us to define the threat index is usually produced to fulfil macroscopic level necessities. Therefore the task of defining the threat index tends to follow a top down approach. Thus, we have a set of metrics collected at the organization level that will be shared by all organization systems. Depending on the availability of data, some metrics may be collected at a lower level, e.g., at data centre level where typically systems share the same perimeter defences, so the same metric’s values will be assign to systems sharing the same defences. This means in practice that the same threat index will be shared by several systems.
One can argue that this approach it is not correct, because different system characteristics like sensitivity of stored information, may pose different threats to information systems, for instance, a system with confidential information about a new product will be more interesting to an attacker than a system with public data, and this way the first will face a higher threat. We agree with this argument and our model is prepared to deal with that, since new metrics can be added. Therefore the index specialization will depend only of the ability to collect more specialized metrics. In the context of this work and as a first approach, it is our understanding
that it is a reasonable assumption to say that systems that share a common location and a common set of defences will share an identical level of threat, and thus define a broader index that will be shared by several systems.
The Figure 3.4 represents the threat branch of our model. In this case, the tree has only three levels repre-senting: level at which the metric was collected (e.g., organization, data centre, room, system), threat groups (e.g., spam, viruses, incidents), and base metrics.
The weighted mean method will, also be used, to calculate the threat index, once it is our understanding that the overall threat will be influenced by each one of the identified threats. So to calculate each index we will use Equation (3.1), described above.
Threat index Level1 Threat Index Level2 Threat Index Leveln1 Threat Index Group1 index Groupn2 index Group2 index Metric1 Metric2 Metricn3
Figure 3.4: Threat Branch Graph
3.8
Risk Index Calculation
The risk index will be a simple product between vulnerability index and threat index, both contributing in equal parts for final outcome. Since threat and vulnerability indexes will have values between 0 and 4, the risk index will have values between 0 and 16, where 0 means that the system has no risk at all (either because it has no vulnerabilities or because it is not exposed to any threat), and 16 means top risk (because it is exposed to the maximum threat level and it is extremely vulnerable).
Chapter 4
Metrics
In this chapter, we will propose a set of metrics that we consider to have high importance in defining the level of vulnerability/threat an information system possesses. The list of metrics presented do not intend to be exhaustive nor suitable to all systems, since as stated before that would be an impossible mission in the context of this work. Such a complete set of metrics requires deeper analysis of the system by organization security experts of several areas of knowledge (networking, software, hardware, etc), and may not be the same for all kinds of system, for instance, Windows systems may have different metrics than Unix systems. Also new architectures, assets, components and even attacks will appear from time to time, and these events will force the definition of new metrics to improve index accuracy and completeness. Certainly due to the spread use of identical architectures, the presented metrics will be suitable, at least, as a first QoP approach for most information systems.
In this chapter we will consider two main distinct groups of metrics, the ones that will contribute to vulnera-bility index and, the ones that will contribute to threat index.
Each metric will be expressed in one of the following forms:
• # – “number of”, which will give us absolute values of some measured element;
• % – “percentage of”, which will give us the percentage of a measured element related to the total number of elements;
• avg – “average of”, which will give us the mean value of a set of measured elements;
• boolean value.
Some times a metric may be available in more than one form, in such situation, only the one that come to be consider most accurate in each case, should be used.
4.1
Vulnerability Metrics
All security options must be ruled by a security policy, which should define what is secure, and which levels of security should be achieved. Therefore, the base set of metrics must contain (but do not need to be limited to it) those that allow identifying gaps between security policy and the information system implementation.
Component
Group Metric Operating
System App. Server and Web Server DBMS Bussiness Applications
Patching security patches not installed √ √ √ √
time taken to install security patches √ √ √ √
Access weak/default passwords √ √ √ √
Control accounts with unchanged passwords for more than n days √ √ √ √
security misconfigurations detected √ √ √ √
users with dangerous privileges √ √ √ √
Anti-virus anti-virus installed? √
days old of signatures file √
virus detected √
Known open ports √
Vulnerabilities open ports in top 10 list √
vulnerabilities detected from vulnerability scan √ √ √ √
unneeded software installed √ √ √ √
Code Quality LoC (lines of code) √
Table 4.1: Components, Groups and Metrics
Each kind of asset can have differents components, i.e., each asset will have only a subset of the components here presented. For instance, in a three tier architecture, usually the DBMS (Database Management System) and the Application Server are installed in different assets, but it is also possible to have them sharing the same asset.
Similarely each component may not embody all groups of metrics, also some metrics (in spite of being defined in one group) may not make sense depending on the combination of component and group. For instance, not all metrics, defined for operating system known vulnerabilities group, will make sense in the context of DBMS known vulnerabilities, like for instance, open ports. Even though, a database can have several listeners, its cardinality will not be very informative and at least in a first approach to security metrics it should not be considered.
Therefore, in this section, first we will present the kind of components usually found in information systems’ assets and their usual weak points. Then we will present the metrics we considered in this work, grouped by security affinity. Table 4.1 summarizes, which metrics belong to wich groups, and which groups belong to which component.
In addition, it is worth noting that some metrics will not be easy to gather, and some of them probably will be impossible during the present work, therefore, albeit we refer them in this chapter not all of them will be part of our practical work.
4.1.1
Components
4.1.1.1 Operating System
It is well known that most of the attacks perpetrated against information systems take advantages of weak-nesses in operating systems. It is also well known that weakweak-nesses in some operating systems are more prone to be discovered than in others, either because less care was taken in their development and testing
process, or because they are widely deployed and exposed to a larger scrutiny. In addition, the access control mechanisms (password strength, user privileges, access control lists, etc) and their configuration represent an important role in systems security. Therefore, when we talk about security metrics, this component is of central importance to identify the vulnerability index of the system. We have identified four groups of me-trics (patching, access control, anti-virus, and known vulnerabilities), which we believe are good indicators of operating system level of vulnerability.
4.1.1.2 Database Management System
Nowadays almost every information system is composed by a DBMS, which plays a role of major importance since it is the repository of the data, which is often the target of the attacks. Besides code vulnerabilities which is common to every piece of software in information systems, DBMS are also subject to sql injection attacks (ranked 2 in [8]), weak passwords, accounts with excessive privileges, improper access control, among others. In this work we focused on three groups of metrics (patching, access control, and known vulnerabilities).
4.1.1.3 Application Server and Web Server
Application servers and web servers play a central role in the widely deployed multi-tier layer architectures, so they are unavoidable when we think about information system security. In [8] we can find several examples of vulnerabilities respecting this type of system assets. These are the components, which usually are in direct contact with the “outside world”, this way authentication and authorization mechanisms, and patching are essential to guarantee a good level of security.
4.1.1.4 Business Applications
Like any other piece of software, business applications that compose the system are subject to bugs and vulnerabilities, either when developed in-house or by third parties. The relation between number of code lines and bugs of an application has been long studied and results show that rigorous quality assurance may reduce in approximately ten times the number of bugs and consequently the number of security vulnerabilities. Thus, besides the three groups used in prior components, we also consider code quality an important group, in this component.
4.1.2
Groups
4.1.2.1 Patching
As stated in [2], “patching is an essential part of keeping systems up-to-date and in a known state. In other words, it is part of an overall portfolio of security controls. The degree to which an organization keeps its infrastructure up to patch indicates the effectiveness of its overall security program. It is likely that organizations that do not patch their systems have highly variable system configurations that render other security controls ineffective.”
Even though, is not wise patching a system as soon as a patch is released, and prior to validate its full impact in the system, it is even less wise do not patch the system or take to long to apply a patch. Patching metrics
can give us information about the sanity of a system and the care taken with its management. Bad patching performances are an indicator of a less secure system.
For this group we considered the following metrics:
• security patches not installed;
• time taken to install security patches.
The first metric, will count the number of operating system missing patches, and the second will measure the time a patch took to be installed. Thus, this group of metrics will give us some insight about how careful it is the system managed in relation to security issues. If a high number of security patches are missing and patch installation takes too long then, with high probability, the system management is not very aware of security issues and the system will tend to be an insecure system.
4.1.2.2 Access Control
Access control plays a fundamental role in keeping information systems secure. It sets who has access to the system, to which objects, and with which privileges. To avoid improper appropriation of information, or system damage the establishment of secure credentials, setting correct access rights and privileges, and the enforcement of security policies are essential tasks to keep systems secure. As stated in [9], “Access control policies and their enforcement mechanisms address two specific threats. The first is a legitimate user who is trying to gain access to information he is not supposed to have or perform functions he’s not authorized for. The second threat is a hacker who has broken into a legitimate user’s account.”
For this group we have considered four metrics:
• weak/default passwords;
• accounts with unchanged passwords for more than n days;
• security misconfigurations detected;
• users with dangerous privileges.
The first two metrics of this group, like in previous group, will give us some insights about system manage-ment positioning with regard to security. If security policy is enforced in a system then outdated passwords will not be found in the system. Moreover, the number of easily guessable passwords will be near to zero. Besides, this two metrics will also give us some insights about users positioning with regard to security, be-cause, even if the policy is not enforced, the user may proactively change is passwords in a regular way and define secure ones.
The third metric, measures the number of users with access to an object that it should not have access, because that object is not needed for him to execute its work. The fourth metric, counts the number of users with excessive privileges, i.e., the number of users having privileges usually attributed only to “super-user” accounts. Due to business needs, time-to-market pressure, lack of proper tools or their incorrect use, process flaws, among other reasons, often, privileges and access grants have to be set in an had-hoc way, and some times their revocation is forgotten when they are no longer need [10]. Thus, it is highly probable that some of these events appear even in a system with a tight management. Nevertheless, high numbers in these metrics are strong indicators of a sloppy management, or an unstable system, which configures a vulnerable system.
4.1.2.3 Known Vulnerabilities
This set of metrics addresses issues related to well known sources of vulnerabilities. It will give us indication about cleanse quality of the system. A system that is not free of impurities and have, for instance, more open ports, or more software pieces that it needs to perform its function is a system that increases its vulnerability index, since it opens unnecessary doors which can be maliciously exploited.
For this group we considered the following metrics:
• open ports;
• open ports in top 10 list;
• vulnerabilities detected from vulnerability scan;
• unneeded software installed.
The first two metrics are the most elementary ones; since a port is a point of entrance of possible attacks then the probability of a successful attack increases for each open port. If the open ports are the ones that are most attacked, then the probability of a successful attack his even higher. Attackers use automatic software to identify system vulnerabilities and will prepare their attacks based on the information supplied by that kind of software, therefore the number of vulnerabilities report by vulnerability scanners are good indicators of security, even though, they can be prone to false positives. Also unneeded software, i.e., software installed but that it is not necessary for system to perform its functions, is an unnecessary source of vulnerabilities. But, even though, this is an interesting metric it is highly dependent of the server functions and will be hard to collect automatically, also it will have slight variations from one period to another (after a sanitization process it will probably produce values that will be classified as no security impact category) so instead of being part of a metric system it probably should be part of a regular systems’ audit and consequent sanitization.
4.1.2.4 Anti-virus
This group will help us to understand how vulnerable a system is to viruses’ attacks. In [9], Thomas Pa-renty states “Viruses are probably the most visible information security problem computer users experience personally. Spreading quickly and quietly, they can cripple a company’s email, corrupt or delete important computer files, or halt worker productivity until they’re eliminated.”To make matter worst, it’s almost im-possible to keep viruses one hundred percent apart from organization assets. Nevertheless, some measures may be deployed to mitigate the number of successful viruses’ attacks and their impact. Therefore, the need to know the degree of vulnerability that a system has in relation to virus is not at all negligible.
For this group we have identified three metrics:
• anti-virus installed?;
• days old of signatures file;
The first two metrics will give base information about anti-virus policy implementation while the third will help to understand the effectiveness of the countermeasures installed.
A more exact way to identify how outdated is a signature file, would be verifying how many signature files have been released after the one installed. But that metric is harder to obtain because it forces us gathering and comparing data from two sources, therefore, since anti-virus companies release new signatures on an almost daily basis, counting the days since the signatura file was installed will give us an identical value with less effort.
4.1.2.5 Code Quality
Vulnerabilities in code can exist either unintentionally, or intentionally (in some specific cases), both re-presenting exploitability opportunities. Code quality can be improved by adopting development techniques having security in mind. Therefore, metrics that evaluate code quality are needed when defining a vulnerabi-lity index.
In the present work, we just define a metric in this group:
• LoC (Lines of Code).
It is known that faults tend to occur at a specific rate per LoC, even though, this is not an exact measure, it can be an indicator of the level of vulnerability in the used software. With enough information the rate can be improved. Also, different rates can be established depending on the way software was developed, i.e., if it is a wide spread commercial product, or a tailored product; if it was developed in house, or in an outsource company, etc.
4.2
Threat Metrics
This section intends to specify a set of metrics that can be used to calculate threat index, we will present several groups of metrics each related to different threat’s mechanisms. This metrics mainly try to identify what is the level of attack, perimeter defenses are subject to, if this metrics show a low attack level then we can infer that internal systems have a low threat index. Some of the presented metrics are already being col-lected and stored by PT. Therefore, unlike what happens in vulnerability metrics, some historical information already exists, we will analyse and use it to help us defining a normal pattern, and based on it set the threshold intervals of our model. Other metrics are product of our research work and we believe they will enrich the index’s quality.
4.2.1
SPAM
SPAM is a growing threat, it is responsible, not only, for network bandwidth misuse, but is also frequently used to send phishing messages. Therefore the level of SPAM is an indicator of the overall threat level that information systems face.
This metrics’ group intends to give insights about SPAM activity, even though, that its detectors are subject to false positive and false negatives; these are still being useful metrics once they can help to infere the malicious activity level.
For this group we considered the following metrics:
• messages received;
• spam detected by filtering mechanisms;
• spam detected in accepted mail.
The first metric gives us the number of mail messages classified as SPAM by anti-spam system; the second represents the number of messages that have not been classified as SPAM by anti-spam system, but subse-quently came to be classified as SPAM by other mechanisms (e.g., users).
4.2.2
Virus
Nowadays virus are one of the most prevalent threats to information systems. No organization can live without an anti-virus systems to keep their systems free (as much as possible) of this scourge. The amount of virus detected is an indicator of the level of malicious activity in progress. For this group we have considered two metrics:
• virus detected in servers;
• virus detected in desktops.
In our study, the first is the most representative, since the systems we want to evaluate are hosted in servers, but the latter is also important because of the risk of contagion it represents.
4.2.3
Web Filtering
Web filtering is used to prevent users of corporate networks, accessing sites that are known to pose security risks. Access to these sites may result in computer infection and subsequent propagation to other organiza-tion’s computers. Information collected from this source it is an indicator of users awareness level (or risk behavior). For this group we considered the following metrics:
• permitted accesses;
• blocked accesses.
A low level of blocked accesses shows a tendency to adopt secure behaviors, and consequently a low level of threat through this channel, while a high level of blocked accesses show a tendency for risk behavior and increases threat level.
4.2.4
Firewall
It is one of the today’s most used mechanisms of defence, against information security attacks, in organi-zations. Firewalls are the first line of defence against external threats, usually the access to any system is protected at least for one FW (Firewall). It can provide useful information about the level of attack an orga-nization or system is subject to. For this group we intend to collect two metrics (both split in two sub-metrics representing internal and external connections):
• permitted connections;
• blocked connections.
Blocked connections can be either mistakes or intentional attacks, both of them representing a threat for information systems. The specialization in internal, or external will be based on origin IP ranges.
4.2.5
Security Incidents
4.2.5.1 Reported by IDS
IDSs (Intrusion Detection Systems) are another essential tool in building a perimeter defense of information systems. These tools intend to detect and deter possible intrusion attempts. Is therefore important to collect metrics from these equipments in order to improve the acuracy of infromation systems risk index. During this work, it has not been possible to collect data directly from IDSs (similarily to what was done to the FWs) but we were able to fill this gap by collecting data from service desk system, which records the incidents reported by IDSs and later confirmed by security teams, these metrics’ values already have false positives stripped out, and are classified in terms of impact caused. Therefore, we were able to split the metric in four sub-metrics according to their impact:
• Incidents Impact=Top;
• Incidents Impact=High;
• Incidents Impact=Low;
• Incidents Impact=Unknown.
The number of incidents actually occurred is a measure of the (in)success of the attacks perpetrated against the organization’s information systems; it will give information about the threat effective ability, to cause damage. These metrics intend to measure, that ability.
4.2.5.2 Reported by Users
This group is identical to the previous one but it is based on information reported by users instead of IDS information. The incidents are also classified in terms of caused impact, even though, they don’t share the same classification model. For this group we have the following sub-metrics:
• Impact=Critical;
• Impact=Intermediate;
Chapter 5
Experimental Work
In order to validate the practical applicability of our work, we have done some experimental/exploratory work. To accomplish it, we selected an information system from PT and gathered data that could be used to “feed” our vulnerability metrics, and data related to threat metrics. The aim is to verify if it is indeed possible to gather and compute the available information in order to get the intended metrics. In this chapter, we will describe the process of data collection and metric calculation. The difficulties found to define weights and thresholds of each metric are also discussed. To define the QoP of an information system, first of all, one needs to deeply know it. Thus, the first step in defining the security risk of a system is, wherefore, to make a system assessment in order to identify which assets compound it, i.e., how many servers are part of the system, which operating systems and which software these equipments run, which defences (firewalls, intrusion detection systems, anti-virus) are in place to protect the system.
5.1
System Assessment
The system selected to this experimental work is a usual 3-tier architecture system. Figure5.1 presents a simplified version of system architecture (due to confidenciality obligations names have been changed). The system main assets are:
PTWEB001 and PTWEB002 use a load balancing mechanism. They are identical systems with respect to hardware, software, and configuration. Thus we will only present information about their components and metrics’ values once, since they will be equal for both. The main components of the system are:
• Windows 2003 SP2;
• IIS (Internet Information Server): Common Files;
FTP Server;
PTFW BE01 PTFW FE01 PTFWEX T01 PTDB 002 PTAP P01 PTDB 001 Presentation Tier Logic Tier Data Tier PTW EB00 1 PTW EB00 2
Figure 5.1: System Architecture
World Wide Web Server;
• Cluster Service.
PTAPP001 is a single system with no redundance
• Windows 2003 SP2;
• Application Server: Enable Network COM+ Access;
• IIS:
Common Files; FTP Server;
Internet Information Services Manager; SMTP Service;
Active Server Pages; Internet Data Connector.
PTDB001 and PTDB002 form a failover cluster with load balancing. They are identical systems with respect to hardware, software, and configuration. The cluster is used to serve several databases, each database instance will be running in one node at a time, if a node fails the other will run instances from both nodes. Thus we will only present information about their components and metrics’ values for the one that is running the database instance by the time we collected the metrics. Their main components are:
• HP-UX 11.31 B;
• ORACLE 9.2.0.8.0.
5.2
Security Policy – Summary of Relevant Rules
The base set of metrics should contain those that allow to identify gaps between security policy and informa-tion systems implementainforma-tion, as we stated in Secinforma-tion 4.1. We present here a summary of the PT policy rules that we are going to use to help us defining the weights and thresholds of the metrics.
Security policy defines strong passwords as the ones that have lower and upper case letters, digits, and special characters. Strong passwords should have at least a length of eight characteres if they belong to normal users, or twelve if they belong to privileged users. They must not have dictionary words, personal information or the user name. It also defines that password should be changed at least each 90 days.
Security policy do not define deadlines for patching installation. It just states that patches released by manu-facturers should be properly applied, especially the patches related to security, with the exception of causing system malfunction. Testing and fall-back procedures must also be implemented.
5.3
Vulnerability Index – Collected Metrics
In the scope of this work, would be impossible, to cover all security aspects related to information systems. Thus, we decide to cover the elementary security groups, which we consider as being good indicators of systems’ security, and sanity, namely: access control, patching, anti-virus, and exposure to known vulne-rabilities. We also decided to cover three of the most relevant components of information systems today: operating system, web/application server, and database management system.
Table 5.1 shows the components and groups defined for each asset of the information system and their res-pective weights. In Section 5.4 we will explain the criteria used in weight definition.
Unfortunately we could not gather data to fulfill all intended metrics, therefore, when a metric’s value appears with N/A (Not Available) it means, that we had planned to include that metric in our work but it was not possible to obtain data or process/compute it in time to be used in this work.
Asset Component Group
Name Weight Name Weight Name Weight
PTWEB001 & PTWEB002 1 Operating System 2 Patching 1
Access Control 1
Anti-virus 1
Known Vulnerabilities 1
Web Servers 1 Patching 1
Access Control 1 Known Vulnerabilities 1
PTAPP001 1 Operating System 2 Patching 1
Access Control 1
Anti-virus 1
Known Vulnerabilities 1
Application Server 1 Patching 1
Access Control 1 Known Vulnerabilities 1
Bussiness Applications 1 Patching 1
Access Control 1 Known Vulnerabilities 1
PTDB001 & PTDB002 2 Operating System 2 Patching 1
Access Control 1 Known Vulnerabilities 1
DBMS 1 Patching 1
Access Control 1 Known Vulnerabilities 1
Table 5.1: Assets, Components and Groups – Weights
In the subsections bellow we present the collected metrics, for each group, in each asset, and we will describe the processes used to collect those metrics, identifying the used sources, and also describing the extraction, processing and computation procedures applied.
The tables presented in this section already have columns whose values will only be explained in subsequent sections, but in order to keep all process more readable, we decided to present all information at once.
5.3.1
Presentation Tier
The presentation tier is composed by PTWEB001 and PTWEB002, as can be seen in Figure 5.1. Since as we stated before both assets are equal (hardware, software, and configuration) we will present the set of metrics and their values just once.
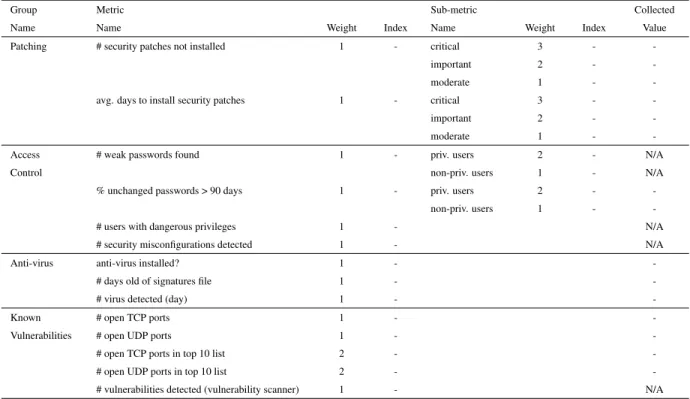
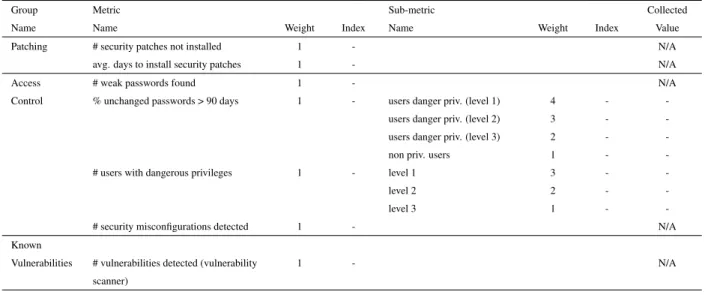
5.3.1.1 Operating System
Patching to compute the patching metrics shown in Table 5.2, we used two data sources:
• the information about installed patches in the systems, and their respective installation date. This set of data was provided to us by SA (System Administrator);
Group Name
Metric
Name Weight Index
Sub-metric
Name Weight Index
Collected Value
Patching # security patches not installed 1 - critical 3 -
-important 2 -
-moderate 1 -
-avg. days to install security patches 1 - critical 3 -
-important 2 -
-moderate 1 -
-Access # weak passwords found 1 - priv. users 2 -
-Control non-priv. users 1 -
-% unchanged passwords > 90 days 1 - priv. users 2 -
-non-priv. users 1 -
-# users with dangerous privileges 1 - N/A
# security misconfigurations detected 1 - N/A
Anti-virus anti-virus installed? 1 -
-# days old of signatures file 1 -
-# virus detected (day) 1 -
-Known # open TCP ports - iface frontend 1 -
-Vulnerabilities # open UDP ports - iface frontend 1 -
-# open TCP ports in top 10 list - iface frontend 2 -
-# open UDP ports in top 10 list - iface frontend 2 -
-# open TCP ports - iface backend 1 -
-# open UDP ports - iface backend 1 -
-# open TCP ports in top 10 list - iface backend 2 -
-# open UDP ports in top 10 list - iface backend 2 -
-# vulnerabilities detected (vulnerability scanner) 1 - N/A
Note: Confidential values removed from public version.
Table 5.2: Operating System Collected Metrics – Weights, Values, and Indexes (Presentation Tier)
The first gives us the effective state of the system, while the second gives a base to compare with how the system should be. Since, we received the information in a format that was not directly usable, we had to parse and extract the relevant information from the data sources, to accomplish it we developed Ruby [12] scripts, for which we constructed several regular expressions. Thereupon we uploaded the results into two MySQL [13] database tables that were then compared to extract the metrics’ values.
Microsoft classifies vulnerability as critical, important or moderate according to its security impact, thus we decided to split our metrics in sub-metrics accordingly, which will allow us to define different weights for each sub-metric.
Access Control the collected metrics related to access control, their respective values, weights and indexes are presented in Table 5.2.
The data used to compute passwords’ information was provided to us by SA. He extracted the SAM and sys-tem files (from %windir%\syssys-tem32\config) with the server offline. Since Windows do not natively provide a process to gather passwords’ age, SA used the free tool NetPWAge Net [14] to extract it.
To compute weak password metric, we started by extracting the hash information (from SAM and system files) using ophcrack [15] tool, then we used John the Ripper password cracker [16] to verify which passwords could be broken (since this is a windows system we could also have used ophcrack to do this task, but we decided to use the same password cracker for all assets, and ophcrack could not be used for HP-UX