Research Article
João M. F. Calado*, José Gomes Requeijo, António Abreu, and Ana Dias
Management of Innovation Ecosystems Based on
Six Sigma Business Scorecard
https://doi.org/10.1515/eng-2019-0007 Received Feb 28, 2018; accepted Sep 02, 2018
Abstract:In the present context, companies to be compet-itive must develop high-performance innovation capabili-ties that enable them to respond quickly to market needs. However, the lack of tools and methodologies to assess the performance of innovation projects in an integrated way remains an obstacle.
The paper begins by discussing the principles of Six Sigma and the Balanced Scorecard for performance evaluation. Next, the advantages of the Six Sigma Business Scorecard are discussed as a tool to support the evaluation of perfor-mance in innovation projects. Finally, the advantages of their application in the context of a collaborative ecosys-tem are discussed.
It is illustrated that the BSC ensures that top manage-ment pays attention at any time to the specific elemanage-ments of the Six Sigma implementation that are not working as planned, providing a link between strategy and quality initiatives assuring customers satisfaction in innovation projects.
Keywords: Six Sigma; Balanced Scorecard; Innovation; Collaborative Ecosystems
*Corresponding Author: João M. F. Calado:Departamento de Engenharia Mecânica do Instituto Superior de Engenharia de Lis-boa, 1959-007 LisLis-boa, Portugal; IDMEC/LAETA, Instituto Superior Técnico – Universidade de Lisboa; Email: [email protected] José Gomes Requeijo:UNIDEMI, Departamento de Engenharia Mecânica e Industrial, Faculdade de Ciências e Tecnologia, Univer-sidade Nova de Lisboa, 2829-516, Caparica, Portugal;
Email: [email protected]
António Abreu:Departamento de Engenharia Mecânica do Insti-tuto Superior de Engenharia de Lisboa, 1959-007 Lisboa, Portugal; CTS - Uninova – Instituto de Desenvolvimento de Novas Tecnolo-gias; Email: [email protected]
Ana Dias:Departamento de Engenharia Mecânica do Instituto Su-perior de Engenharia de Lisboa, 1959-007 Lisboa, Portugal; Email: [email protected]
1 Introduction
Human capital is considered by organizations as the most important asset, and its measurement is fundamental. There is a strong relationship between Human Capital Management, Knowledge Management, Intellectual Cap-ital Management and the Business Scorecard (BSC) learn-ing and growth perspective, specifically in the manage-ment of employee retention and workforce planning. The learning and growth perspective involves the changes and improvements to be made to achieve the mission and busi-ness vision. The maintenance and development of the know-how are fundamental to guarantee the necessary ef-ficiency and effectiveness to the processes, culminating in the creation of value for the clients and shareholders. In-cessant demand for new skills, especially a core compe-tence, should be stimulated. Thus, disinvestment in hu-man resources training can improve short-term financial performance, but in the long term this financial perfor-mance will be compromised as the organization lacks the capacity to build the infrastructure needed to support pro-cesses that seek the satisfaction of customers and share-holders.
Furthermore, the increase in the globalization of mar-kets, especially in the last decade, has brought about pro-found changes in the structure, organization and way of operating companies. The methods of work and manage-ment inherited from the past are less and less adapted to the turbulence of the modern world [1]. Companies to be competitive need to develop skills that enable them to respond quickly to market needs [2]. The HORIZON 2020 framework program stresses the ’Innovation Union’ as a strategy for growth and job promotion supported by a strategy of ’transferring new ideas to the market’ [3]. On the other hand, the development of new complex prod-ucts/services requires access to a distinct set of resources and competencies that companies often do not have [4– 6]. Thus, in order to ensure their level of competitive-ness, companies are confronted with the dilemma: to de-velop the skills and resources needed from their own as-sets, sometimes by making high investments, or alterna-tively, using the skills and resources that can be available
from other organizations in the context of a collaborative ecosystem [1, 2]. The perception of potential links and ab-sent links offers an overview of future relationships that might represent opportunities and threats. The ability to rapidly seek, choose, consolidate and reconfigure links is essential for companies bent on growth.
A collaborative ecosystem is understood as any coali-tion between a set of autonomous, geographically dis-tributed and heterogeneous entities (specialists and com-panies) from the operational point of view, who decide to establish cooperative relationships among them, as a pro-cess, to achieve common or compatible objectives more efficiently. The collaborative ecosystem perspective of or-ganizational innovation has gained popularity in recent years for investigating the nature of the innovation pro-cess, examining how and why innovations emerge, de-velop, grow and end. This perspective describes innova-tion as a complex process (not static), produced by inter-actions between structural influences and the inter-actions of individuals, which occur simultaneously. Thus, the collab-orative ecosystem view of innovation is the basis for many conceptual constructions, related to the innovative pro-cess, which considers the increase in complexity, the im-portance of knowledge sources external to the organiza-tion and the intra and inter-relaorganiza-tionships, fundamental for successful innovation. Innovation is increasingly charac-terised as an open process, in which many different actors - companies, customers, investors, universities, and other organisations - cooperate in complex ways. As species in a biological system, each member of a business collabora-tive ecosystem shares the fate of the network, as a whole, despite the soundness of a specific member. The strategy of a company should consider, therefore, the health of the entire ecosystem. A company that acts without under-standing the impact on the ecosystem, as a whole, is ignor-ing the reality of the collaborative networked environment in which it operates. The traditional linear model of inno-vation with clearly assigned roles for basic research at the university, and applied research in a company, is no longer relevant.
This paper aims to illustrate the role of the Six Sigma Scorecard approach in evaluating the performance of an innovation project. It begins by addressing the principles of the Six Sigma philosophy and the Balanced Scorecard. Next, it is discussed how the two methodologies can be associated as a management tool to improve the perfor-mance of innovation projects. Finally, it is discussed how this approach can be applied in evaluating the perfor-mance of innovation projects in the context of a collabora-tive ecosystem thus contributing to customer satisfaction and to the sustainability of organizations.
2 Six Sigma Background
Usually, organizations/companies define technical spec-ifications, by quality characteristic, in order to meet the implicit or explicit needs of future customers/consumers. These specifications, defined at the design stage of the products or services and their processes, are almost al-ways quantifiable on a continuous scale. Thus, it is possi-ble to define a procedure for collecting information (data) in each production process, analysing this data and char-acterizing the process. The meaning of the term “charac-terization of the process”, which is to be emphasized, has to do with the clear identification of the way in which it takes place, i.e., to know with high reliability that the val-ues of the characteristic under study have a certain aver-age value and a determined dispersion, as well as the type of distribution associated with such data. In order to de-fine and perform a suitable "process characterization", it is common to use a set of tools, such as flowcharts, data logging, control charts and histograms. The analysis of the capacity of the processes to suit their technical specifitions is traditionally done using the so-called process ca-pability indexes, such as the Cpindex and the Cpkindex.
Considering that the process for a certain quality char-acteristic follows a Normal distribution with mean µ and standard deviation σ, these indices are defined by:
Cp= USL− LSL 6σ Cpk= min(︀CpkL, CpkU )︀ (1) Cpk= min(︀CpkL, CpkU )︀ (2) CpkU= USL− µ 3σ and CpkL= µ− LSL 3σ (3)
Traditionally, for bilateral specifications, it is consid-ered that a process can produce according to its technical specification when the values of Cp and Cpk are greater
than 1.33. This value of 1.33 means that LSL (lower spec-ification limit) and USL (upper specspec-ification limit) are at least 4σ away from the average µ of the process. The sit-uation of the specification limits are 4σ apart from the average of the process is found in the ideal process con-dition, i.e., the process is centred with the specification (CpkI = CpkS). For a better understanding of this theme, it
is suggested, the consultation of Montgomery [8], Ryan [9], among others.
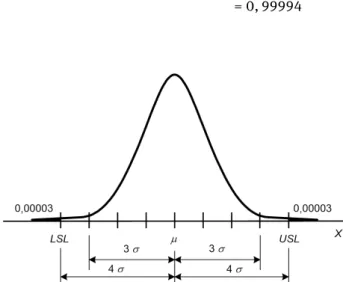
A process centred with Cpk= 1.33 produces 60
noncon-forming units in one million units produced. This value is calculated considering the location of specification limits (at 4σ distance from the mean µ), considering that the dis-tribution relative to the characteristic of the study quality
is normal. This situation is illustrated in Figure 1.
P (LSL ≤ X ≤ USL) = P (−4 ≤ Z ≤ 4) = 1 − 0, 00006
= 0, 99994
Figure 1:Non-conforming production for a process centred with Cpk = 1.33.
Whereas a complex product consists of 50 compo-nents and all compocompo-nents have Cpk = 1.33,
nonconform-ing production shall be equal to (0.99994)50= 0.9970. This means that the proportion of non-conforming production will be equal to 0.003, that is, the production of 3 noncon-forming units in 1000 units produced. Although this figure corresponds to the most favourable situation, even so, for certain products it may be considered unacceptable.
At the end of the 1980’s the methodology / philoso-phy known as Six Sigma was developed at Motorola. This methodology presents the limit value of 3.4 per million as an admissible value for non-compliant production. It iden-tifies “two states” in a productive process, the first called "short term" and the second “long term”. In the first, it is considered that the process is stable and produces items with mean µ and standard deviation σ. In the second, it is understood that unidentified variations can occur in the process when the process is in the “short-term” state and, therefore, it is assumed that the process average can range from ± 1.5σ.
Because of the above recitals, the quality level (sigma level) of a given process is expressed as a function of σ. In order to identify what level of quality a particular pro-cess presents, it is only nepro-cessary to determine the number of nonconforming units in one million units produced. In the Six Sigma philosophy, to make it more comprehensive, several metrics are used, such as: Defects Per Unit (DPU), Defects Per Opportunity (DPO) and Defects Per Million of Opportunities (DPMO). Those metrics are defined as
fol-lows:
DPU= Total number of defects
Number of verified units (4)
DPO= (5)
Total number of defects
Number of verified units × Number of defect opportunities
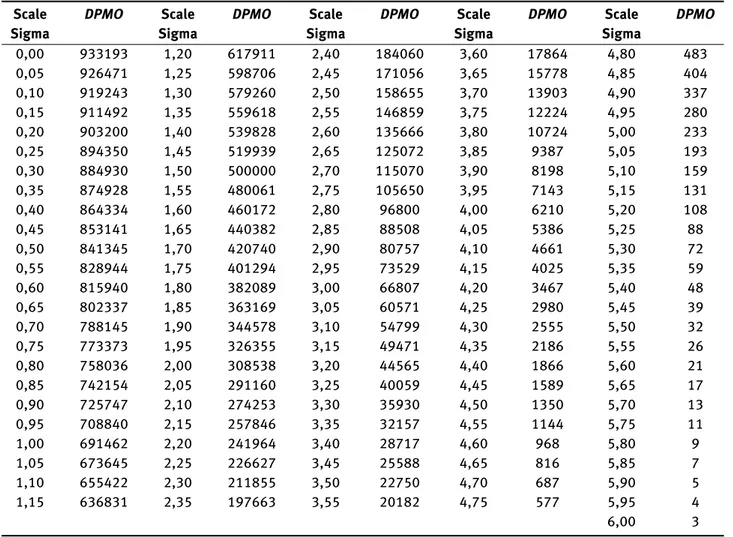
DPMO= DPO × 106 (6) Table 1 presents the values in the DPMO that allow to identify the quality level of a process (the perspec-tive assumed in this article considers the number of non-compliant units, with 1 DPMO = 1 nonconforming unit). For a better understanding of this theme, it is suggested, the consultation of Park [10], among others.
Overall, one of the goals of any company when imple-menting an innovation project is to ensure that the results initially defined were achieved without defects or failures,
i.e.customer-defined specifications were obtained, for ex-ample, specifications in terms of cost, time, quality and scope were met.
Assuming that defects can occur randomly and inde-pendently of each other, we may in these circumstances using the Poisson distribution, proceed to calculate the probability of occurrence of failures/defects in a given time interval, through the following equation:
P (x) = µ
x.e−µ
x! (7)
where: P(x) – stands for the probability of occurrence of defect(s)/failure(s) in the development of an innovation project; and, µ is the average number of defects / failures per innovation project.
Thus, in the context of innovation management, unity is defined as the innovation project. Then, the Defects Per Unit (DPU) metric is defined by:
DPU= Number of defects
Number of projects performed (8) Therefore, by making µ = DPU the probability that an innovation project is performed without any defect is given by:
P (0) = DPU0.e−DPU
0! = e
−DPU (9)
If we consider that any innovation project consists of a sequence of steps/phases of development, the probabil-ity of an innovation project passing through one of the se-quential steps/phases of the innovation process, without defects, is given by [11, 12]:
Table 1:Conversion table for the Sigma scale. Scale Sigma DPMO Scale Sigma DPMO Scale Sigma DPMO Scale Sigma DPMO Scale Sigma DPMO 0,00 933193 1,20 617911 2,40 184060 3,60 17864 4,80 483 0,05 926471 1,25 598706 2,45 171056 3,65 15778 4,85 404 0,10 919243 1,30 579260 2,50 158655 3,70 13903 4,90 337 0,15 911492 1,35 559618 2,55 146859 3,75 12224 4,95 280 0,20 903200 1,40 539828 2,60 135666 3,80 10724 5,00 233 0,25 894350 1,45 519939 2,65 125072 3,85 9387 5,05 193 0,30 884930 1,50 500000 2,70 115070 3,90 8198 5,10 159 0,35 874928 1,55 480061 2,75 105650 3,95 7143 5,15 131 0,40 864334 1,60 460172 2,80 96800 4,00 6210 5,20 108 0,45 853141 1,65 440382 2,85 88508 4,05 5386 5,25 88 0,50 841345 1,70 420740 2,90 80757 4,10 4661 5,30 72 0,55 828944 1,75 401294 2,95 73529 4,15 4025 5,35 59 0,60 815940 1,80 382089 3,00 66807 4,20 3467 5,40 48 0,65 802337 1,85 363169 3,05 60571 4,25 2980 5,45 39 0,70 788145 1,90 344578 3,10 54799 4,30 2555 5,50 32 0,75 773373 1,95 326355 3,15 49471 4,35 2186 5,55 26 0,80 758036 2,00 308538 3,20 44565 4,40 1866 5,60 21 0,85 742154 2,05 291160 3,25 40059 4,45 1589 5,65 17 0,90 725747 2,10 274253 3,30 35930 4,50 1350 5,70 13 0,95 708840 2,15 257846 3,35 32157 4,55 1144 5,75 11 1,00 691462 2,20 241964 3,40 28717 4,60 968 5,80 9 1,05 673645 2,25 226627 3,45 25588 4,65 816 5,85 7 1,10 655422 2,30 211855 3,50 22750 4,70 687 5,90 5 1,15 636831 2,35 197663 3,55 20182 4,75 577 5,95 4 6,00 3
Representing this probability by y, as the probability of an innovation project pass through the first step/phase of the innovation process without defects, we have:
y= e−DPU (11)
Thus, if it is known that the first step/phase of the in-novation process of the entire sequence of steps/phases defined in the innovation project is successful, that is, without defects, it is possible to determine the value of
DPUthrough of the following equation:
DPU= −ln (y) (12)
In global terms and from the macro viewpoint the sev-eral sequential steps/phases of an innovation are depicted in Figure 2.
Therefore, the probability of a given innovation project to exceed a set of k steps/phases without any de-fect in the set of steps/phases can be determined by:
YGlobal=
k
∏︁
n=1
yn (13)
Figure 2:Steps/Phases in a generic innovation project.
Hence, the DPU value for the entire innovation project (IP) can be determined by:
Thus, we have: DPUIP= −ln (YIP) = −ln (︃ k ∏︁ n=1 yn )︃ (15)
3 Balanced Scorecard
Nowadays, in an accelerated and highly competitive world, measurement is the first step that leads to control and eventually process improvement. If you do not mea-sure, you do not understand. If you do not understand it, you cannot control it and if you cannot control it, you will not be able to improve. Senior executives understand that their organization’s measurement system strongly af-fects the behaviour of managers and employees. Execu-tives also understand that traditional financial accounting measures like return on investment and earnings per share can give misleading signals for continuous improvement and innovation.
On the other hand, what we measure is not indiffer-ent, not neutral. What we measure reflects what we value and in that sense, is a powerful signal that is transmitted throughout the company. In this sense, the monitoring of the performance of processes based exclusively on finan-cial indicators has become insufficient.
The development of holistic management support tools that allow the evaluation and monitoring of company performance based on the defined strategy is an impera-tive of modern management. Developed by Robert Kaplan and David Norton [13], the Balanced Scorecard (BSC) is characterized as a structured model that not only comple-ments the traditional financial indicators but also relates the long-term strategy to short-term interventions. The BSC has emerged as a decision support approach at the strate-gic management level. Many business leaders now evalu-ate corporevalu-ate performance by supplementing financial ac-counting data with goal-related measures from the follow-ing perspectives: customer, internal business processes, learning and growth. It is argued that the BSC paradigm can be adapted to assist those managing business func-tions, organizational units and individual projects.
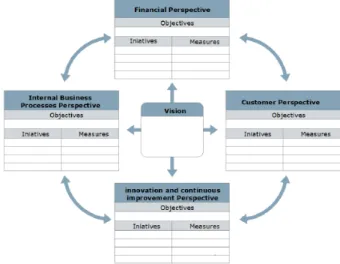
Thus, the BSC offers a dashboard of business manage-ment tools, supported by financial indicators that trans-late the results of actions and decisions taken, and in non-financial indicators on customer satisfaction, internal pro-cesses, innovation activities and continuous improvement of the processes, related to the critical success factors of the business, as shown in Figure 3.
Figure 3:BSC control panel.
According to the financial perspective, the indicators developed aim to answer the following question: - How are we viewed by stakeholders? From the perspective of customers, the indicators allow the company to answer the question - How are we seen by customers? From the perspective of internal processes, the indicators allow the company to answer the question - Where do we have to be excellent? From a perspective of innovation and continu-ous improvement, the indicators allow the company to an-swer the question - Where should we continue to improve and create value? Thus, the BSC serves as a dashboard, which allows the management has a comprehensive view of the company’s performance in the short and medium term. Thus, to put the BSC to work, companies should ar-ticulate goals for time, quality, and performance and ser-vice and then translate these goals into specific measures.
4 Six Sigma Business Scorecard
The Six Sigma philosophy is an evolution of total qual-ity theory, focusing on the abilqual-ity of organizations to gen-erate value and improve their productivity and competi-tiveness by eliminating numerous cost-generating activi-ties. The Six Sigma strategy is directly related to obtain-ing improvements in items such as cost reduction, pro-ductivity improvement, market share growth, customer re-tention, cycle time reduction, defect reduction, cultural change, product and service development, etc. Based on the Six Sigma philosophy and the BSC approach, Praveen Gupta proposed a Six Sigma Business Scorecard method-ology [12–14]. This approach aims to build a dashboard that allows management to monitor company
perfor-mance based on the dimensions of the Balanced Scorecard but through Six Sigma levels.
Based on this approach both the results of actions and decisions taken that are evaluated in financial terms, and the critical success factors of the business that are anal-ysed from a non-financial perspective, their performance is quantified through Six Sigma levels.
Thus, an indicator, called business performance in-dex, was developed as a measure of the overall perfor-mance of the system (IPS), which can range from a depart-ment to the company itself, and from this indicator deter-mine the corresponding Six Sigma level.
Thus, the determination of the sigma level comprises the following steps:
1. Definition of the indicators to be measured. 2. Definition of the weights Wnassign to each of the
indicators depending on the relative importance of each of them to the success of the objectives that have been defined. The sum of all weights must be equal to 100.
3. Measurement of the performance of each indicator; for each of the n indicators, performance is calcu-lated by the following ratio:
Pn= Performance achieved × 100
Performance predicted (16) 4. Determination of Partial Performance Indices (PPI) for each of the n indicators; these indices are deter-mined by the following equation:
PPIn= Wn.Pn
100 (17)
5. Determination of the System Overall Performance Index (SPI), using the following equation:
SPI=
10 ∑︁
n=1
PPIn (18)
6. Determination of the DPU by the following equa-tion: DPUGlobal= −ln (︂ SPI 100 )︂ (19) Determination of DPMO by the following equation:
DPMOPM=
DPUPM.106
Processes number (20)
7. By definition of the DPMO (see equations (5) and (6)) the denominator appears as the number of defect opportunities, i.e., the total number of possibilities for defects or errors. Thus, in an innovation project, from the point of view of operational management,
it is assumed that opportunities for defect are associ-ated with non-compliance with the initially defined specifications associated with each stage of the pro-cess.
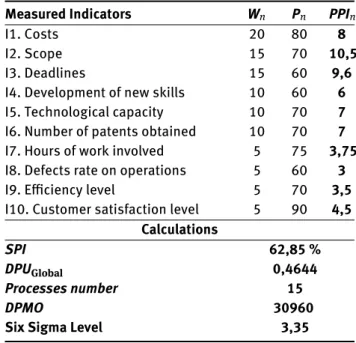
8. Determine the Six Sigma level through Table 1. In order to illustrate the sigma level associated with an innovation project, Table 2 shows the indicators that were used, as well as the values obtained in this hypothetical case.
Table 2:Determination of the Six Sigma level for a hypothetical case of an innovation project.
Measured Indicators Wn Pn PPIn
I1. Costs 20 80 8
I2. Scope 15 70 10,5
I3. Deadlines 15 60 9,6
I4. Development of new skills 10 60 6
I5. Technological capacity 10 70 7
I6. Number of patents obtained 10 70 7
I7. Hours of work involved 5 75 3,75
I8. Defects rate on operations 5 60 3
I9. Eflciency level 5 70 3,5
I10. Customer satisfaction level 5 90 4,5 Calculations
SPI 62,85 %
DPUGlobal 0,4644
Processes number 15
DPMO 30960
Six Sigma Level 3,35
The main difficulty is how to calculate each of the ten indicators mentioned above. Further research and devel-opment is required regarding how to collect and record the values without being intrusive in the company “life”. As a first approach, for instance, the assessment of each one might be determined based on the perception of the employees involved in the project or alternatively through tools, such as application of fuzzy logic [15], that allow in a more objective way to evaluate the differences between previously planned results and actual results.
On the other hand, if the purpose is to design a simu-lation model to support the decision-making process, then the values of these indicators will be parameters of the simulation process.
However, based on the values in Table 2, as well as the values obtained from the application of the equations pre-viously defined, we can verify that the closer the real val-ues are to the valval-ues initially established the value of Pn
is close to 100% and if all the indicators were 100% effi-cient, the DPUGlobalvalue of the project would be zero, to
which we would like to state that the innovation project in question had been perfect in all respects compared to the original objectives.
5 Increase Performance of
Innovation Processes Through
Cooperative Relationships
Given the arguments presented above, companies, in or-der to be competitive in increasingly demanding markets, should adopt strategies that allow them to provide high quality services to their customers. When a company in-tends to make new products / services available, the com-pany has two possible alternatives: to internally develop the necessary resources both at the level of management competencies and at the level of operational competencies in order to ensure a quality standard that is acceptable to the client and does not compromise its sustainability and survival in the market, or alternatively choose to carry out the innovation project in a collaborative context.
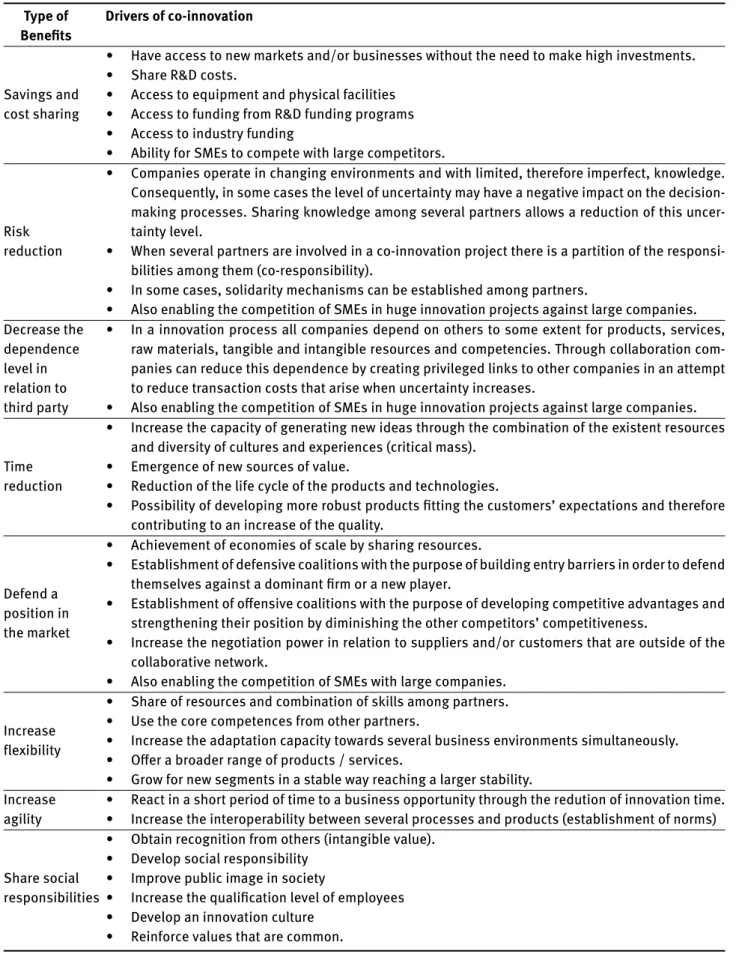
As frequently mentioned by several authors on Collab-orative Networks, as well as reports from a growing num-ber of practical case studies, when a company is a memnum-ber of a long-term networked structure (collaborative ecosys-tem), such as an industry cluster or industry district, there is the assumption that such involvement brings valuable (potential) benefits to the involved entities [16–20]. Ta-ble 3 shows, some examples of associated (intuitive) ad-vantages of co-innovation processes.
However, it is important to realize that, when a com-pany is a member of a collaborative ecosystem, its benefits are not only given by tangible assets – economic capital (e.g. cash, resources, and goods). The existence of coop-eration agreements, norms, reciprocal relationships, mu-tual trust, common infrastructures and common ontolo-gies, allows collaborative ecosystem members to operate more effectively in pursuit of their goals [21]. In fact, the ex-istence of a collaborative ecosystem structure enables the increase of knowledge circulation as well as the produc-tion of knowledge within the network. In other words, the network acts as a channel to transfer knowledge from one organization to another, and may become the locus of new knowledge creation, rather than within the organizations members of the network [22, 23].
In this context, the choice of the partners to carry out the necessary processes will depend on the identification
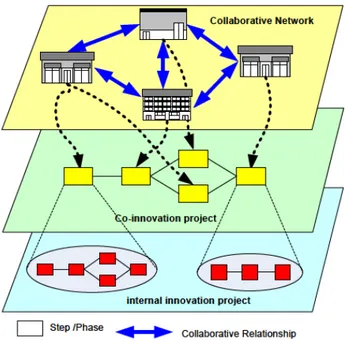
of the companies that present the highest levels of sigma performance for the set of processes assigned to them. Thus, if this principle is present in the process of creat-ing the collaborative network, companies will be able to increase their competitiveness in the face of competition and in the limit to ensure their own survival in a faster and less impacted way. Figure 4 illustrates from an operational point of view the sequence of steps/phases associated with the collaborative innovation project and the operations as-sociated with the internal innovation project carried out by one of the partners, in order to support the collaborative innovation project.
However, the success of this approach requires the de-velopment of a tool that supports the management activi-ties and the existence of mechanisms that act as incentives for collaboration and punish the infractors [24, 25]. Fur-thermore, the companies involved in a collaborative net-work must provide to the member coordinator, reliable in-formation in useful time during the execution of the main-tenance project; as well as, when was necessary to partic-ipate effectively in the recovery of delays.
Figure 4:Example of a collaborative network in an innovation project.
6 Potential Application
To illustrate the advantages of establishing collabora-tive networks to increase the success rate of innovation
Table 3:Example of some associated advantages to co-innovation. Type of Benefits Drivers of co-innovation Savings and cost sharing
• Have access to new markets and/or businesses without the need to make high investments. • Share R&D costs.
• Access to equipment and physical facilities • Access to funding from R&D funding programs • Access to industry funding
• Ability for SMEs to compete with large competitors.
Risk reduction
• Companies operate in changing environments and with limited, therefore imperfect, knowledge. Consequently, in some cases the level of uncertainty may have a negative impact on the decision-making processes. Sharing knowledge among several partners allows a reduction of this uncer-tainty level.
• When several partners are involved in a co-innovation project there is a partition of the responsi-bilities among them (co-responsibility).
• In some cases, solidarity mechanisms can be established among partners.
• Also enabling the competition of SMEs in huge innovation projects against large companies. Decrease the
dependence level in relation to third party
• In a innovation process all companies depend on others to some extent for products, services, raw materials, tangible and intangible resources and competencies. Through collaboration com-panies can reduce this dependence by creating privileged links to other comcom-panies in an attempt to reduce transaction costs that arise when uncertainty increases.
• Also enabling the competition of SMEs in huge innovation projects against large companies. Time
reduction
• Increase the capacity of generating new ideas through the combination of the existent resources and diversity of cultures and experiences (critical mass).
• Emergence of new sources of value.
• Reduction of the life cycle of the products and technologies.
• Possibility of developing more robust products fitting the customers’ expectations and therefore contributing to an increase of the quality.
Defend a position in the market
• Achievement of economies of scale by sharing resources.
• Establishment of defensive coalitions with the purpose of building entry barriers in order to defend themselves against a dominant firm or a new player.
• Establishment of offensive coalitions with the purpose of developing competitive advantages and strengthening their position by diminishing the other competitors’ competitiveness.
• Increase the negotiation power in relation to suppliers and/or customers that are outside of the collaborative network.
• Also enabling the competition of SMEs with large companies. Increase
flexibility
• Share of resources and combination of skills among partners. • Use the core competences from other partners.
• Increase the adaptation capacity towards several business environments simultaneously. • Offer a broader range of products / services.
• Grow for new segments in a stable way reaching a larger stability. Increase
agility
• React in a short period of time to a business opportunity through the redution of innovation time. • Increase the interoperability between several processes and products (establishment of norms) Share social
responsibilities
• Obtain recognition from others (intangible value). • Develop social responsibility
• Improve public image in society
• Increase the qualification level of employees • Develop an innovation culture
Table 4:Quality Level provided by each company.
Sigma Level Offered by Companies
Project Required Sigma Level Processes E1 E2 E3 E4
Proj. 1 5 P1- P5-P3 3 2.92 3.99 3.74
Proj. 2 5.5 P1- P2-P1 3.97 4.81 3.97 4.99
Proj. 3 5 P5- P2-P1 3.97 3 3.99 3.99
Proj. 4 4 P4- P1-P3 3 3.74 3.97 4
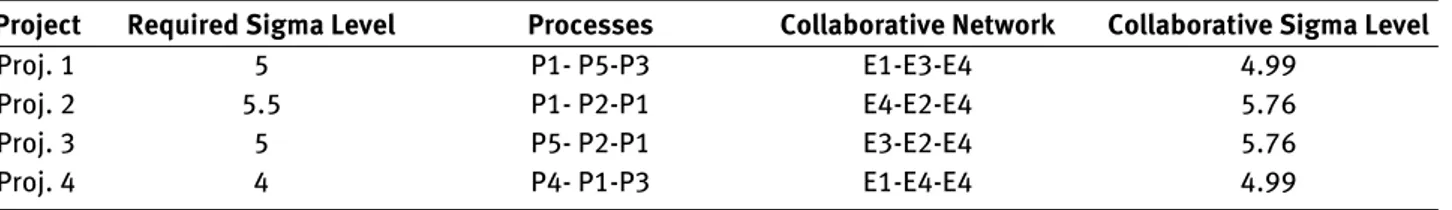
Table 5:Quality level of the cooperation process for the various innovation projects.
Project Required Sigma Level Processes Collaborative Network Collaborative Sigma Level
Proj. 1 5 P1- P5-P3 E1-E3-E4 4.99
Proj. 2 5.5 P1- P2-P1 E4-E2-E4 5.76
Proj. 3 5 P5- P2-P1 E3-E2-E4 5.76
Proj. 4 4 P4- P1-P3 E1-E4-E4 4.99
projects, let us consider a scenario inspired on Virtuelle Fabrik that is a real collaborative ecosystem in the metal-mechanic sector, located in Switzerland and Germany.
Let us consider a scenario where we have a collab-orative innovation ecosystem which contain four inde-pendent firms to accelerate innovation processes, as il-lustrated by Figure 5; they all have the intention to de-velop four innovative projects where it is necessary to ensure a certain level of quality according to the sigma level indicated, for the project to succeed, whether at the management level and operational level, thereby ensur-ing not only the level of competitiveness as well as the sustainability of the company. Please note that the pur-pose of this example is only to illustrate the potential of this approach. For reasons of simplification, the use of other processes would not be considered, which would also allow the expected results with the same character-istics/functionalities to be obtained.
Figure 5:Example of cooperation between several companies.
Figure 6 illustrates for the various companies the hy-pothetical sigma-level matrix for the steps / phases nec-essary to achieve each of the innovation projects based on the historical performance of organizations in similar projects.
Figure 6:Sigma level of the various steps/phases.
In this case, if there is no cooperation agreement be-tween the companies, only company E4 can carry out project 4 (Proj. 4) with the desired quality (level 4σ). For all other projects (Proj. 1, Proj. 2 and Proj. 3) none of the panies have the capacity to carry them out without com-promising the company’s sustainability, as shown in Ta-ble 4.
In the case of establishing a collaborative process be-tween the four companies, all innovation projects can be realized in accordance with the required quality and with-out any additional effort. Table 5 shows the level of qual-ity in the sigma scale that can be achieved for each of the
innovation projects, as well as the network elements in-volved in the projects in question.
7 Conclusions
Currently, there seems to be unanimity on the part of the various actors involved in the business world that, in order to survive, SMEs increasingly have to develop innovation strategies that allow them to move towards a greater ap-preciation of the products/services provided to their cus-tomers.
However, implementation of the strategies described in the previous sections, in many cases requires skills and investments for which companies typically are not pre-pared, as in the case of small and medium-sized enter-prises.
In this context, as an alternative, it was shown how, through dynamic cooperation networks, a company can significantly increase its level of competitiveness, at a re-duced cost and in a practically instantaneous time, which in turbulent socio-economic scenarios represents an addi-tional advantage in relation to tradiaddi-tional innovation pro-cesses.
It was shown that the BSC is a tool with great capac-ity to integrate and interact, in a logical and coherent way, with a set of other tools used by organizations, such as de Six Sigma approach. The use of the Six Sigma strat-egy with the BSC presupposes a process of continuous im-provement and, consequently, assists the process of eval-uating the performance through the identification of prob-lems, their causes and the actions to be carried out to solve them. The BSC was seen as an instrument to assess the degree of alignment of the organization with its strategic direction. The Six Sigma strategy worked as a way to op-erationalize the necessary improvements for this strategic alignment.
Furthermore, this paper illustrates that the BSC en-sures that top management pays attention at any time to the specific elements of the Six Sigma implementation that are not working as planned, providing a link between strategy and quality initiatives. Thus, the BSC provides a mechanism for top management to track success in imple-menting a Six Sigma process, and the opportunity to make changes considering the results achieved. It has been ob-served that the Six Sigma philosophy fits perfectly into the BSC’s internal perspective. Six Sigma has included finan-cial aspects (costs and profitability) in the quality manage-ment system, seeking to create value for the customer and the investor.
Acknowledgement: This work was partially
sup-ported by FCT, through IDMEC, under LAETA, project UID/EMS/50022/2019.
References
[1] Chesbrough Henry, Open Innovation: The New Imperative for Creating and Profiting from Technology. Harvard Business School Press, Boston, 2003.
[2] Tidd J., J. Bessant and K. Pavitt, Managing Innovation: Inte-grating Technological, Market and Organizational Change Hong Kong: John Wiley & Sons Ltd, 2005.
[3] http://ec.europa.eu/research/horizon2020/index_en.cfm (06/12/2017)
[4] Elmquist Maria, Fredberg Tobias and Ollila Susanne, Exploring the field of open innovation, European Journal of Innovation Management, 2009, 12 (3), 326-345.
[5] Chesbrough H., Open Services Innovation: Rethinking Your Business to Grow and Compete in a New Era, Jossey-Bass, 2010. [6] Abreu A. and Urze Paula, An Approach to Measure Knowledge Transfer in Open-Innovation. ICORES 2014 - 3rd International Conference on Operations Research and Enterprise Systems, Angers, France, 2014, 183-189.
[7] Requeijo José, Abreu A. and Matos Ana, Statistical Process Con-trol for a Limited Amount of Data – ICORES 2014 – 3rd Inter-national Conference on Operations Research and Enterprise, Angers, France, 2014,190-195.
[8] Montgomery Douglas C., Introduction to statistical quality con-trol. John Wiley & Sons, 2009.
[9] Ryan Thomas P., Statistical methods for quality improvement, John Wiley & Sons, 2011.
[10] Park S.H., Six Sigma for Quality and Productivity Promotion, Asian Productivity Organization (APO), The TQM Magazine, 2003, 16 (4), 241-249.
[11] Baas Issa, Six Sigma Statistics with Excel and Minitab, Mc-GrawHill, 2007.
[12] Gupta Praveen, Six sigma business scorecard. Perspectives on Performance, 10, 2004
[13] Kaplan Robert S. and David P. Norton, The strategy-focused or-ganization: How balanced scorecard companies thrive in the new business environment, Harvard Business Press, 2001. [14] Gupta Praveen, Six Sigma business scorecard, McGraw Hill
Pro-fessional, 2006.
[15] Abreu A. and Calado J. M. F., A fuzzy logic model to evaluate the lean level of an organization. International Journal of Artificial Intelligence and Applications (IJAIA), 2017, 8 (5), 59-75. [16] Rohrbeck René, Katharina Hölzle, and Hans Georg
Gemün-den, Opening up for competitive advantage– How Deutsche Telekom creates an open innovation ecosystem, R&D Manage-ment, 2009, 39 (4), 420-430.
[17] Traitler Helmut, Heribert J. Watzke and I. Sam Saguy, Reinvent-ing R&D in an open innovation ecosystem, Journal of food sci-ence, 2011, 76 (2), 62 -68.
[18] Chesbrough Henry, Wim Vanhaverbeke, and Joel West, (Eds), New frontiers in open innovation, Oxford University Press, 2014. [19] Gawer Annabelle and Michael A. Cusumano, Industry platforms and ecosystem innovation, Journal of Product Innovation
Man-agement, 2014, 31(3), 417-433.
[20] Urze Paula, and António Abreu, Innovation from Academia-Industry Symbiosis, In Risks and Resilience of Collaborative Networks, Springer International Publishing, 2015, 337-344. [21] Abreu A. and Camarinha-Matos L. M., An Approach to
Mea-sure Social Capital in Collaborative Networks, In IFIP Interna-tional Federation for Information Processing; Adaptation and Value Creating Collaborative Networks; Camarinha-Matos L. M., Alexandra Pereira-Klen, Hamideh Afsarmanesh (Eds.), Springer, 2011, 29–40.
[22] Urze Paula, and Abreu A., Circulation of knowledge in a co-innovation network: An assessment approach, In Collaborative Systems for Reindustrialization, Camarinha-Matos L. M. and Raimar J. Scherer (Eds.), Springer, 2013, 103-110.
[23] Urze Paula, and Abreu A., Mapping Patterns of Co-innovation Networks, In Working Conference on Virtual Enterprises, Springer International Publishing, 2016, 241-252.
[24] Tenera A. and Abreu, A., A TOC perspective to improve the management of collaborative networks, In Pervasive Collabora-tive Networks, Camarinha-Matos L. M. and Willy Picard (Eds.), Springer, 2008, 167–176.
[25] Camarinha-Matos, L.M., Macedo P. and Abreu, A., Analysis of core-values alignment in collaborative networks. In Pervasive Collaborative Networks; Camarinha-Matos L. M. and Willy Pi-card (Eds.), Springer, 2008, 53–64.