Human umbilical cord blood plasma as an
alternative to animal sera for mesenchymal
stromal cells in vitro expansion – A
multicomponent metabolomic analysis
A. R. CaseiroID1,2,3☯, G. Ivanova4☯, S. S. Pedrosa1,2, M. V. BranquinhoID1,2, P. Georgieva5,
P. P. Barbosa6, J. D. Santos3, R. Magalhães7, P. Teixeira7, T. Pereira ID1,2, A.
C. Maurı´cioID1,2*
1 Departamento de Clı´nicas Veterina´ rias, Instituto de Ciências Biome´dicas de Abel Salazar (ICBAS), Universidade do Porto (UP), Rua de Jorge Viterbo Ferreira, n˚ 228, Porto, Portugal, 2 Centro de Estudos de Ciência Animal (CECA), Instituto de Ciências, Tecnologias e Agroambiente da Universidade do Porto (ICETA), Rua D. Manuel II, Apartado 55142, Porto, Portugal, 3 REQUIMTE/LAQV–U. Porto–Porto/Portugal, Departamento de Engenharia Metalu´rgica e Materiais, Faculdade de Engenharia, Universidade do Porto, Rua Dr. Roberto Frias, s/n, Porto, Portugal, 4 REQUIMTE- LAQV, Departamento de Quı´mica e Bioquı´mica, Faculdade de Ciências, Universidade do Porto, Rua do Campo Alegre, Porto, Portugal, 5 Department of Electronics Telecommunications and Informatics, IEETA, University of Aveiro, Campus Universita´rio de Santiago, Aveiro, Portugal, 6 Biosckin, Molecular and Cell Therapies S.A., Laborato´ rio Criovida, TecMaia, Rua Engenheiro Frederico Ulrich 2650, Moreira da Maia, Portugal, 7 Universidade Cato´ lica Portuguesa, CBQF—Centro de Biotecnologia e Quı´mica Fina–Laborato´rio Associado, Escola Superior de Biotecnologia, Rua Arquiteto Lobão Vital 172, Porto, Portugal
☯These authors contributed equally to this work.
*ana.colette@hotmail.com,acmauricio@icbas.up.pt
Abstract
Mesenchymal Stromal cells (MSCs) have a potential role in cell-based therapies. Foetal bovine serum (FBS) is used to supplement the basal cell culture medium but presents sev-eral disadvantages and risks. Other alternatives have been studied, including human umbili-cal cord blood plasma (hUCBP), aiming at the development of xeno-free culturing protocols. A comparative characterization of multicomponent metabolic composition of hUCBP and commercial FBS based on Nuclear Magnetic Resonance (NMR) spectroscopy and multivar-iate statistical analysis was performed. The analysis of1H-NMR spectra revealed both simi-larities and differences between the two proposed supplements. Similar metabolites (amino acids, glucose, lipids and nucleotides) were found in the hUCBP and FBS NMR spectra. The results show that the major difference between the metabolic profiles of the two pro-posed supplements are due to the significantly higher levels of glucose and lower levels of lactate, glutamate, alanine and branched chain amino acids in hUCBP. Similar or slightly dif-ferent levels of important proteinogenic amino acids, as well as of nucleotides, lipids were found in the hUCBP and FBS. In order to validate it’s suitability for cell culture, umbilical cord-MSCs (UC-MSCs) and dental pulp stem cells (DPSCs) were expanded using hUCBP. In both hMSCs, in vitro culture with hUCBP supplementation presented similar to improved metabolic performances when compared to FBS. The two cell types tested expressed differ-ent optimum hUCBP percdiffer-entage contdiffer-ent. For DPSCs, the optimum hUCBP contdiffer-ent was 6%
a1111111111 a1111111111 a1111111111 a1111111111 a1111111111 OPEN ACCESS
Citation: Caseiro AR, Ivanova G, Pedrosa SS,
Branquinho MV, Georgieva P, Barbosa PP, et al. (2018) Human umbilical cord blood plasma as an alternative to animal sera for mesenchymal stromal cells in vitro expansion – A multicomponent metabolomic analysis. PLoS ONE 13(10): e0203936.https://doi.org/10.1371/journal. pone.0203936
Editor: Zoran Ivanovic, EFS, FRANCE Received: January 25, 2018 Accepted: August 30, 2018 Published: October 10, 2018
Copyright:© 2018 Caseiro et al. This is an open access article distributed under the terms of the Creative Commons Attribution License, which permits unrestricted use, distribution, and reproduction in any medium, provided the original author and source are credited.
Data Availability Statement: All relevant data are
within the paper and its Supporting Information files.
Funding: This research was supported by
Programa Operacional Regional do Norte (ON.2 – O Novo Norte), QREN, FEDER with the project “iBone Therapies: Terapias inovadoras para a regenerac¸ão o´ssea”, ref. NORTE-01-0247-FEDER-003262, and by the program COMPETE – Programa Operacional Factores de
and for UC-MSCs, 4%. Cultured hMSCs displayed no changes in senescence indicators, as well as maintained characteristic surface marker’s expression. FBS substitution was associ-ated with an increase in early apoptosis events, in a dose dependent manner, as well as to slight up- and down-regulation of targeted gene’s expression. Tri-lineage differentiation capacity was also influenced by the substitution of FBS by hUCBP.
1. Introduction
Mesenchymal Stem / Stromal Cells are gaining ground as a source of innovative advanced therapeutic strategies for a number of diseases, with hundreds of ongoing or recruiting trials involving application of Human Mesenchymal Stromal Cells (hMSCs) (www.clinicaltrial.gov; database accessed on January 2018). As such, the scientific community has focused on devel-oping and optimising protocols for their isolation, expansion, and cryopreservation aiming at their effective application in state of the art therapeutic approaches to relevant clinical situa-tions. MSCs can be isolated from many tissue sources, such as the bone marrow, peripheral blood, dental pulp, umbilical cord, and amniotic fluid [1]. Human MSCs characteristics have been defined by the Mesenchymal and Tissue Stem Cell Committee of the International Soci-ety for Cellular Therapy [2] as being plastic-adherent when maintained in standard culture conditions, expressing cluster of differentiation (CD) 105, CD73 and CD90, and lacking expression of CD45, CD34, CD14 or CD11b, CD79α or CD19 and HLA-DR surface mole-cules. Finally, the hMSCs are able to differentiate into osteoblasts, adipocytes and chondro-blastsin vitro, in the presence of adequate differentiation media [3].
The umbilical cord tissue or matrix (Wharton jelly–UCT) is an important source of MSCs, baring advantages over other sources for being non-invasively collected (previously considered as medical waste). Also, increasing numbers of high quality cryopreserved samples worldwide, in private and public cryopreservation banks, and the ready availability for therapeutic usage [4–12] adds a further advantage. Dental derived stem cells are other population with increasing relevance, mostly due to the increasing availability of cryopreservation options, for autologous and allogeneic applications, in both infants and adult individuals.
According to the European Medicines Agency (EMA) and European Commission regula-tion [EC 1394/2007 of the European Commission], hMSCs are considered as medicinal prod-ucts and must be produced in compliance with good manufacturing practices (GMP) [13]. For that purpose, stem cells from either source must be cultured on large scale, and isolated, pro-cessed and cryopreserved according to GMP conditions. This implies the usage of xeno-free medium and reagents of clinical grade for the cell culture, for quality assurance and control, and long term rastreability of the samples [8,14,15].
Currently available hMSCs expansion protocols use foetal bovine serum (FBS) and other animal sera for culture media supplementation, providing vital nutrients and growth factors. These also act as a pH buffering agent, and provide protection against cytotoxic components, playing a crucial role in hMSCs survival. Nonetheless, there are several concerns on the use of FBS for clinical applications, due to the potential immunogenicity of FBS cultured cells and of xenogeneic proteins present in the cell culture, capable of inducing anaphylactic orarthus-like
immune reactions, which have been reported. Notwithstanding this, FBS-cultured hMSCs have been approved by the US Food and Drug Administration (FDA) for medical applications [16,17]. Complications of using animal sera forin vitro cell culture also include high
batch-to-batch variability, unexpected cell growth characteristics, cytotoxicity of uncharacterized factors
Competitividade, Projects PEst-OE/AGR/UI0211/ 2011 and PEst-C/EME/UI0285/2013 funding from FCT. This research was also supported by Programa Operacional Competitividade e Internacionalizac¸ão (P2020), Fundos Europeus Estruturais e de Investimento (FEEI) and FCT with the project “BioMate – A novel bio-manufacturing system to produce bioactive scaffolds for tissue engineering” with reference PTDC/EMS-SIS/7032/ 2014 and by COMPETE 2020, from ANI – Projectos ID&T Empresas em Copromoc¸ão, Programas Operacionais POCI, by the project “insitu.Biomas -Reinvent biomanufacturing systems by using an usability approach for in situ clinic temporary implants fabrication” with the reference POCI-01-0247-FEDER-017771. Ana Rita Caseiro (SFRH/BD/ 101174/2014) acknowledges FCT, for financial support. This work received financial support from the framework of QREN through Project NORTE-07-0124-FEDER-000066. The Bruker Avance III 600 HD spectrometer was purchased under the framework of QREN, through Project NORTE-07-0162-FEDER-000048, and is part of the Portuguese NMR Network created with support of FCT through Contract REDE/1517/RMN/2005, with funds from POCI 2010 (FEDER). PP Barbosa is an employee of Biosckin, Molecular and Cell Therapies, S.A., and she played a role in the study design, data collection and analysis, decision to publish, or preparation of the manuscript. Biosckin, Molecular and Cell Therapies, S.A., provided support in the form of salaries for authors [PP Barbosa], but did not have any additional role in the study design, data collection and analysis, decision to publish, or preparation of the manuscript. The specific roles of these authors are articulated in the ‘author contributions’ section.
Competing interests: The authors declare that
there are no conflicts of interest. Although PP Barbosa is an employee of Biosckin, Molecular and Cell Therapies, S.A., this does not alter the adherence to policies on sharing data and materials.
in the serum, and the risk of possible contamination with virus, prions, bacteria, nanobacteria, mycoplasma, yeast,fungi, and endotoxins [1,7,8,18–21]. The use of animal sera also implies the sacrifice of a huge number of young animals for blood collection, entailing severe eco-nomic, ethical and scientific issues on animal welfare [8].
These issues reinforce the intensive search for new alternatives to animal sera to better com-ply with GMP and FDA regulations (EMEA CPMP/BWP/1793/02; 2003; EMEA/410/01 rev. 2; 2004) [22,23]. The substituent cell culture medium supplement must match the animal sera characteristics crucial forex vivo cell culture, while maintaining a fair cost, being suitable for
safety and quality control, and readily/easily available. A variety of human blood products have been already considered as animal sera substituents [15,24–26]. Amongst them, human umbilical cord blood serum or plasma (hUCBS or hUCBP, respectively), due to its rich soluble growth factors’ content. These soluble factors support the growth, proliferation, and differenti-ation of hMSCs and HSCs [15,26,27], with potential pre-clinical and clinical applications [6–
8,14,28]. The implementation of hUCBS or hUCBP could solve important economic, ethical and scientific issues associated with FBS supplementation in cell-based therapies development. Moreover, the hUCBS and hUCBP are attractive alternatives to FBS due to the worldwide increase number of cryopreserved UCB units in Public and Private Cord Blood Banks, follow-ing high quality standards imposed by the international and national authorities [4–9,29].
The successful employment of hUCBP can result in the preparation of fully autologous cel-lular therapies, for patients with cryopreserved serum/plasma and cells or tissue. Alternatively, once the regulatory requisites are established, it can be envisioned for the preparation of allo-geneic cellular therapies. This would bring increased benefits for a larger number of patients, and turning cellular therapies promptly available, allowing medical action in optimal ‘windows of therapeutic opportunity’ for numerous diseases. Additionally, it would contribute to the broadening of possible beneficiaries for such therapies, including people that might have not had the chance to preserve autologous samples, and that may be in need of these advanced therapeutic strategies (for example, suffering from age-related of degenerative diseases).
In a previous study, we have identified specific components and factors (proliferative and anti-apoptotic growth factors, immunomodulatory and immunosuppressive cytokines and chemokines) in hUCBP that could have promoting effects on hMSCsin vitro expansion. The
results strongly suggest that hUCBP might be an alternative for the FBS supplemented culture medium used in hMSCsin vitro isolation, expansion and cryopreservation [4,8]. This assump-tion converges with the recently published results on the effect of haemoderived supplements on the hMSCs growth rate, viability and differentiation properties [15,26,30–33]. For this pur-pose, a detailed analysis of the hUCBP components is crucial to validate this human haemo-derivate by-product as a supplement forex vivo expansion and processing of hMSCs for
clinical applications.
Metabolomics is an important and well-established analytical approach for the comprehen-sive and systematic determination of metabolite levels in biological samples. Nuclear magnetic resonance (NMR) spectroscopy is one of the main tools for metabolic profiling, identification and quantification of known and unknown metabolites in bio-fluids, tissues and cells. [34–36]. All metabolomics studies including NMR-metabolomics, result in a large number of complex multivariate data sets that require chemometric and bio-informatics methods for accurate data interpretation, visualization and analysis [37,38]. Data-reduction and pattern recognition techniques such as principal component analysis (PCA) allow for analysis, interpretation and classification of the large number of complex NMR spectroscopic data usually acquired for metabolic profiling of biological samples [34–36,39,40].
The first part of this study aims at the characterization of the metabolite composition of hUCBP, to address its capacity as a culture medium supplement and FBS substituent to
support xeno-freein vitro proliferation of hMSCs. The second part of the study aimed at
the validation of hUCBP substitution for the expansion of umbilical cord (UC-MSCs) and dental pulp- derived mesenchymal stem cells (DPSCs), and its effects on cell viability and senescence, surface marker- and gene expression, as well as on their tri-lineage differentiation capacity.
2. Material and methods
The hUCB samples included in the present study were processed and cryopreserved by Biosckin, Molecular and Cell Therapies S.A. (Maia, Portugal), which is an authorized Portu-guese Private Cord Blood Bank for UCB processing and cryopreservation by the Direc¸ão-Geral de Sau´de (DGS), and certified for ISO9001 and for NP4457 (Authorization from DGS in attachment). The hUCB was collected from healthy donors that signed a contract with
Biosckin, Molecular and Cell Therapies S.A. for processing and cryopreserved the buffy coat of the collected umbilical cord blood where the hematopoietic stem cells are included. On the other hand, the hUCB plasma is not cryopreserved and it is a by-product which is not cryopre-served and it is usually destroyed. The present experimental work used those hUCB plasmas and it should be emphasized that the donors that have this contract with Biosckin, Molecular and Cell Therapies S.A. authorize the use of these by-products for research. Patient records used in our retrospective study were fully anonymized before the authors accessed the data for the present study and the ethics committee waived the requirement for informed consent. Also, there is a scientific protocol / contract between the University of Porto and the Biosckin, Molecular and Cell Therapies S.A., which includes I&D projects, PhD and master supervision of students, among other training and teaching activities. For that reason, it was not necessary to submit this study to approval of the ethical commission.
2.1. Study design
In the first part of the study, appropriate 1D and 2D NMR techniques have been used to iden-tify metabolites in the hUCBP (a total number of 13 samples collected from healthy donors) and two commercial FBS products (FBS_I and FBS_II), and to define their relative quantitative distribution. Principal component analysis has been used to interpret and classify the NMR spectral data and to evaluate the main factors contributing to the discrimination between these two groups of samples. Prior to NMR analysis, a complete characterization of the hUCB sam-ples was performed (haematology for total nucleated cells (TNC) and white blood cells (WBC) count, flow cytometry for CD45+/ CD34+cell counts, and cell viability), accompanied by pre-birth and immediate after-pre-birth maternal screening for relevant transmittable pathogens, including Cytomegalovirus, Venereal disease/ Syphilis, Hepatitis B and C, HIV-I and II, Toxo-plasmosis (and Human T-Cell Lymphotropic Virus Types I and II (HTLV-I/-II), if relevant). Microbiological analysis was performed to hUCB units after volume reduction using an auto-mated blood culture system for aerobic and anaerobic microorganisms andfungi.
In the second part of the study, the capacity of hUCBP to sustain both hMSCs expansion was assessed with PrestoBlue1viability assay at different time points [24h, 72h, 120h, 168h, 216h], using umbilical cord-MSCs (UC-MSCs) and dental pulp stem cells (DPSCs). Crescent concentrations of hUCBP were added as a supplement of the basal culture medium [2%, 4%, 6%, 8%], and compared with FBS_II at 10%, generally used standard culturing protocols. The effects of the supplement substitution on hMSCs cultures were assessed regarding senescence and apoptosis events, hMSCs’ phenotypical identity/ surface marker and gene expression, as well as tri-lineage differentiation capacity.
2.2. Ethics and regulation
The hUCB included in the present study were processed and cryopreserved by Biosckin, Molecular and cell Therapies S.A. (Maia, Portugal), an authorized Portuguese Private Cord Blood Bank for UCB processing and cryopreservation by the Direcc¸ão-Geral de Sau´de (DGS), and certified for ISO9001 and for NP4457. The hUCB was collected from healthy donors, according to Netcord guidelines and following Portuguese laws N˚ 12/2009 and N˚ 1/2015 (Dia´rio da Repu´blica, lei 12/2009 de 26 de Marc¸o de 2009 and Dia´rio da Repu´blica, lei 1/2015 de 8 de Janeiro de 2015), with written informed consents according to Directive 2004/23/EC, which sets the standards of quality and safety for the donation, procurement, testing, process-ing, preservation, storage and distribution of human tissues and cells.
2.3. Preparation of umbilical cord plasma
Thirteen samples of hUCBP collected from different healthy donors were used for1H-NMR analysis (N = 13). The hUCBP samples were analysed by haematology auto-analyser, flow cytometry and for microbiological contamination for aerobic and anaerobic microorganisms andfungi. A pool from 12 out of 13 of these hUCBP (N = 12) was used for the in vitro
valida-tion with UC-MSCs and DPSCs viability assessment.
2.4. Donors selection and umbilical cord blood (UCB) collection
Maternal and neonatal pairs were evaluated during the antenatal period in the maternity wards at different hospitals collaborating with the Umbilical Cord Blood Private Bank of Biosckin, Molecular and Cell Therapies, S.A. (Maia, Portugal). Donors signed informed con-sent before delivery and were clinically evaluated according to Portuguese law (Dia´rio da Repu´blica, lei N˚ 12/2009 de 26 de Marc¸o de 2009 and lei N˚ 1/2015 de 8 de Janeiro de 2015). Human UCB was collected from the umbilical vein by gravity into a 150 ml volume simple bag (reference #1385.13, Suru, Portugal) containing 21 ml of citrate-phosphate-dextrose (CPD). The hUCB was stored at 4˚C± 2˚C until processing for cryopreservation. Human UCB sam-ples were transported to the Biosckin, Molecular and Cell Therapies S.A. laboratory at refriger-ated temperatures ranging between 4˚C and 22˚C, within 72 hours of collection. The
collection method was the same for all the units included in this study.
2.5. Volume reduction with the AXP automated system
The AXP system1(Thermogenesis) was used to achieve the separation of a concentrated mononuclear cell (MNC) fraction of uniform volume. During the two-step centrifugation, whole blood is separated into three layers that are delivered into a red blood cells (RBC) bag and a freezing bag. Plasma remains in the processing bag which is also the plasma bag. The programmed final volume in the cryopreservation bag was 21 ml. Samples of the hUCB were taken by sampling pillows integrated within the kit for hematology auto-analyzer and flow cytometry analysis [8,41–43].
2.6. Haematology auto-analyzer, flow cytometry and microbiological
analysis of the UCB
Maternal screening for Cytomegalovirus, Venereal disease/ Syphilis, Hepatitis B and C, HIV-I and II, Toxoplasmosis (and Human T-Cell Lymphotropic Virus Types I and II (HTLV-I/-II), if relevant) was mandatory for sample acceptance for processing. All cryopreserved samples were negative to the screened agents. Microbiological analysis was performed after volume reduction and before cryopreservation (samples are maintained in quarantine until final
results are disclosed) using an automated blood culture system (BacT/ALERT1, BioMe´rieux) at 35˚C for 14 days, and included microbiologic analysis for aerobic and anaerobic microor-ganisms andfungi. For the UCB units that presented microbial contamination, the
microor-ganism was identified and was performed the antibiogram for identification of the antibiotic sensitivity of the identified microorganisms [8].
Total nucleated cells (TNC) and the number of white blood cells (WBC) were counted with a hematology auto-analyzer (Ac T diff2™, Beckman Coulter, Inc.) before and after the AXP vol-ume reduction procedure. These counts were not corrected for nucleated RBC. The CD34+ cell number and viability were quantified by flow cytometry (BD FACSCalibur™ 3 CA Becton Dickinson, BD Biosciences), the software for acquisition and analysis were BD CellQuest™ and BDCellQuest Pro Templates, respectively. The clusters of differentiation used to enumerate the total number of CD34+cells and the total number of leucocytes (CD45+), the 7-Amino-Actinomycin D (7AAD) nucleic acid dye was used for viability measure (BD Stem Cell Enu-meration kit, Becton Dickinson, BD Biosciences), according to the manufacturer’s protocol. The BD Stem Cell Enumeration simultaneously enumerates the total viable dual-positive (CD45+/CD34+) hematopoietic stem cells in absolute counts of CD34+cells perμL and the percentage (%) of viable leucocytes (CD45+) that are CD34+[8].
2.7. FBS commercial samples
The two FBS formulations commercially available as a supplement for hMSCs culture rou-tinely used by our research group forin vitro isolation and expansion were tested. The FBS_I
was obtained from GIBCO (Gibco1Invitrogen, EU Approved FBS, Origin South America, Heat Inactivated, and reference #10500–064). The FBS_II was obtained from BI, Biological Industries (BI LTD, Certified FBS, reference #04-400-1A), and is classified for human MSCs, 0.1μm membrane filtered, tested for mycoplasma, and virus screened. This FBS_II is heat inactivated, sterile-filtered, and according to the manufacturer information, presents hemoglo-bin in a concentration �25 mg/dl, and �10 EU/ml endotoxin, and it was used for thein vitro
validation. For both formulations, 3 different samples obtained from a different lot were tested in the1H-NMR experiments (N = 3).
2.8. Part I: Supplements metabolomic characterization
2.8.1. NMR spectroscopy. A 600μl aliquot of each sample was transferred into 5 mm NMR tubes and mixed with 50μl deuterium oxide (D2O) containing 0.05mM sodium
tri-methylsilyl-[2,2,3,3-d4]-propionate (TSP) as an internal reference. The NMR experiments were recorded at 300K on a Bruker Avance III 600 HD spectrometer, equipped with Cryo-Probe Prodigy. All1H NMR spectra were acquired with water suppression using a 1D NOESY (noesygppr1d) and a Carr-Purcell-Meiboom-Gill (CPMG, cpmgpr1d) pulse sequences [44,
45]. The 1D NOESY spectra were collected using 5s relaxation delay and mixing time of 0.01s. The CPMG experiments (cpmgpr1d) were acquired with relaxation delay 4s, during which the water resonance signal was selectively irradiated. The echo time was optimized for each sample and was between 0.3 and 0.8 ms, and a loop for T2 filter of 20 was used. For all1H-NMR spec-tra 128 or 256 spec-transients of a specspec-tral width of 10000 Hz were collected into 32 K time domain points. The spectra were processed with the Bruker Topspin software package (version 3.2). The time domain data were multiplied by an exponential function with line-broadening factor of 0.3 Hz and zero-filled to 64 k prior to Fourier transformation. Two dimensional (2D)
1
H/1H COSY and TOCSY spectra were recorded in phase sensitive mode and with water sup-pression; a relaxation delay of 2s, 16 or 32 scans, a total 2K data points in F2 and 256 or 512 data points in F1 over a spectral width of 10000 Hz. 2D1H/13C heteronuclear single quantum
coherence (HSQC) experiments were carried out with a spectral width of 10000 Hz for1H and 27000 Hz for13C, relaxation delay 1.5 s, Fourier transform (FT) size 2Kx1K. The quantitative distribution of NMR-detectible metabolites in hUCBP and FBS (FBS_I and FBS_II) analysed samples was determined from the integral intensity of characteristic signals in1H-NMR spec-tra of the samples referenced to the total integral intensity of the signals in the specspec-tra, consid-ering the number of the contributing nuclei for that particular resonance signal.
2.8.2. Multivariate statistical analysis of NMR spectroscopy data. In the present study,
the integral intensities over small chemical shift regions (bins) of size 0.01 ppm over the spec-tral region between 0.50 and 9.00 ppm were used as descriptors for interpretation and statisti-cal analysis of the NMR data. Data was normalized by the total sum of the integral intensities in the spectral region of interest. In all studies the water and citric acid spectral regions were excluded. Additionally, a separate NMR-data set was prepared with the regions containing sugars and lactate resonance signals excluded. The Principal Component Analysis (PCA), an unsupervised pattern recognition approach, was applied to examine the intrinsic variation in the data set and compare the metabolic profiles of the 13 hUCBP samples and 2 commercial formulations of FBS (FBS_I and FBS_II) [46]. PCA determines the independent sources of var-iance across a set of spectra and ranks these Principal Components (PCs) in order of their con-tribution to the overall variance. PCA facilitates the identification of the sources of variation relevant to systematic changes in a number of key features in the NMR spectra. Based on the singular values decomposition (SVD) technique, Principal Components (PCs) are extracted from the initial NMR data matrix. Each PC is orthogonal (uncorrelated) with all other PCs. The PCs are ordered based on their information content, with the first few PCs containing the largest part of the variance of the data set. Two dimensional PC maps (PC1 vs. PC2) were used as a convenient way to visualize inherent data clusters and outliers, and make conclusions on the degree of correlation between the hUCBP and both FBS samples. If there are systematic metabolic differences between samples, similar samples may cluster together in the scores plot, and classification of the samples may be possible. Further, PC loading plots (ppm vs. PC1 or PC2) were used to reveal the main metabolites and the associated spectral regions responsible for the NMR data variability. The loading plots define the contribution of variables, i.e. the metabolite content for the divergence or clustering between the samples [34–36].
2.9. Part II:
In vitro validation
2.9.1. Cell viability assessment. Cell culture and maintenance: UC-MSCs and DPSCs
were thawed andin vitro expanded using standard protocols previously reported by our
research group [4–12,29,47–49]. UC-MSCs and DPSCs were maintained at 37˚C and 95% humidified atmosphere with 5% CO2environment. UC-MSCs were obtained from PromoCell,
Cat. C-12971; Lot No. 1112304.2) and DPSCs from AllCells, LLC (Cat. DP0037F, Lot No. DPSC090411-01). MSCs’ batches identity was confirmed through flow cytometry analysis. Passage 5–7 cultures were utilized in the presented assays in both cell populations. Both popu-lations were initially maintained inαMEM, with GlutaMAX™, without nucleosides (Gibco, reference #32561029) supplemented with 10% (v/v) FBS, 100 IU/ml penicillin, 0.1 mg/ml streptomycin (Gibco, reference #15140122), 2.05μg/ml amphotericin B (Gibco, reference #15290026) and 10 mM HEPES Buffer solution (Gibco, 15630122). For thein vitro viability
studies, the FBS_II was selected for culture medium supplementation of both hMSCs types under study.
PrestoBlue Cell Viability Protocol: The PrestoBlue (Thermo Fisher Scientific, Molecular
Probes) assay is a commercially available, ready-to-use, water-soluble preparation. Cells were seeded in 24 well plate at 4x10³cells/well. The cells were left adhering in complete culture
medium, overnight. After this period, culture media was replaced by test media [αMEM with GlutaMAX, without nucleosides supplemented with either 2%, 4%, 6%, or 8% of hUCBP pool or 10% FBS (v/v), 100 IU/mL penicillin, 0.1 mg/ml streptomycin, 2.05μg/ml amphotericin B and 10 mM HEPES buffer solution]. Previous experimental set ups revealed jellification of the hUCBP supplemented medium, despite of its collection and transportation in CPD containing collection bags. Hence, heparin (Heparin Sodium, 5.000 IU/ml, BBraun1) was added to the hUCBP supplemented medium formulations, at 2 UI/ml. Preliminary assays presented no sig-nificant effect of heparin addition on standard culture conditions, using 10% FBS supple-mentedαMEM (data not shown).
At every time point [24 hours (1 day), 72 hours (3 days), 120 hours (5 days), 168 hours (7 days), and 216 hours (9 days)], the culture media was removed and fresh adequate culture media was added to each well, with 10% (v/v) of 10x PrestoBlue cell viability reagent (Thermo Fisher Scientific, Molecular Probes, Invitrogen, reference #A13262), and UC-MSCs and DPSCs were incubated for 1 hour at 37˚C, 5% CO2. Changes in cell viability were detected by
absorbance spectroscopy of cell culture supernatant, and absorbance was read at 570nm and 595 nm in a Thermo Scientific Multiskan FC plate reader. Absorbance readings were normal-ized and data corrected to unseeded control wells’ readings. At each time point, sample wells were harvested using Trypsin-EDTA and triplicate cell counts were performed with Trypan Blue exclusion dye assay (15250061, Gibco), using an automated counter (CountessTMII FL Automated Cell Counter, Invitrogen).
2.9.2. Senescence and apoptosis. To assess for signs of senescence in the cellular
popula-tions,β-Galactosidase activity was assayed. Cells were plated in 96-well plates, as described for the growth dynamics assessment, maintaining the assigned hUCBP or FBS supplemented media. At 3, 5 and 7 days [72, 120 and 168 hours], culture media was removed, and cells were washed once with DPBS and incubated withβ-Galactosidase Assay Reagent (75705, Thermo Fisher Scientific), for 30 minutes at 37˚C. Absorbance was read at 405 nm. UC-MSCs and DPSCs cultured in either hUCBP or FBS supplemented media were further assessed for apo-ptosis events, through the detection of Annexin V and Propidium Iodine (PI) staining (BMS500FI, eBioscience). For such, cells cultured for 5 days in each condition were harvested using Trypsin-EDTA, counted and resuspended in provided Binding Buffer. Cells were incu-bated with Annexin V-FITC and PI, as per manufacturer’s protocol, and FACS analysis was performed using a Coulter Epics XL Flow Cytometer (Beckman Coulter Inc., Miami, FL, USA). Flow cytometry data was processed using FlowJo Engine X10.4 (v3.05478, LLC).
2.9.3. MSCs’ Phenotype identity. The surface marker profiles of UC-MSCs and DPSCs
cultured in either hUCBP or FBS supplemented media were assessed though Flow Cytometry. MSCs populations were cultured for 5 days, as described previously and harvested using Accu-taseTMCell detachment solution (561527, BD Biosciences), counted and resuspended in Stain Buffer (554676, BD Biosciences). Cells were incubated with anti-positive (CD90, CD105, CD44) and negative marker (CD34, CD11b, CD19, CD45, MHC class II) antibodies and assayed as per manufacturer’s instructions (Human MSC Analysis Kit, 562245, BD Biosci-ences), using a BD FACSCalibur 3 CA Becton Dickinson, BD Biosciences. Flow cytometry data was processed using FlowJo Engine X10.4 (v3.05478, LLC).
2.9.4. Gene expression. Reverse transcriptase Polymerase chain reaction (RT-PCR) and
qPCR was performed targeting housekeeping and MSCs’ related gene sequences listed in
Table 1.
MSCs populations cultured in the described media were harvested using Trypsin-EDTA, as previously described, and pellets of 106cells of each group were used for total RNA extraction, using the AurumTMTotal RNA Mini kit (732–6820, Bio Rad). Briefly, cell pellets were lysed, DNA was removed with DNase I enzyme and obtained RNA was eluted. Total RNA was
quantified using a nanophotometer readings at 260 and 280 nm (NanoPhotometerTMPearl, Implen GmbH). Once RNA concentrations were tuned between samples, cDNA was synthe-sized from the purified RNA using the iScript Reverse Transcription kit (170–8891, Bio Rad) and T100 Terma Cyclar Thermocycler (Bio Rad), as per manufacturer’s instructions. Quanti-tative PCR (qPCR) was performed in a CFX96 TouchTM(BioRad) apparatus using the iTAQTMSYBR1 Green Supermix (172–5120, BioRad) and custom PCR plates encompassing duplicates of targeted human genes and negative control (Table 1). Recommended PrimePCR cycling protocol was employed: 95˚C for 2 minutes (activation), 40 cycles comprising 95˚C for 5 seconds (denaturation) -60˚C for 30 seconds (annealing), and 65 to 95˚C (0.5˚C increments), 5 secs/step (melt curve). The number of cycle threshold for each well was recorded. Data was processed using BioRad CFX1Manager Software 3.1 (Bio Rad Laboratories). Fold differences were calculated using the standardΔΔCq method with GAPDH and β-actin as housekeeping genes. The reference gene on the hUCBP supplemented samples was calculated relative to cali-brator sample (FBS10%) (fold change between two Cq values) through the equation: Relative quantification (RQ) = 2ΔΔCt
2.9.5 Multilineage differentiation. Osteogenic and Adipogenic differentiation proto-cols—MSCs were seeded onto 24-well plates (8.000 viable cells/cm2), and cultured with either FBS or hUCBP supplemented media until 70–80% confluence was reached (after 3 days). At this point, cells were transitioned to specific differentiation media: Adipogenesis (StemPro Adipogenesis Differentiation kit, A10070-01, Gibco), following manufacturer’s instructions, or formulated Osteogenesis medium, composed of expansion media further supplemented with 5nM Dexamethasone (D8893 –Sigma Aldrich1), 250μM de ascorbic acid-2- phosphate (AsA2-P, A4403, Sigma Aldrich)) e 10mMβ-glycerphoshate (β-GP, G9422, Sigma Aldrich). Xeno-free Osteogenic formulations were prepared using 4%, 6% or 8% hUCBP supplementa-tion [50]. Control wells were maintained in culture media absent osteogenic supplements. Media were changed every 3 days, for 21 days, for Adipogenesis and Osteogenesis, respectively. After 14 days, cells under Adipogenic differentiation were stained with Oil Red O, for lipid droplets detection and semi-quantification. Alizarin Red S Assay was employed to asses for Osteogenic differentiation after 21 days; Oil Red O (Qualitative and Semi-Quantitative): Cells were fixated with 4% formaldehyde (3.7–4% buffered to pH7, 252931.1315, Panreac AppliChem) and incubated with Oil Red O (O0625, Sigma-Aldrich) working solution for 10– Table 1. Primer sequence information for qRT-PCR custom plate array.
Gene Length (bp) Bio Rad Assay ID
MSCs targets CD34 99 qHsaCID0007456 CD90/ THY1 120 qHsaCED0036661 CD73/ NT5E 117 qHsaCID0036556 CD105/ ENG 124 qHsaCID0010800 CD166/ ALCAM 173 qHsaCID0037887 CD117/ c-kit 63 qHsaCID0008692 SOX2 98 qHsaCED0036871
OCT3-4/ POU5F1 100 qHsaCED0038334
MHC class I/ HLA-A 115 qHsaCED0037388
MHC class II/ HLA-DRA 119 qHsaCED0037296
Housekeeping genes:
β-actin 62 qHsaCED0036269
GAPDH 117 qHsaCED0038674
20 minutes at room temperature. Oil Red O was discarded and excess dye removed. Differenti-ated cells were observed under inverted microscope (Axiovert 40 CFL, Zeiss). For semi-quanti-fication, Oil Red O stain was eluted through the addition of 100% isopropanol (59300, Merck Milipore1), and absorbance was read at 570 nm; Alizarin Red S (Qualitative and
Semi-Quantitative): ARS Assay was used to qualitatively and semi-quantitatively determine
Osteo-genic differentiation of hMSCs, as described in [50]. Cells were fixed with 4% formaldehyde and stained with 40 mM ARS (2003999, Milipore) and incubated for 30 min with gentle shak-ing. Following incubation, unbound dye was removed and wells were washed with diH2O
until supernatant became clear. Red stained mineralized layers produced by differentiated cells were observed macroscopically and under inverted microscope. For the extraction and quanti-fication of the ARS, 10% acetic (ARK2183, Sigma-Aldrich) was added to the wells. Cells and mineral deposits were scraped from the plate and collected, heated at 85˚C for 10 minutes and immediately transferred to ice, for 5 minutes. The samples were centrifuged, and individual absorbance values were measured at 405 nm, along with a standard curve for the calculation ARS concentration (μM).
Chondrogenic differentiation protocol: MSCs were suspended at 2x10⁴viable cells/well of 96-well plate, and let to adhere for 48 hours. Chondrogenic culture medium (StemPro Chondrogenesis Differentiation kit, A10071-01, Gibco) was added to each well. Control wells remained in FBS or hUCBP supplemented media. Media was replaced every other day in both groups. After 14 days, wells were stained with Alcian Blue to assess for Proteoglycan’s synthesis by differentiated chondrocytes and Sulfated Glycosaminoglycans (GAGs) produc-tion was quantified using the Blyscan™ Glycosaminoglycan Assay (Biocolor, UK). Alcian Blue
Staining (Qualitative): Cells were fixated with 4% formaldehyde, and stained with Alcian
Blue (A9186, Sigma) solution. Alcian Blue was discarded and wells were rinsed with acetic acid 3% (v/v). Acidity was neutralized with distilled water, and left in each well for visualization. Differentiated cells were observed under inverted;GAGs Production (Quantitative): Sulfated
GAGs Assay was carried as per manufacturers’ instructions. Culture media was removed from each well and reserved. GAGs in the ECM produced by cultured cells was extracted using Papain (P3125 Sigma-Aldrich) and added to the previously collected supernatant, for total GAGs quantification). After centrifugation and removal of cellular debris, Blyscan dye reagent was added and incubated for 30 minutes, and then centrifuged to isolate the precipitated coloured complex. The precipitate was dissolved and individual absorbance values were mea-sured at 656 nm, along with a standard curve for the extrapolation of GAGs concentration (μg/ml).
2.10. Statistical analysis
Statistical analysis was performed using the GraphPad Prism version 6.00 for Mac OS X (GraphPad Software, La Jolla California USA). The experiments were performed in triplicates and the results were presented as Mean± SEM. Significant differences are also presented as percentage difference, in which 100% viability corresponds to the non-treated cells. Dunnett’s multiple comparisons test against control group (10% FBS) were performed by one-way ANOVA supplemented with Tukey’s HSD post-hoc test. Quantitative data ofβ-Galactosidase activity, Flow cytometry data and Multilineage differentiation assays were subjected to one-way ANOVA test, followed by pairwise comparisons using Tukey’s HSD post hoc test. Statisti-cal significance was established as P<0.05. Differences were considered statistiStatisti-cally significant at P < 0.05. Significance of the results is indicated according to P values with one, two, three or four symbols (�) corresponding to 0.01�P<0.05; 0.001�P< 0.01; 0.0001�P<0.001 and
3. Results
Results obtained are herein presented, and the most relevant findings highlighted.
3.1. Haematology auto-analyser, flow cytometry and microbiological
analysis of the umbilical cord blood (UCB) units
S1 Table(found in Supporting information) summarizes the data obtained by haematology auto-analyzer, which includes the initial WBC count, performed before the volume reduction with the AXP automated system (in cells x 109per L) and the final WBC count (in cells x 109 per l), performed after the volume reduction procedure of the UCB samples. The obtained mean values were 9.61± 2.96 x 10⁹cells/l and 29.42± 14.79 x 10⁹cells / l, respectively. The samples presented an average of 66.17± 60.19 viable CD34+cells/μl, with 93.13 ± 6.65% viability, and 17.63± 7.27 x 10⁹viable CD45+/l, with 89.72± 4.96% viability (N = 13), demon-strating individual variability considering the UCB hematopoietic stem cells concentration and CD45+/ CD34+cell viability. This individual variability has been previously reported in UCB units processed by AXP automated system [41–43].
Considering the microbiological evaluation of the UCBP, all the samples were negative for aerobic, anaerobic microorganisms andfungi, except for the sample hUCBP#5 which was
posi-tive forActinomyces meyeri in anaerobiosis. Although contamination was identified in this
samples, all of the haematological parameters remained within the average counts (S1 Table,
hUCBP#5 sample). The bacterial contamination did not interfere with1H-NMR analysis and no statistical differences were observed between plasma sample hUCBP#5 and the mean values calculated for the 13 plasma samples analysed (P<0.05) (S1 Table). However, hUCBP#5 was
excluded from the pool used for thein vitro validation, in order to prevent the cell culture
con-tamination, and the hUCBP pool included only 12 out of 13 samples analysed (N = 12).
3.2. Part I: Supplements metabolomic characterization
3.2.1. NMR spectroscopy. 1H-NMR spectra of all hUCBP and FBS samples were acquired with water suppression using 1D NOESY and CPMG pulse sequences. The implementation of 1D NOESY has led to1H-NMR spectra with improved solvent peak (at 4.70 ppm) suppression but complex line shapes and highly overlapped resonances from the low molecular weight metabolites and macromolecular components. To reduce the complexity of the spectra, T2-edited CPMG experiments with appropriate T2 delays were used to attenuate the broad signals from high molecular weight species and facilitate the identification of small molecular components. The average1H (CPMG) NMR spectra of hUCBP and FBS samples are shown in
Fig 1AandFig 1B, respectively. The assignment of the resonance signals in the spectra was based on results obtained from various 1D and 2D (1H/1H COSY,1H/1H TOCSY,1H/13C HSQC) NMR experiments and reference data [51,52]. Characteristic resonance signals of metabolites identified in1H -NMR spectra of hUCBP and FBS samples are labelled inFig 1. The analysis of1H-NMR spectra has allowed the identification and quantification of a number of metabolites in hUCBP and FBS listed inTable 2.
The presence of essential amino acids useful for protein metabolism and protein synthesis (alanine, arginine, glutamine, glutamate, isoleucine, histidine, leucine, lysine, phenylalanine, proline, tyrosine, and valine), organic acids and derivatives (lactate,β-hidroxibutirate, ethanol, formate, creatine), glucose (α glucose and β glucose), lipids, and nucleotides (adenosine, uri-dine, guanosine species) were detected in the hUCBP, FBS_I, and FBS_II samples spectra. The relative integral intensity of characteristic signals in1H-NMR spectra of hUCBP samples and FBS samples (both FBS_I and FBS_II) was used to quantify the detected metabolites. The
Fig 1. MHz1H-NMR spectra of FBS_I and FBS_II and hUCBP. Average 600 MHz1H-NMR spectra (A) of FBS_I, and FBS_II and (B) hUCBP samples.
https://doi.org/10.1371/journal.pone.0203936.g001
Table 2. Relative quantitative distribution of metabolites observed in the1H-NMR spectra of hUCBP, FBS_I, and FBS_II samples.
Metabolites Code Group Chem. Shifts (ppm) hUCBP FBS_I FBS_II
1-Methylhistidine 1_Me-His CH 7,80–7.86 0,47 ± 0,23 0,43 ± 0,05 0,34 ± 0,08 3-Methylhistidine 3-Me-His CH 7,60–7,68 0,47 ± 0,21 0,43 ± 0,06 0,31 ± 0,09 Acetate Ace CH3 1,93 0,14 ± 0,05 0,18 ± 0,01 0,18 ± 0,02 Adenosine ADP/ATP CH 8,22 0,48 ± 0,21 0,41 ± 0,06 0,28 ± 0,09 Alanine Ala CH3 1,46 0,35 ± 0,12 0,86 ± 0,04 0,89 ± 0,02 Bile Acids BA CH3 0,50–0,75 0,37 ± 0,16 0,26 ± 0,02 0,21 ± 0,07 Choline Cho NCH3 3,24 0,13 ± 0,04 0,12 ± 0,00 0,11 ± 0,01 Citrulline Citr CH2 3,12 0,25 ± 0,07 0,20 ± 0,00 0,17 ± 0,03 Creatine Cr CH3 3,04 0,22 ± 0,16 0,35 ± 0,01 0,38 ± 0,01
Ethanol/ Hydroxybutyrate EtOH/HB CH3 1,21 0,31 ± 0,11 0,62 ± 0,02 0,22 ± 0,01
Formate For CH 8,52 0,53 ± 0,21 0,41 ± 0,06 0,29 ± 0,09
Glutamate/ Glutamine Glu/Gln CH2 2,34 0,85 ± 0,30 1,40 ± 0,01 1,44 ± 0,07
Histidine His CH 7,74 0,23 ± 0,11 0,20 ± 0,03 0,18 ± 0,04 Lactate Lac CH 4,14 1,01 ± 0,25 3,33 ± 0,10 3,25 ± 0,25 Lipids Lip CH3 0,8–0,9 0,62 ± 0,18 0,59 ± 0,00 0,66 ± 0,01 Lysine/Arginine Lys/Arg CH/CH2 1,6–1,8 0,49 ± 0,15 0,50 ± 0,01 0,47 ± 0,06 Phenylalanine PheAla CH3.5 7,44 0,16 ± 0,07 0,15 ± 0,02 0,13 ± 0,02 Prolina Pro CH 4,2 0,44 ± 0,16 0,64 ± 0,06 0,80 ± 0,15 Threonine Thr CH 4,26 0,32 ± 0,13 0,51 ± 0,05 0,57 ± 0,04 Tryptophan Try CH7 7,56 0,24 ± 0,11 0,20 ± 0,03 0,15 ± 0,04 Tyrosine Tyr CH2.6 6,9 0,13 ± 0,11 0,12 ± 0,03 0,08 ± 0,05
Valine/ Leucine/ Isoleucine Val/Leu/Ile CH3 0,9–1,1 0,30 ± 0,09 0,69 ± 0,02 0,77 ± 0,04
α-Glucose α-Glu CH(H1) 5,28 2,93 ± 0,63 0,47 ± 0,02 0,42 ± 0,01
β-Glucose β-Glu CH(H1) 4,68 3,40 ± 0,70 0,73 ± 0,15 0,69 ± 0,05
results allowed us to estimate the relative quantitative distribution of metabolites in all studied samples. The metabolic profiles of the FBS samples (both FBS_I and FBS_II) were found to be very similar but demonstrated some differences when compared to analysed hUCBP samples. The average data for the metabolites distribution in hUCBP, FBS_I and FBS_II samples are graphically presented inFig 2.
The results have shown that the major difference between the metabolic profiles of hUCBP and FBS samples is due to the different content of glucose, lactate, glutamate, alanine and branched chain amino acids (seeTable 2for detailed relative quantities). Significantly higher levels of glucose (α glucose and β glucose) and lower levels of lactate were found for the hUCBP than for FBS samples. The analysis of1H-NMR spectra further revealed an increased level of alanine, glutamate, isoleucine, leucine and valine in both commercial FBS (FBS_I and FBS_II) when compared to hUCBP samples. This seems to be the main difference between the amino acids profiles of hUCBP and FBS. Increased levels of alanine and glutamine can be identified in the commercial FBS sera. Apart from the amino acids discussed above, all hUCBP samples were found to have similar or slightly higher contents of arginine, citrulline, choline, histidine, 1(3)-methyl-histidine, lysine, phenylalanine, tryptophan and tyrosine, as well as of nucleotides (δ = 8.4–7.8 ppm), lipids (δ = 0.5–0.9; 1.3; 5.3 ppm), choline and formate when compared to the FBS samples analysed.
Fig 2. Relative quantitative distribution of the metabolites in hUCBP, FBS_I and FBS_II. Results presented as Mean± SEM. Symbols reflect differences between hUCBP and FBS_I (�), hUCBP and FBS_II (#), and FBS_I and FBS_II (+), where the numbers of symbols represents the P value (1 symbol: 0.01�P�0.05; 2 symbols: 0.001�P<0.01; 3 symbols: 0.0001�P<0.001; 4 symbols: P<0.0001).
3.2.2. PCA of hUCBP samples. PCA was used to classify the NMR spectral data and
revealed factors contributing to the variability between the three groups of data sets. The NMR data in the spectral area between 0.5 and 9.0 ppm was analysed with the water and citric acid spectral regions always excluded prior to PCA analysis and provided as input to the PCA algo-rithm. The algorithms extracts are the so called Principal Components (PC) that explain data similarity and variability. The hUCBP was first analysed independently of the FBS samples. The1H-NMR spectral data of all hUCBP samples (normalized by the total sum of the integral intensities) are plotted inFig 3A. The observed variations are confirmed by the 2D (PC1 vs. PC2) score plot inFig 3B, where the hUCBP samples are clearly scattered and one typical out-lier sample is also detected. Note that the first two PCs accumulated more than 97% of data variance (PC1 has 91.7% and PC2 has 5.9% amount of variance), therefore they are sufficient features to represent the data. The corresponding loadings plots for PC1 and PC2 inFig 3C
illustrate that sugars and lactate content are the main metabolites responsible for the diver-gence between the hUCBP samples.
3.2.3. PCA of hUCBP and FBS samples (FBS_I and FBS_II). Statistical analysis was
fur-ther applied to the1H-NMR spectra of all samples in order to identify the source of variability between the metabolic profiles of hUCBP, FBS_I and FBS_II. The1H-NMR spectral trajecto-ries of the hUCBP samples (blue colour) and FBS samples (red colour) groups are plotted in
Fig 4A. Visual data inspection shows the higher levels of glucose but lower of lactate, ethanol, acetates, and several amino acids (alanine, glutamate, valine, leucine, and isoleucine) in the hUCBP when compared to the FBS samples. A matrix with 19 columns (correspond to the samples) over the spectral area between 0.5 and 9.0 ppm with the water and citric acid spectral regions excluded was provided as input to the PCA algorithm. The 2D (PC1 vs. PC2) PCA score plot is depicted inFig 4B. The results illustrated the close similarity of FBS_I and FBS_II data sets (a well-defined cluster with overlapping samples) and revealed their separation from the hUCBP data (a scattered cluster) particularly with respect to PC2. PC1 contains 70% and PC2 23% of data variance, thus these two principal components are sufficient to represent the data information content. The corresponding loadings plots (Fig 4C) provide evidence that
glucose, lactate and acetates are the dominant metabolites contributing to the dissimilarity Fig 3. Metabolomic analysis of hUCBP samples. (A)1H-NMR spectral trajectories of the hUCBP samples; (B) 2D (PC1 vs. PC2) PCA score plot shows that hUCBP data are well clustered (i.e. there is high similarity between the donor samples) with exception of one donor (considered as an outlier) and (C) corresponding loadings plots illustrate that sugars and lactate content are the main metabolites responsible for the divergence between the hUCBP samples.
between the human plasma (hUCBP) and bovine sera (FBS_I and FBS_II) data sets. Loading plots around zero line suggest close behaviour of the metabolites profiles in the spectral region from 9.0 ppm to 5.3 ppm of the three groups of samples (hUCBP, FBS_I and FBS_II samples). These results coincide with those obtained from the1H-NMR spectral analysis of the samples.
3.2.4. PCA of hUCBP samples and FBS samples (FBS_I and FBS_II) excluding glucose and lactate spectral areas. In order to assess intrinsic variations in the content of
proteino-genic amino acids, lipids and organic acids and derivatives between hUCBP, FBS_I and FBS_II samples, the same PCA analysis was applied on the1H-NMR data after exclusion of glucose (5.28 ppm—4.65 ppm; 4.17 ppm—3.24 ppm) and lactate (1.37 ppm—1.32 ppm) spec-tral areas. The1H-NMR spectral trajectories are plotted inFig 5Aand the PCA score plot is shown inFig 5B. The hUCBP samples analysis was less scattered, while the FBS_I and FBS_II samples continued to behave as a well-shaped cluster. This observation suggests that glucose and lactate concentrations significantly vary between the hUCBP samples of different donors and their exclusion increased the metabolite profiles proximity. The hUCBP and FBS (FBS_I and FBS_II) samples clusters diverge mainly in the PC2 score (representing only 13% of data variance) and have a very close PC1 score (representing 80% of data variance). The respective loading plots (Fig 5C) confirm these results. They illustrate that the main differences between the hUCBP and FBS data are due to different concentrations of particular amino acids (ala-nine, glutamate, isoleucine, leucine, and valine) and organic acids and derivatives (N-acetyl residues, 3-hydroxybutyric acid, and creatine) in the spectral region from 3.3 ppm to 0.5 ppm. From the spectral intervals where the loading plots are close to zero, i.e. from 9.0 ppm to 3.3 ppm, with the glucose spectral area excluded, it can be concluded that the metabolites pro-files of the three groups (hUCBP, FBS_I and FBS_II samples) are similar.
PCA analysis was performed in three different scenarios based only on the first two Princi-pal Components (PC).Fig 6illustrates that PC1 and PC2 accumulate more than 90% of data variability and therefore their statistical significance is reliable.
Fig 4. Metabolomic analysis of hUCBP and FBS samples. (A)1H-NMR spectral trajectories of the hUCBP samples (blue colour) and FBS (FBS_I and FBS_II samples) (red colour) groups; (B) 2D (PC1 vs. PC2) PCA score plot shows close similarity of FBS_I and FBS_II data (a well-defined cluster with overlapping samples) and a separation from the hUCBP data and (C) corresponding loadings plots illustrate that glucose, lactate and acetates are the main metabolites contributing to the dissimilarity between the human plasma (hUCBP) and bovine sera (FBS_I and FBS_II) samples. Loading plots around zero line suggest close behaviour of the metabolites profiles in the spectral region from 9.0 ppm to 5.3 ppm of the three groups of samples (hUCBP, FBS_I and FBS_II samples).
3.3. Part II:
In vitro validation
3.3.1. Cell viability assessment. The application of hUCBP as a culture medium
supple-ment forin vitro culture and expansion of hMSCs was evaluated using UC-MSCs and DPSCs.
Fully characterised cell lots were used for the purpose. PrestoBlue1viability test was
Fig 5. Metabolomic analysis of hUCBP and FBS samples excluding glucose and lactate spectral areas. (A) The1H-NMR spectral trajectories; (B) the PCA score plots shows that the hUCBP samples (a well-defined cluster) and the FBS samples (also a well-defined cluster) are less divergent now (they all have a very close PC1 score) and (C) respective loading plots illustrate that the main differences between the hUCBP and FBS data are due to different concentrations of particular amino acids (alanine, glutamate, isoleucine, leucine, and valine) and organic acids and derivatives (N-acetyl residues, 3- hydroxybutyric acid, and creatine) in the spectral region from 3.3 ppm to 0.5 ppm. For spectral area between 9.0 ppm to 3.3 ppm (with excluded glucose) the metabolites profiles of the three groups (hUCBP, FBS_I and FBS_II samples) are very similar.
https://doi.org/10.1371/journal.pone.0203936.g005
Fig 6. PC contributions for data representation.
undertaken at determined time points and the supernatant absorbance was measured, normal-ized and corrected according to manufacturers’ instructions. Corrected absorbance values are presented inS2 Table, in Supporting information.
The FBS_II supplemented samples were set as the reference control for the behaviour of hUCBP test samples. Obtained results are graphically presented inFig 7and absorbance data is available inS2 Table, in Supporting information.
At 24 hours, UC-MSCs cultures with hUCBP at 4% depicted significantly superior mea-surements concerning % of cell viability and absorbance, when compared to 10% FBS_II, cor-responding to a 200.02% increase over the FBS_II control at that time point. DPSCs presented similar behaviour in most of the tested groups, with no significant differences from the FBS_II control. Here, only the hUCBP 8% group presented inferior measurements (76.28% of cell via-bility. At 72 hours in culture, UC-MSCs in both hUCBP 2% and hUCBP 4% raised the absor-bance to 73.59% and 67.86% over the matched control, respectively. In the DPSCs set, all groups performed superiorly, to the FBS control. In the following time point of 120 hours, no statistical differences were found between the tested groups, for hMSCs from both sources. Maximum measurements were obtained at 168 hours in culture with UC-MSCs at hUCBP 6% and hUCBP 8%, matching 10% FBS_II. On the other hand, hUCBP 4% remained superior to 10% FBS_II control. In the DPSCs, only hUCBP 6% performed comparably to 10% FBS_II, with all other tested groups presenting inferior corrected absorbances.
Both hMSCs types reached the plateau before 216 hours in culture, and hence, metabolic rates (and resazurin reduction) arrested. In all cell culture groups, including the 10% FBS_II, a decrease of the corrected absorbance measurements was observed. Only UC-MSCs cultured in hUCBP 4% supplemented medium sustained activity matching the control.
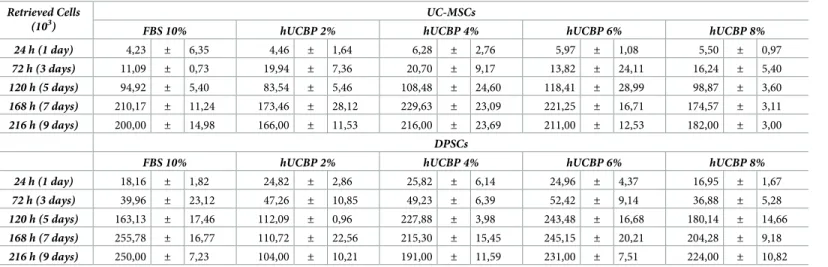
Absorbance intensity is correlated to the metabolic activity of cells and not directly to their number, but superior number of cells relate to increased viability readings. Retrieved cells numbers and viability (total cell numbers and life cell numbers recovered) by Trypan blue exclusion assay at 24 hours (1day), 72 hours (3 days), 120 hours (5 days), 168 hours (7 days), and 216 hours (9 days) are presented inTable 3.
3.3.2. Senescence and apoptosis. The assessment ofβ-Galactosidase activity as an indica-tor of senescent decline of hMSCs’ populations cultures in hUCBP supplemented media revealed no striking differences when compared to FBS supplemented control media, for both assayed populations (Fig 8AandS3 Table, in Supporting information). Exception was noted
for cultured UC-MSCs, at 5 days in culture, where FBS supplemented groups displayed increasedβ-Galactosidase activity when compared to 4 and 8% hUCBP supplemented groups.
Annexin-V/ PI assay was employed for the detection and definition of apoptosis in cultured cells. Early apoptosis is characterized by plasma membrane reorganization, detected by posi-tive staining for Annexin V, while later stage of apoptosis presents membrane damage, there-fore PI can bind to DNA in cytoplasm resulting in positive staining for both Annexin V and PI [53]. Cells cultured under hUCBP or FBS supplementation revealed no significant differences in Annexin-V or PI staining, with exception to hUC-MSCs cultured in hUCBP 8% supplemen-tation (�), which presented increased early apoptosis events, and decreased overall cell viability
over the remaining UC-MSCs’ groups (% Viable cells (An-PI-): 99,50± 0,06; 99,40 ± 0,06; 92,93± 0,52; 99,37 ± 0,13, and % Early apoptosis (An+PI-): 0,29± 0,03; 0,40 ± 0,04; 6,42 ± 0,53; 0,47± 0,07, for 4%, 6%, 8% hUCBP and 10% FBS supplemented media) (Fig 8BandS4 Table
in Supporting information).
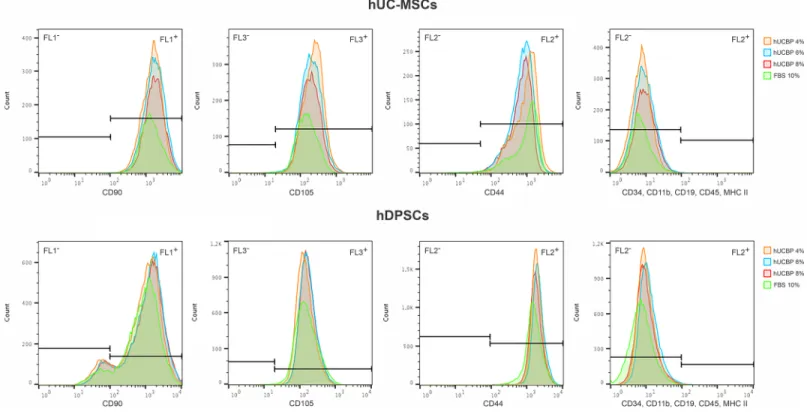
3.3.3. MSCs’ Phenotype identity. The surface marker profiles of UC-MSCs and DPSCs
cultured in either hUCBP or FBS supplemented media were assessed though Flow Cytometry. MSCs populations presented characteristic MSCs phenotypical markers in all culturing condi-tions (Fig 9andTable 4), and although some slight differences are noted, populations remain
Fig 7. Corrected absorbance readings hUC-MSCs and hDPSCs viability. (A) Corrected absorbance at each assessed time point of the hUC-MSCs cultured in 10%
FBS_II, hUCBP 4%, 6% and 8%. (B) Corrected absorbance at each assessed time point of the hDPSCs cultured in 10% FBS_II, hUCBP 4%, 6% and 8%. Values are presented as Mean± SEM. Statistically differences were analysed for each hUCBP test samples versus control (10% FBS_II supplemented medium) and presented with one to four symbol (�) (�: 0.01�P�0.05;��: 0.001�P<0.01;���: 0.0001�P<0.001;����: P<0.0001).
within the � 92% positive population for CD90, CD105 and CD44, and � 2% negative stain-ing for CD34, CD11b, CD19, CD45 and MHC II. Remarks are to be made regardstain-ing the CD90 expression by hDPSCs, which presented only 87–91% positive population, contrasting with 99–100% expressing population of hUC-MSCs.
3.3.4.Gene expression. Gene expression was performed through RT-qPCR analysis. Total
RNA was successfully extracted from cultured hMSCs (S5 Table, in Supporting information)
and specific genes’ expression assessed, after 5 days in specific culturing media conditions. CD34 and Sox2 were undetected in any of the samples from hUCBP or FBS cultured cells, in either population. Strong expression (<29 Cq) of CD105 and CD166, and moderate expres-sion (30–35 Cq) of CD115 were detected in all assayed groups, and no change in expresexpres-sion was observed in differently supplemented UC-MSCs and DPSCs cultures. Particular changes in fold-expression of specific genes was identified in hMSCs from each source (Fig 10andS6 Table, in Supporting information). In UC-MSCs, CD90 and MHC class I were
down-regu-lated in all hUCBP supplemented groups (although maintaining a strong expression), and moderately expressed OCT-4 was down-regulated in the highest % supplementation groups (6 and 8%). Expression of MHC class II sequence was not detected in 10% FBS supplemented cul-tures, while it became weakly expressed (>35 Cq) in hUCBP supplemented groups. In DPSCs, strong and moderate expression of CD73 and OCT-4, respectively, was observed in 10% FBS and up-regulated in hUCBP supplementation groups. Contrarily, weak expression of MHC class II was detected in 10% FBS supplemented hDPSCs, that tended to attenuate (down-regu-late) in hUCBP supplemented groups.
3.3.5. Multilineage differentiation. Osteogenic differentiation—Macroscopic
observa-tion revealed strong Alizarin Red S staining in the FBS supplemented Osteogenic media groups, in both UC-MSCs and DPSCs. All Undifferentiated control groups presented weak ARS staining. Whereas, in all hUCBP supplemented Osteo-differentiation groups, in both cell types, weak ARS staining was observed, not empirically distinguishable from respective control groups. Observation suggest an effective osteo-differentiation and mineral matrix deposition by hMSCs cultures in Osteogenic media containing FBS, while hUCBP supplemented groups did not differentiate towards the intended lineage, after 21 days in specific culture (data not shown). ARS binding quantification confirmed these observations (Fig 11A). Some of the Table 3. Retrieved cell numbers (x 103) assessed by Trypan Blue exclusion dye assay of hMSCs (UC-MSCs and DPSCs), in the presence of supplemented medium
with FBS_II or variable concentrations of hUCBP after 24 hours (1day), 72 hours (3 days), 120 hours (5 days), 168 hours (7 days), and 216 hours (9 days) incubation.
Results presented as Mean± SEM. Retrieved Cells
(103) UC-MSCs
FBS 10% hUCBP 2% hUCBP 4% hUCBP 6% hUCBP 8%
24 h (1 day) 4,23 ± 6,35 4,46 ± 1,64 6,28 ± 2,76 5,97 ± 1,08 5,50 ± 0,97 72 h (3 days) 11,09 ± 0,73 19,94 ± 7,36 20,70 ± 9,17 13,82 ± 24,11 16,24 ± 5,40 120 h (5 days) 94,92 ± 5,40 83,54 ± 5,46 108,48 ± 24,60 118,41 ± 28,99 98,87 ± 3,60 168 h (7 days) 210,17 ± 11,24 173,46 ± 28,12 229,63 ± 23,09 221,25 ± 16,71 174,57 ± 3,11 216 h (9 days) 200,00 ± 14,98 166,00 ± 11,53 216,00 ± 23,69 211,00 ± 12,53 182,00 ± 3,00 DPSCs
FBS 10% hUCBP 2% hUCBP 4% hUCBP 6% hUCBP 8%
24 h (1 day) 18,16 ± 1,82 24,82 ± 2,86 25,82 ± 6,14 24,96 ± 4,37 16,95 ± 1,67 72 h (3 days) 39,96 ± 23,12 47,26 ± 10,85 49,23 ± 6,39 52,42 ± 9,14 36,88 ± 5,28 120 h (5 days) 163,13 ± 17,46 112,09 ± 0,96 227,88 ± 3,98 243,48 ± 16,68 180,14 ± 14,66 168 h (7 days) 255,78 ± 16,77 110,72 ± 22,56 215,30 ± 15,45 245,15 ± 20,21 204,28 ± 9,18 216 h (9 days) 250,00 ± 7,23 104,00 ± 10,21 191,00 ± 11,59 231,00 ± 7,51 224,00 ± 10,82 https://doi.org/10.1371/journal.pone.0203936.t003
differentiating groups presented no statistical difference towards the respective undifferenti-ated controls (S7andS8Tables, in Supporting information). Furthermore, the
semi-quantita-tive analysis points towards an increased efficiency in the Osteogenic differentiation of DPSCs when compare to UC-MSCs, under the same differentiating conditions (2299.31± 7.35 μM and 1449.57± 0.00 μM of ARS, respectively).
Adipogenic differentiation—Microscopic observation of ORO stained cells evidenced
comparable lipid droplets accumulation in the FBS supplemented Adipogenic media groups, in both UC-MSCs and DPSCs. Controls presented occasional lipid droplets accumulation. All hUCBP supplemented Adipo-differentiation groups presented similar differentiation pattern to FBS supplemented groups, amongst all groups of UC-MSCs and DPSCs. Cellular popula-tions maintained in hUCBP presented lipid droplets accumulation in the cytoplasm (data not shown). Spectrophotometric measurement of ORO staining indicated no significant difference between different supplementation levels and/or FBS, within each cell type. However, control groups maintained in hUCBP indicate significantly superior ORO staining over FBS supple-mented controls (Fig 11BandS9andS10Tables, in Supporting information).
Fig 8. Senescence and Apoptosis: A) Senescence -β-Galactosidase activity (OD405nm) on UC-MSCs and DPSCs at 3, 5 and 7 days. Results Presented as Mean± SEM. Significance of the results is indicated according to P values with one, two, three or four of the symbols (�) corresponding to 0.01�P<0.05; 0.001�P< 0.01; 0.0001�P<0.001 and P<0.0001, respectively; B) Apoptosis: Annexin-V/ PI detection of UC-MSCs (upper panel) and DPSCs (lower panel). Results Presented as Mean± SEM. Dot Plots of the correspondent data are presented at the right side of the panels. Top left quadrants match annexin V negative and PI positive cells; Top right quadrants correspond to dead cells that express annexin V and PI positive; Bottom right quadrants pairs with apoptotic cells that express annexin V positive and PI negative; and for last, bottom left quadrants, viable cells that express neither annexin V or PI.
https://doi.org/10.1371/journal.pone.0203936.g008
Fig 9. Surface marker expression for MSCs’ identity of hUC-MSCs and hDPSCs, assessed by Flow cytometry.
Chondrogenic differentiation—Groups cultured in Chondrogenic Differentiation media
all presented marked light blue staining under macroscopic and microscopic observation, indicating proteoglycan deposition. Control groups from DPSCs in UCBP and FBS remained unstained, indicating no differentiation, as did UC-MSCs in FBS supplemented media. Con-trol groups of UC-MSCs maintained in hUCBP for the assay period presented mild Alcian blue staining and aggregation, suggesting formation of chondrogenic pellets and deposition of proteoglycan rich matrix (data not shown). UC-MSCs and DPSCs maintained in FBS supple-mented control media presented no difference in terms of GAGs production, and cells transi-tioned to differentiating media after 3 days showed increased GAGs production,
demonstrating differentiation towards a chondrogenic phenotype, with no significant differ-ences between cell types (Fig 11CandS11andS12Tables, in Supporting information). Cells
expanded in hUCBP at different concentrations and transitioned to Chondrogenic differentia-tion media, displayed comparable GAGs producdifferentia-tion. In the DPSCs, cell maintained in hUCBP for the 14 days of the differentiation period did not differ from the ones maintained in FBS 10%. Undifferentiated controls of UC-MSCs’ maintained in the hUCBP supplemented media Table 4. Surface marker profiles of hUC-MSCs and hDPSCs cultured in either hUCBP or FBS supplemented media, assessed though Flow Cytometry.�NEG+ cock-tail corresponds to anti-CD34; -CD11b; -CD19; -CD45; and -MHC II antibodies.
Surface Markers hUC-MSCs
hUCBP 4% hUCBP 6% hUCBP 8% FBS 10%
CD90+ 99,90 ± 0,00 99,83 ± 0,03 99,87 ± 0,03 99,23 ± 0,12
CD105+ 99,97 ± 0,03 99,77 ± 0,03 99,87 ± 0,03 99,07 ± 0,09
CD44+ 99,47 ± 0,09 99,40 ± 0,15 99,27 ± 0,20 95,70 ± 1,65
NEG+� 0,05 ± 0,01 0,14 ± 0,04 0,25 ± 0,14 0,13 ± 0,08
hDPSCs
hUCBP 4% hUCBP 6% hUCBP 8% FBS 10%
CD90+ 90,23 ± 0,45 90,70 ± 0,15 90,67 ± 0,07 90,50 ± 0,35
CD105+ 99,90 ± 0,00 100,00 ± 0,00 99,97 ± 0,03 99,30 ± 0,06
CD44+ 99,97 ± 0,03 99,80 ± 0,00 99,83 ± 0,03 99,80 ± 0,00
NEG+� 0,37 ± 0,03 0,52 ± 0,05 0,52 ± 0,09 0,13 ± 0,04
https://doi.org/10.1371/journal.pone.0203936.t004
Fig 10. Quantitative RT-PCR of UC-MSCs and DPSCs cultured in hUCBP or FBS supplemented media. RQ: relative quantification (fold change compared to the
FBS 10% group), in mean fold change± SEM. https://doi.org/10.1371/journal.pone.0203936.g010
demonstrated a tendency to produce increased GAGs, when compared to controls, with mean values approaching differentiated groups, and not being significantly different from these. Fig 11. Multilineage differentiation: A) Osteogenic differentiation: Alizarin Red S concentration (μM) after 21 days; B) Adipogenic differentiation: Oil Red O (OD570nm) after 14 days; and C) Chondrogenic differentiation: Sulfated GAGs production (μg/mL) after 14 days, assessed by Blyscan™ Glycosaminoglycan Assay (Biocolor, UK). Control: Undifferentiated control; Results Presented as Mean± SEM. a: significantly different from undifferentiated group within the same media condition and cellular population; b: undifferentiated control group significantly different from undifferentiated FBS 10% group, within the cellular population; c: differentiated group significantly different from differentiated FBS 10%, within the cellular population.