Computer Aided Detection of
Perforating Arteries in CT Angiography
Ricardo Jorge Terroso de Araújo
Mestrado Integrado em Bioengenharia Supervisor: Hélder Filipe Pinto de Oliveira, PhD Co-Supervisor: Maria Antónia Vasconcelos, MD
As mulheres que sofrem de cancro da mama são frequentemente submetidas à mastectomia. A perda desse orgão representa um peso emocional importante nas suas vidas. Os métodos de re-construção existentes permitem ultrapassar parte dessa perda e diferentes opções estão disponíveis. Estas podem ser divididas em dois grandes grupos: próteses e uso de tecido autólogo. O último grupo representa uma solução comum, uma vez que o seu uso numa cirurgia de reconstrução tem um carácter mais natural e permanente. Apesar desse tecido poder ser colhido de diferentes locais do corpo, a escolha mais comum é a região abdominal. O retalho DIEP (perfurante da artéria epi-gástrica profunda), baseado em artérias perfurantes, é a atual técnica padrão para fazer esse tipo de reconstrução, uma vez que permite uma boa vascularização e não envolve remoção de tecido mus-cular. No entanto, torna necessária a realização de estudos imagiológicos antes do ato cirúrgico, de forma a criar um mapa dos vasos perfurantes e extrair as suas características, o que é essencial para planear a intervenção cirúrgica. Das diferentes técnicas de imagiologia propostas para o estudo, a Angiografia por Tomografia Computadorizada (Angiografia CT) é considerada a modalidade padrão, principalmente devido à sua alta resolução e porque é independente do operador.
Atualmente, a informação relevante dos vasos perfurantes é extraída por um técnico ou um radiologista, após realização da Angiografia CT. Um relatório é elaborado e o cirurgião decidirá a sua abordagem consoante a informação nele presente. Este processo é inerentemente subjetivo e leva a incoerências entre o que é reportado antes da cirurgia e o que é encontrado no bloco operatório. Assim sendo, um método capaz de extrair a informação necessária de forma precisa e objetiva tornaria o processo mais eficaz.
O objetivo desta tese é apoiar a atividade do clínico, através do desenvolvimento de um algo-ritmo de deteção assistida por computador que permite extrair as informações necessárias de forma precisa, objetiva e semi-automática. A metodologia proposta começa por extrair pontos ao longo da porção subcutânea da perfurante através de um filtro de Kalman que combina informação re-sultante da análise dos vetores de gradiente locais e uma característica proveniente da imagem 2D da secção transversal da perfurante. A extração do esqueleto termina assim que o processo atinge a fáscia e o último ponto é considerado o local em que o vaso perfura esta camada. Além disso, o calibre é também estimado, de acordo com medidas obtidas ao longo do processo de deteção do esqueleto. Finalmente, a porção intramuscular das perfurantes é detetada através de um algoritmo de caminhos mínimos. Os resultados mostram que a metodologia proposta extraiu corretamente o percurso dos vasos perfurantes. As regiões subcutânea e intramuscular foram estimadas com um erro médio de 1.35 mm e 1.06 mm, respetivamente. Ainda assim, alguns aspetos merecem foco no futuro, de forma a garantir que algumas das informações necessárias pelo clínico, como o calibre por exemplo, estão a ser devidamente calculadas.
Women diagnosed with breast cancer are commonly submitted to mastectomy. The loss of the breast(s) brings a heavy loss to their life. Reconstruction methods allow to overcome an important part of this loss and several options exist. The more natural and permanent character of autologous tissue flaps when compared to implants, makes the former a common solution for the reconstruc-tion procedure. Although the tissue can be collected from different regions of the body, abdominal flaps are preferred to reconstruct the breast shape. The Deep Inferior Epigastric Perforator (DIEP) flap is the current state-of-art method to conduct such type of reconstruction, given that it allows a proper blood supply and decreases the abdominal wall morbidity. However, such technique re-quires preoperative imaging studies, in order to create a map of the abdominal perforator vessels and to extract their characteristics, which are essential to design a suitable flap. From the several imaging techniques proposed for the effect, Computerized Tomographic Angiography (CTA) is regarded as the state-of-art modality, mainly due to its high resolution and operator independent acquisition.
Currently, the relevant information of the perforators is extracted by a technician or a radiol-ogist after acquiring the CTA data from the patients. Then, a report is created and the surgeon will act according to it. Thus, this process is inherently subjective and might create incoheren-cies between the preoperative and surgical findings. A method capable of retrieving accurately the required information in an objective and automatic way would bring a major benefit to this process.
The goal of this thesis is to support the clinician activity, with the development of a Computer Aided Detection (CAD) algorithm which is able to detect the required characteristics of the Deep Inferior Epigastric Artery (DIEA) perforators in an accurate, objective and semi-automatic way. The proposed methodology starts by tracking the subcutaneous portion of the perforator using a Kalman filter to join the information given by local gradient vectors and a 2D cross section feature. The tracking procedure ends as soon as it reaches the fascia, being the last point the estimation of the location where the vessel perforates this layer. Besides, the caliber is also estimated according to measures extracted throughout the tracking iterations. Finally, the intramuscular portion of the perforator is extracted using a 3D minimum cost path approach. The results show that the methodology was able to correctly detect the course of the DIEA perforators. The mean error of the extracted courses was 1.35 mm for the subcutaneous portion and 1.06 mm for the intramuscular one. Nonetheless, some aspects still need to be focused in the future, in order to guarantee that some of the information required by the clinician, e.g. the caliber, is being accurately retrieved.
Começo por agradecer a todos os que fizeram e/ou fazem parte da minha vida, pois a pessoa que sou hoje deve-se a todos eles.
Esta dissertação é o culminar de muitos esforços direccionados para um objetivo comum. Ao Hélder, que foi incansável no seu papel de orientador. Esteve sempre ali ao lado a apoiar, motivar e apontar o melhor caminho a seguir. Ao João Teixeira, pelas sessões de brainstorming inspiradoras e por todo o apoio que sempre deu. Ao António, que se juntou aos nossos devaneios e pelo percurso que fomos percorrendo juntos. A vocês, Pedro Ferreira, Kelwin, João Monteiro, Eduardo e Ana, por me fazerem sentir que nunca saí de casa. Um obrigado ao Prof. Jaime pela chance de trabalhar com o grupo VCMI e pela sua capacidade de construir uma verdadeira equipa de trabalho. Quero agradecer também à Unidade de Mama do Centro Clínico Champalimaud por possibilitar a realização desta tese, e deixo um agradecimento especial à Dra. Maria Antónia pela cooperação.
À Catarina por todas as etapas que passámos juntos nesta vida universitária e por ter estado sempre presente, nos melhores e piores momentos. Um obrigado por todos os sorrisos que par-tilhámos. À Cláudia, ao Pedro, à Sofia e à Tânia, uma vez que foram pilares para mim ao longo deste percurso. Obrigado pelos bons momentos que passámos e pelas noitadas na FEUP que enfrentámos com um sorriso cansado na face.
Ao João por tudo o que caminhámos lado a lado. Por todos os momentos em que a vida pregou partidas e fomos capazes de estar lá a apoiarmo-nos. Pela infância feliz que tanta nostalgia me traz. Ao Bruno pelas gargalhadas fáceis e por estar sempre presente. Por toda a força e motivação que sempre transmitiu. Agradeço-vos por todas as histórias que vivemos. Ao Nuno pelo apoio que me deu nesta fase e pela alegria que sempre transmitiu.
À minha família, que sempre me apoiou e me possibilitou ser feliz. Aos meus avós, que me viram e fizeram crescer. Espero continuar a deixar-vos orgulhosos de mim e estou eternamente grato por tudo o que fizeram e fazem por mim. Aos meus tios e aos meus primos por me apoiarem em todas as situações. Ao meu primo João por todos os momentos que passámos juntos e por ser como um irmão para mim. Ao meu pai, que sei que tinha um orgulho enorme em mim e me dá a força necessária para ultrapassar as situações mais adversas. Espero ser quem tu gostavas que eu fosse. À minha mãe, por tudo o que foi capaz de enfrentar para nunca me faltar nada, e por ter sempre acreditado em mim. Nunca te poderei agradecer o suficiente, mas todos os dias dou o meu melhor por ti.
Ricardo Araújo
William Shakespeare
1 Introduction 1 1.1 Motivation . . . 2 1.2 Objectives . . . 2 1.3 Contributions . . . 2 1.4 Document structure . . . 3 2 Background 5 2.1 Abdominal Wall Anatomy . . . 5
2.1.1 Abdominal region location and vascularization . . . 5
2.1.2 Deep Inferior Epigastric Artery (DIEA) anatomy . . . 7
2.1.3 Summary . . . 9
2.2 Breast Reconstruction . . . 9
2.2.1 Implant based reconstruction . . . 9
2.2.2 Autologous Reconstruction . . . 10
2.2.3 Summary . . . 13
2.3 Preoperative Imaging Studies . . . 15
2.3.1 Continuous-wave Doppler US . . . 15
2.3.2 Color Doppler US . . . 16
2.3.3 Computed Tomographic Angiography . . . 17
2.3.4 Magnetic Resonance Angiography . . . 18
2.3.5 Summary . . . 18 3 Literature Review 21 3.1 Vascular models . . . 21 3.1.1 Appearance models . . . 21 3.1.2 Geometric models . . . 22 3.1.3 Hybrid models . . . 22 3.2 Image Features . . . 23
3.2.1 Local isotropic features . . . 23
3.2.2 3D local geometry features . . . 23
3.2.3 2D cross section features . . . 25
3.3 Extraction schemes . . . 26
3.3.1 Region growing approaches . . . 26
3.3.2 Active contour methods . . . 27
3.3.3 Centerline based approaches . . . 27
3.4 Summary . . . 29 ix
4 Database and Region of Interest 31
4.1 CTA volumes . . . 31
4.2 Volume of interest . . . 33
4.3 Ground truthannotations . . . 33
4.4 Summary . . . 33
5 Computer Aided Detection of Abdominal Perforators 37 5.1 Segmentation of the Anterior Abdominal Wall Fascia . . . 37
5.1.1 Manual annotations of the Fascia . . . 39
5.1.2 Proposed methodology . . . 39
5.1.3 Results . . . 47
5.1.4 Summary . . . 48
5.2 Perforator Subcutaneous Course Tracking . . . 49
5.2.1 Initialization . . . 49 5.2.2 Tracking procedure . . . 49 5.2.3 Caliber estimation . . . 54 5.2.4 Ending criteria . . . 57 5.2.5 Results . . . 57 5.2.6 Summary . . . 60
5.3 Perforator Intramuscular Course Detection . . . 65
5.3.1 A* search algorithm . . . 65 5.3.2 Terrain costs . . . 65 5.3.3 Performance Optimization . . . 67 5.3.4 Results . . . 69 5.3.5 Summary . . . 71 6 Conclusion 77 6.0.1 Future Work . . . 78 A Ground Truth annotation protocol 79 B Fascia segmentation results 83 C Perforator subcutaneous region tracking results 85 D Perforator intramuscular course detection results 89
2.1 Location of the abdominal cavity. Adapted from [15]. . . 6
2.2 Abdominal wall deep vascularization. Adapted from [15]. . . 6
2.3 Origin of the DIEA from the external iliac artery. Adapted from [16]. . . 7
2.4 DIEA classification described by Moon and Taylor. Adapted from [10]. . . 8
2.5 3D illustration of the course of a perforator. Adapted from [10]. . . 8
2.6 Reconstruction with pedicled TRAM flap. The flap is rotated on its vascular pedicle and extended upward from the lower abdomen to the mastectomy site (a), where it is sutured to the residual skin overlying the mastectomy defect (b). Adapted from [11]. . . 11
2.7 Reconstruction with free TRAM flap. (a) tissue is separated from abdominal blood supply and positioned over the mastectomy defect. (b) surgical reanastomosis of the perforating deep enferior epigastric vessels to breast site vessels is performed. Adapted from [11]. . . 11
2.8 Comparison of the blood supply in free TRAM, DIEP and SIEA flaps. Adapted from [11]. . . 15
2.9 Color Doppler Ultrasound of the abdominal wall vasculature. (A) Subcutaneous course of the perforator, superficial to the anterior rectus sheath (asterisk). (B) Subfascial and intramuscular course of the perforator (arrow), deep to the anterior rectussheath (asterisk). Adapted from [13]. . . 16
2.10 CTA of the abdominal wall vasculature. (A) Oblique 3D volume rendered image showing the subcutaneous portion of the DIEA perforators and superficial venous system. (B) sagittal MIP image showing intramuscular course of a perforator. Adapted from [13]. . . 17
2.11 MRA of the abdominal wall vasculature. The black and white arrows point to the intramuscular and subcutaneous course of DIEA, respectively. A, B and C are the MIP 3D reconstructions in axial, sagittal and obliquely slices, respectively. Adapted from [13]. . . 19
3.1 Modes of variation found by a single Point distribution model (PDM) and the combined model (TPDM) built from two illustrative input shapes. The latter is able to detect an additional mode of variation. Adapted from [44]. . . 22
3.2 (Top row) Orthogonal 2D slices through vessels with different radius; (Middle row) Corresponding intensity plots; (Bottom row) Intensity plots of the cylindrical intensity model. Adapted from [48]. . . 23
3.3 Second order ellipsoid describing the local principal directions of curvature. Adapted from [54]. . . 24
3.4 Vessel enhancement obtained at increasing scales (first four images) and the final result obtained after the scale selection. Adapted from [54]. . . 24
3.5 Specific structure enhancement by applying different filters. a) synthetic original image; b) enhanced junctions; c) enhanced junctions and vessels; d) enhanced nodules. Adapted from [56]. . . 25 3.6 Vessel wall detection through gradient based ray-casting features. Gradient
maxi-mum is selected for each ray. Adapted from [61]. . . 26 3.7 Segmentation using a region growing algorithm. From the left to the right, the
algorithm starts with a seed point and iteratively adds neighbor voxels that satisfy a certain inclusion criteria. Adapted from [35]. . . 26 3.8 Segmentation based on topology-adaptive snakes. (a) to (d) shows the evolution
of the snake. Adapted from [68]. . . 27 3.9 Representation of a tubular surface as the envelope of a family of spheres with
changing center points and radius. Adapted from [75]. . . 28 3.10 Vessel segmentation by propagation of waves of minimum cumulative costs. From
left to right: (a) source point, (b) eigenvalue filter response, (c) wave of cumulative costs at a certain instant and (d) extracted vessel. Adapted from [73]. . . 29 3.11 Vessel centerline extraction using ORG algorithm. (a) 2D image of a vessel where
the arrow indicates the seed point. (b) Obtained ORG graph. Adapted from [76]. 29 4.1 Anatomical planes of the body. Adapted from http://www.interactive-biology.com/. 31 4.2 Representation of a pile of axial slices where s1is the spacing between adjacent
pixels of a slice and s2is the spacing between consecutive slices. . . 32
4.3 Sequence of slices (not adjacent) from the pelvic region (a) to above the umbilicus area (d). . . 32 4.4 a,c,e) sequence of slices (not adjacent) showing our region of interest inside the
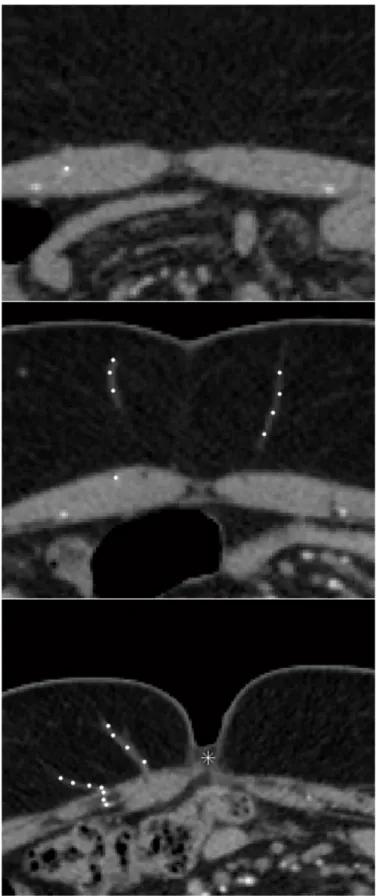
white boxes; b,d,f) corresponding regions of interest where important structures or areas are labelled: 1 right and left DIEA, 2 rectus abdominis muscle, 3 subcutaneous region, 4 skin tissue, 5 subcutaneous portion of a perforator, 6 -intramuscular portion of a perforator, 7 - umbilicus scar tissue. . . 34 4.5 Slices with example perforator annotations shown as white circles and umbilicus
position marked with a white asterisk. . . 35 5.1 Flowchart of the proposed framework. The first part is performed by the user and
the second is automatic. . . 38 5.2 Axial slices of the volume of interest. a) Slice at a lower region of the volume,
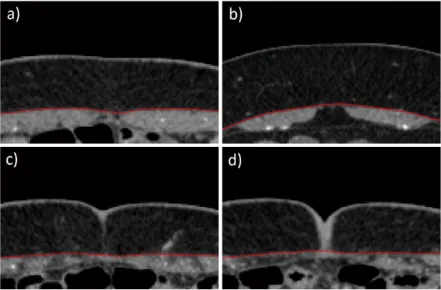
where red arrows indicate the DIEA sources; b-d) slices located above the first one, where red arrows localize the end of the subcutaneous region of example perforators. . . 39 5.3 Example axial slices with annotations of the anterior fascia in red. . . 40 5.4 Segmentations obtained using the threshold given by Otsu’s method [81] in the
images of Figure 5.3. . . 40 5.5 Illustration of the steps performed in stage 1, using images b,d) of Figure 5.3 as
example. a,e) initial images; b,f) segmentation using Otsu’s threshold; c,g) dilated mask of the region outside the patient body; d,h) segmentations after removing the skin object. . . 41 5.6 Illustration of the step performed in stage 2, using image b) of Figure 5.3 as
ex-ample. (left) Segmentation after stage 1; (right) stage 2 result, where the threshold was decreased until the biggest connected component spawned over all columns. 42
5.7 Illustration of the step performed in stage 3, using images b,d) of Figure 5.3 as example. a,c) segmentations after stage 2; b,d) segmentation results after filling the regions below the biggest connected and rejecting other objects. . . 42 5.8 Illustration of the test performed to check if the skin and muscle objects were
initially connected, using images b,d) of Figure 5.3 as example. a,d) segmentations after stage 3; b,e) OR between those segmentations and the skin object; c,f) biggest connected component after the OR operation. . . 43 5.9 Illustration of the steps performed in stage 4, using image d) of Figure 5.3 as
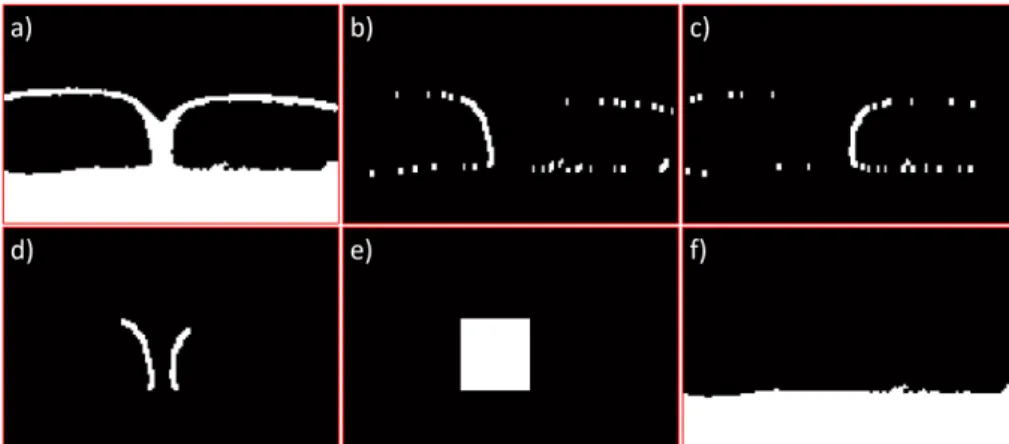
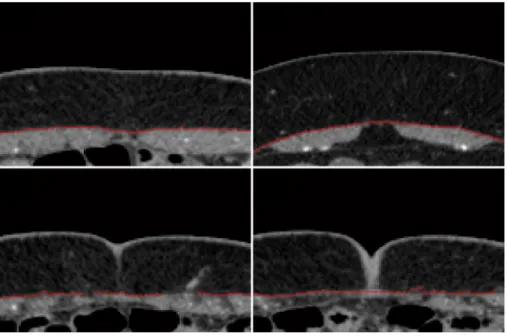
exam-ple. a) OR between the processed image at the end of stage 3 and the skin object; b,c) Sobel derivative responses; d) OR between biggest connected components of b) and c); e) rectangular mask containing the objects in d); f) segmentation result after removing object e) and the skin object. . . 43 5.10 Raw fascia segmentation of the example images of Figure 5.3. . . 44 5.11 Example sagittal slices of the volume of interest with the fascia segmentations
in red. a,c,e) raw segmentation obtained after phase 1; b,d,f) segmentation after phase 2 is employed. . . 45 5.12 Fascia segmentation after the second phase of the proposed algorithm. . . 46 5.13 Example slices where the biggest connected component is not the muscle object.
a,c) Segmentations using the threshold given by Otsu’s method; b,d) filled object after keeping the biggest connected component. . . 46 5.14 Comparison between the raw segmentation after phase 1 (a,d), the segmentation
after phase 2 using the least-squares local linear regression (b,e) and using the robust local linear regression (c,f). . . 47 5.15 Two axial slices of different regions of patient 4321 with fascia segmentations in
red. a,b) segmentations obtained with the least-squares regression; c,d) segmenta-tions obtained with the robust regression. . . 49 5.16 Slices showing example manual initializations (white) near the end of the
subcu-taneous portion of perforators. . . 50 5.17 Tubular structure which is brighter than the background and corresponding
gradi-ent vectors, represgradi-ented by red arrows. . . 51 5.18 Representation of an iteration of the tracking procedure. . . 51 5.19 Iteration of the tracking procedure without and with the presence of an offset,
respectively. . . 52 5.20 Example of the propagating offset error during the tracking procedure. . . 52 5.21 Diagram representing the prediction obtained by analyzing the local gradients,
c
CPt+1|t, and the correction measure, Zt+1. The final estimate CPt+1 is given by a
Kalman filter which fuses the information. . . 53 5.22 Cross section planes obtained with the proposed method. . . 53 5.23 Template for locating the ridge point. . . 54 5.24 Centerline point correction measure. a,b) initial cross section images; c,d)
gradi-ent vector fields; e,f) gradigradi-ent origradi-entation images (values in radians); g,h) inner product responses; i,j) center estimations. . . 55 5.25 Representation of the process to obtain the line (red) which goes along the axial
cross-section of the vessel. ννν ||A is the projection of ννν into the plane A. . . 56 5.26 Two examples of axial slices before and after the Kovesi [84] denoising. . . 57 5.27 Intensities along axial cross section lines before (left column) and after (right
col-umn) the Kovesi [84] denoising process. The x-axis represents the position in mm relative to the line center and the y-axis the intensity. . . 58
5.28 Gaussian fitting of the line intensity profiles considered as example in the right column of Figure 5.27. The x-axis represents the position in mm relative to the line center and the y-axis the intensity. . . 58 5.29 3D comparison between a tracked path (red) and Ground Truth annotations (blue).
The latter are more sparse than the first. . . 59 5.30 Perforator mapping. Adapted from [85]. . . 59 5.31 Slices of example case 1. Comparison between the Ground Truth (left column)
and the tracked path (right column). . . 61 5.32 Slices of example case 2. Comparison between the Ground Truth (left column)
and the tracked path (right column). . . 62 5.33 Slices of example case 3. Comparison between the Ground Truth (left column)
and the tracked path (right column). . . 63 5.34 3D comparison of the subcutaneous tracked paths (red) and Ground Truth (blue)
of the examples used in Figures 5.31, 5.32 and 5.33, respectively. . . 64 5.35 Slices showing the low SNR of an intramuscular perforator pathway, from its
ori-gin in the DIEA (a) to the location where it leaves the muscle (f). . . 66 5.36 Different slices of a patient volume (left column) and corresponding costs obtained
by applying the transform to the Frangi vessel probabilities (right column). Red arrows locate intramuscular vessels. . . 68 5.37 3D comparison between an extracted path (red) and Ground Truth annotations
(blue). The latter are more sparse than the first. . . 69 5.38 Examples of the existing offset in some cases of the Ground Truth annotation. Red
points show the calculated path and blue ones the Ground Truth locations. . . 70 5.39 Slices of example case 1. Comparison between the Ground Truth (left column)
and the extracted path (right column). . . 72 5.40 Slices of example case 2. Comparison between the Ground Truth (left column)
and the extracted path (right column). . . 73 5.41 Slices of example case 3. Comparison between the Ground Truth (left column)
and the extracted path (right column). . . 74 5.42 3D comparison of the extracted perforator pathways (red) and Ground Truth (blue)
2.1 Relevant perforator characteristics for planning the DIEP flap surgery. Adapted from [10]. . . 13 2.2 Advantages and disadvantages of the autologous reconstruction techniques.
Adapted from [11]. . . 14 5.1 Results obtained by the proposed fascia segmentation method. The mean
Eu-clidean and Hausdorff distances between the segmentations and the manual anno-tations, and the average execution time, are shown for each regression method. . 48 5.2 Results obtained by using the proposed tracking framework to detect the
subcuta-neous region of the perforators. . . 59 5.3 Results of the method proposed for the extraction of the intramuscular course of
perforators. . . 70 B.1 Fascia segmentation results for each of the individual volumes. . . 83 C.1 Results obtained using the proposed tracking framework to detect the
subcuta-neous region of each perforator. For some cases, the caliber was not available at the report, such that the error could not be measured. . . 85 D.1 Results of the method proposed for the extraction of the intramuscular course of
perforators. . . 89
1D One-Dimensional 2D Two-Dimensional 3D Three-Dimensional 4D Four-Dimensional
CAD Computer-Aided Detection CT Computerized Tomography
CTA Computerized Tomographic Angiography
DICOM Digital Imaging and Communications in Medicine DIEA Deep Inferior Epigastric Artery
DIEP Deep Inferior Epigastric Perforator MRA Magnetic Resonance Angiography MRI Magnetic Resonance Imaging ORG Ordered Region Growing
SIEA Superficial Inferior Epigastric Artery SNR Signal-to-Noise ratio
TRAM Transverse Rectus Abdominis muscle US Ultrasonography
Introduction
Breast cancer is a malignant tumour with origin in the breast tissue, as defined by the American Cancer Society. In the United States, it is the leading cause of cancer death in women aged 20 to 59 years, being only surpassed by lung cancer in higher ages. It is estimated that more than 230.000 new cases of breast cancer will affect women in the United States during 2016. This represents about 29% of all new cancer cases and 15% of all cancer deaths among women [1]. However, incidence rates vary around the world. In general, developed countries present higher rates than non-developed countries. In the latter, it is the most common cause of cancer mortality while in the former it is the second one, being exceeded by lung cancer. Developed countries possess more efficient early diagnosis and treatments which leads to a lower mortality rate (25%) than the verified in non-developed countries (37%) [2].
Women who were diagnosed with breast cancer have higher chance of suffering from anxiety and depression resulting from the fear of recurrence, body image disruption, sexual dysfunction and mortality concerns [3]. Although breast conservative methods have shown equivalent survival rates to mastectomy [4], the latter is still a highly recurrent procedure and has even been increasing in some institutions [5, 6, 7]. This might suggest that some patients consider the removal of the entire breast a safer approach to completely eliminate the tumour. The option to reconstruct the breast after mastectomy makes this idea more viable.
Reconstruction methods allow to recreate the breast shape, improving the way how women feel about themselves and their image after their breast(s) was(were) removed. Breast reconstruction rates vary greatly according to the country, region and socioeconomical ground of the patient [8]. The Deep Inferior Epigastric Perforator (DIEP) flap has become the state-of-art technique for autologous tissue breast reconstruction [9].
Medical imaging has been playing a huge role in breast reconstruction since microsurgery started to be required to perform techniques such as the DIEP flap. The viability of these flaps is related to several features of the included perforator(s) [10]. Then, preoperative imaging allows to plan the surgery according to the findings. A method capable of retrieving accurately the required information in an objective and automatic way would play a major role in the field.
1.1
Motivation
Many women affected by breast cancer undergo mastectomy in order to remove the tumour. The lack of breast or shape deformation brings a heavy loss to any woman, since this organ plays a major role throughout their life.
This raises the importance of breast reconstruction, as it allows to reconstruct the breast shape of a woman who did a mastectomy. It is possible to use implants or autologous tissue from other body parts such as tissue from the thighs or abdominal wall [11]. Autologous solutions have been evolving in order to reduce donor-site morbidity [12]. Designing a flap is a complex task, as it involves maximizing its blood supply while minimizing the damage inflicted to the donor tissue. Imaging techniques have been used to preoperatively analyze each patient abdominal wall anatomy, focusing on the vasculature [13]. This gives the surgeon the information he needs to design a good flap and perform the surgery. Computer Tomographic Angiography (CTA) is being used to study the patient anterior abdominal vasculature in order to identify the best flap available for reconstruction [10, 14]. Therefore, it would be useful to have a Computer Aided Detection (CAD) system which could automatically retrieve the caliber and course of the perforator vessels in an accurate and objective manner.
1.2
Objectives
This thesis aims to have an impact on current healthcare services in the area of Breast Reconstruc-tion, by improving the service given to a woman who undergoes mastectomy.
The goal is to support the clinician activity by developing a CAD tool capable of retrieving the necessary characteristics of the Deep Inferior Epigastric Artery (DIEA) perforators in an accurate, objective and semi-automatic manner. This allows to plan the surgery according to objectively retrieved data, instead of relying on subjective findings.
1.3
Contributions
The contributions of this thesis are the following:
• the Ground Truth annotation of the perforators included in the available database; • the proposal of a method for segmenting the anterior abdominal wall fascia;
• the development of a vessel tracking framework whose estimations are produced by a Kalman filter which fuses local volume gradient vector information with a correction mea-sure based on the vector gradient field divergence of the 2D cross section of the vessel; • the estimation of the caliber based on the combination of measures taken throughout the
• the formulation of an A* based pathfinding method for the detection of perforators intra-muscular course.
1.4
Document structure
This document is divided in 6 chapters. The present Chapter introduced the relevance of breast reconstruction and the motivation behind preoperative imaging studies. Besides, the objectives and contributions of this thesis were presented. Chapter 2 starts by describing the anatomy of the anterior abdominal wall and also presents a characterization of the most important breast recon-struction methods and preoperative imaging techniques. Chapter 3 covers the state-of-art of vessel segmentation approaches. In Chapter 4, a brief description of the available database is made. Chapter 5 explains in detail the developed framework for the detection of perforators course and their important characteristics. Finally, Chapter 6 is a conclusion of the findings achieved along this thesis.
Background
This Chapter presents a set of concepts which are important for this thesis. Section 2.1 briefly describes the abdominal wall anatomy, section 2.2 characterizes the existing breast reconstruction options and, finally, section 2.3 includes an overview of the available medical imaging techniques to perform the preoperative studies.
2.1
Abdominal Wall Anatomy
Section 2.2 will describe breast reconstruction methods that rely on tissue from the abdominal region. This requires that the reader is comfortable with the anatomy of the region, mainly the vasculature. In this section, a brief description of the anatomy of the abdominal wall is presented in subsection 2.1.1, following the description made in [15]. A more detailed characterization of the DIEA and its perforators is made in subsection 2.1.2, following [10].
2.1.1 Abdominal region location and vascularization
The abdomen is a region of the trunk, and is located right below the thorax. It is bounded superi-orly by the xiphoid process and costal margins, posterisuperi-orly by the vertebral column and inferisuperi-orly by the pelvic bones. It comprises a cavity known as abdominal cavity and its surrounding muscu-lomembranous walls. This region can be visualized in Figure 2.1.
Both superficial and deep regions of the abdominal wall are vascularized. More anteriorly, the superior part of the wall is supplied by branches of the musculophrenic artery, while the inferior region is supplied by the medially located superficial epigastric artery and the laterally placed internal thoracic artery. Posteriorly, the superior region of the wall is supplied by the superior epigastric artery while the inferior part is supplied by the medially placed inferior epigastric artery and the laterally placed deep circumflex iliac artery, both branches of the external iliac artery. The superior and inferior epigastric arteries enter the rectus sheath and anastomose with each other. This relation is represented in Figure 2.2.
Figure 2.1: Location of the abdominal cavity. Adapted from [15].
2.1.2 Deep Inferior Epigastric Artery (DIEA) anatomy
The DIEA has origin in the external iliac artery above the inguinal ligament and ascends along the medial margin of the abdominal inguinal ring (see Figure 2.3). Then, it pierces the transversalis fasciaand ascends between the rectus abdominis muscle and the posterior lamella of its sheath. Finally, it divides in several branches that anastomose with other arteries above the umbilicus.
Figure 2.3: Origin of the DIEA from the external iliac artery. Adapted from [16].
Moon and Taylor (1988) described three different patterns of the DIEA, according to the bifur-cation type. Type I, II and III have, respectively, one, two and three major trunks at the umbilicus level. These patterns are represented in Figure 2.4.
Despite the anatomical variations of the DIEA, the course that its perforators take is similar (Figure 2.5).
These perforators have origin at the DIEA and penetrate in the posterior surface of the rectus abdominisand can have variable intramuscular segment (important detail when planning surgery as shall be explained in Section 2.2). This segment is absent in cases where the artery penetrates a musculotendinous intersection. Usually, this segment perforates the anterior surface of the rectus sheath and the anterior layer of the fascial sheath. Alternatively, it can have a varying subfascial segment between those two regions. The subcutaneous segment may present several course and branching configurations and it involves several anastomoses with the superficial inferior epigas-tric artery (SIEA).
Figure 2.4: DIEA classification described by Moon and Taylor. Adapted from [10].
2.1.3 Summary
This section provided a brief description of the anatomy of the human body which is relevant to understand the content covered in this thesis. In the first subsection, the abdominal region was located in the body and its vasculature was analyzed. A higher focus was given to the anatomy of the DIEA and its perforators in the second subsection, since this thesis focuses on the segmentation of those vessels. Besides, the anatomical characteristics of the different perforators is crucial when designing a flap, as will be seen in Section 2.2.
2.2
Breast Reconstruction
Typically, breast reconstruction is performed during mastectomy or a short period after. If not, the process can still be undertaken years after the removal of the breast(s).
To reconstruct the breast shape, the surgeon has several alternatives, although the patient spe-cific situation might turn some of them more reliable. They include the use of artificial implants and flaps of different autologous tissues. Implants have been favored by surgeons but autologous tissue flaps are seeing their use increased in the last decades due to the evolution of microsurgery. This chapter describes the different possibilities for breast reconstruction and their advantages and disadvantages.
2.2.1 Implant based reconstruction
This option requires less surgery than flap reconstruction since it does not involve an additional donor site surgery. Even then, implants must be replaced from time to time, requiring multiple surgeries in the future [17].
Implants are a good option for women who:
• do not have extra belly tissue to use for flap reconstruction (same occurs in other regions of the body);
• want to avoid incisions and/or sacrifice muscle;
• do not need radiation therapy, since it might bring problems after implant reconstruction; • do not want to be submitted to longer operations;
• do not mind about surgically altering their natural breast in order to achieve symmetry. The implant might contain saline solution, silicone, or both. Silicone implants have two vari-ants: the first has a single chamber and the latter has a second chamber filled with saline solution posterior to the silicone filled chamber [11].
The reconstruction procedure also has two versions: the first consists in only one step, where the implant is inserted in a retropectoral position. The second has two steps, starting by the retropectoral insertion of a tissue expander which is gradually filled with saline solution until
the soft tissue stretches adequately; then the expander is removed and a permanent implant is put in its place. This approach is preferred for patients with little residual cutaneous tissue at the mastectomy defect and/or those at risk for suboptimal skin healing [11].
2.2.2 Autologous Reconstruction
Also called autogenous reconstruction, it uses tissue from another place in the body to reconstruct the breast. This tissue, also known as flap, contains skin, fat and in some cases, muscle, and it comes from the belly, the back, buttocks or inner thighs. In this description, only abdominal flaps are considered, since they are the most common for reconstructing the breast shape. The reasons behind such fact are the similarity between the tissues, high flap design versatility and associated low donor-site morbidity. Besides, the goal of the thesis is the segmentation of abdominal vessels, the DIEA perforators.
When the tissue is completely separated from its blood vessels, the flap takes the designation of free flap. When this is not the case and the tissue is moved under the skin, the term is pedicled flap. The latter kind of flaps have been around longer and are easier to perform, such that they tend to be widely available. Free flaps require surgeons capable of performing microsurgeries in order to attach tissue vessels to the breast ones, which is a skill that only some possess [17].
Autologous reconstruction has several advantages over implants:
• Lasts longer given that implants have to be replaced every 10 or 20 years;
• Similarity of tissues leads to natural feeling, although little sensation, at most, is achieved; • Foreign body reactions are avoided.
In the next subsections, different techniques for breast reconstruction using abdominal flaps are presented, namely the Transverse rectus abdominis Muscle (TRAM) flap, the DIEP flap and the SIEA flap.
2.2.2.1 TRAM flap
TRAM is a muscle located in the lower abdomen, between the waist and the pubic bone. In a TRAM flap, there is a reconstruction of the breast with a flap of the skin, fat and a portion of the underlying rectus abdominis. This kind of flap is the most common since most surgeons are already familiar with it and because the tissue is similar to the breast one [17]. TRAM flaps are considered to yield superior esthetic results in comparison with both the latissimus dorsi myocu-taneous flap and prosthetic implants [11]. There are different types of TRAM flaps:
• Pedicled TRAM flap (Figure 2.6): the tissue is moved under the skin up to the chest, keeping the blood vessels attached to their original blood supply in the abdomen. This kind of flap involves a large portion of the muscle and is also known as “muscle transfer” flap. Larger recovery periods are expected. One common problem with this kind of flap is that the moved tissue may not get enough blood circulation and there might occur partial flap loss [17].
• Free TRAM flap (Figure 2.7): blood vessels of the flap are carefully attached to blood vessels of the chest (thoracodorsal or internal mammary vessels), leading to a more robust vascular supply. Over time, it evolved to the “muscle-sparing” free TRAM flap. This in-volves even less invasive excision due to the precise identification and dissection of each DIEP vessel in the flap. It includes subcutaneous fat and skin such as the TRAM flap and the free TRAM flap, but it incompletely transects the rectus abdominis muscle [11].
Figure 2.6: Reconstruction with pedicled TRAM flap. The flap is rotated on its vascular pedicle and extended upward from the lower abdomen to the mastectomy site (a), where it is sutured to the residual skin overlying the mastectomy defect (b). Adapted from [11].
Figure 2.7: Reconstruction with free TRAM flap. (a) tissue is separated from abdominal blood supply and positioned over the mastectomy defect. (b) surgical reanastomosis of the perforating deep enferior epigastric vessels to breast site vessels is performed. Adapted from [11].
Although its popularity, according to [17], a TRAM flap is not adequate in some cases: • Women without extra belly tissue;
• Women who plan on getting pregnant;
• Women who are concerned about losing strength in their lower abdomen. 2.2.2.2 DIEP flap
A DIEP flap is similar to the already described muscle-sparing free TRAM flap, with the difference that no muscle is used to rebuild the breast. In this flap, fat, skin and blood vessels are cut from the wall of the lower belly and moved to the chest. As this technique involves microsurgery, it is not available at all institutions. Usually women recover more quickly and have a lower risk of losing abdominal strength with this kind of flap when comparing with the TRAM techniques [17]. Al-though patients do not perceive a significant difference between abdominal donor-site morbidity of free muscle-sparing TRAM flap and DIEP flap reconstructions [18], studies demonstrated greater measured abdominal strength in patients who had breast reconstruction with the latter [12, 19]. In the past few years, the DIEP flap has become the state-of-art in breast reconstruction [9], however, it should be avoided in the following cases [17]:
• Women who do not have enough extra belly tissue, although a “stacked” approach has been proposed;
• Women who already had certain abdominal surgeries;
• Women whose abdominal blood vessels are small or not in the best location to perform a DIEP flap.
A key element for a successful DIEP procedure is the correct choice of the perforator artery that perfuses the flap. This decision is the reason why the success rate is highly variable many times. Table 2.1 describes the relevant characteristics of the DIEA and its perforators that should be considered when planning the DIEP flap surgery.
Rozen et al. [20] observed a reduced intramuscular transverse distance (mean of 1.41 cm) for perforators of DIEA with type II branching pattern while for type III they observed the biggest distance (mean of 1.73 cm). The authors did not detect any association between branching pattern and number of perforators and found that type II were the most common (58%) while type III the most uncommon (16%). Therefore, preoperative knowledge of the DIEA branching pattern can aid the surgeon about which perforator and hemiabdomen to consider for the surgery.
2.2.2.3 SIEA flap
The SIEA flap is very similar to the DIEP flap, except that the vessels that are moved are different. In this case, no incision in the fascia is done, what is mandatory in the DIEP flap. This means that this flap does not disturb the muscle at all [17]. Besides the reasons stated for DIEP flap, most women are not eligible for this flap due to:
Table 2.1: Relevant perforator characteristics for planning the DIEP flap surgery. Adapted from [10].
• Superficial vessels have been cut during a C-section or hysterectomy; • Non-existence of the superficial system.
2.2.3 Summary
Breast reconstruction techniques give women who undergone mastectomy a chance to reconstruct the removed breast(s), which has a major impact in their life. Although implant based recon-struction is recommended for several situations and is widely used, generally it performs worse than autologous techniques in terms of approximating the natural breast texture. Abdominal flaps weaken the abdominal wall but, for many women, the required abdominoplasty is also seen as a procedure they would like to undergo. The DIEP flap technique was proposed to reduce the donor site morbidity and recovery time associated to the TRAM flaps, with the cost of requiring great surgical expertise. SIEA flaps disturb even less the abdominal wall and should be performed if the patient meets the required conditions, which is not common. These are the details that made the DIEP flap become the state-of-art technique for breast reconstruction using abdominal flaps. Figure 2.8 presents a comparison of the blood supply in free TRAM, DIEP and SIEA flaps. The advantages and disadvantages of these reconstruction techniques can be analyzed in more detail in Table 2.2.
T able 2.2: Adv antages and disadv antages of the autologous reconstruction techniques. Adapted from [11 ].
Figure 2.8: Comparison of the blood supply in free TRAM, DIEP and SIEA flaps. Adapted from [11].
2.3
Preoperative Imaging Studies
Since microsurgeries started to be used for tissue reconstruction, a great interest in preoperative imaging started to develop. At that time, the handheld Doppler Ultrasound probe was the most common imaging technique performed [13].
In order to achieve a successful DIEP reconstruction, the flap must be perfused by the right per-forator artery. The criteria that influence this are its location, caliber and intramuscular trajectory, as already described in Section 2.2. Flap failures and partial necrosis are believed to be related to the great variability of the perforators anatomy between different people and even from one hemi abdomen to the other [9, 14]. Then, preoperative imaging studies have been made to avoid time-consuming dissections throughout the surgical procedure, allowing to choose the dominant perfo-rator before the surgery. Several noninvasive techniques have been used to preoperatively create a map of the perforators. They include the handheld continuous-wave Doppler ultrasonography (US) [21, 22], color Doppler US [23, 24], and recently, CTA [25, 26] and Magnetic Resonance Angiography (MRA) [13]. These techniques will be briefly described next, according to Pratt et al. [13].
2.3.1 Continuous-wave Doppler US
Continuous-wave Doppler US is performed with a handheld ultrasound Doppler probe, which is a relatively inexpensive unit commonly found in most hospitals. It requires an interface layer of ultrasound gel between the skin and the probe to facilitate the transmission. An audible signal is
emitted when the probe is over a blood vessel, and it becomes stronger if the direction of the vessel is pointing to the probe. Some studies have shown that the Doppler probe has reasonable accuracy in identifying perforators for different free-flap operations [21, 22, 27], while others report bad accuracy when comparing with surgical findings, especially when the studied vessels are small and at deeper regions [28]. Besides, some authors report that this technique is less accurate and suffers more from interuser variability than modalities such as CTA [29].
2.3.2 Color Doppler US
Color Doppler US creates a grayscale image by using ultrasound. The pixel intensity is related to the blood flow, being possible to distinguish between slow and fast flow, which is important to separate arteries from veins. Color Doppler US is an operator-dependent procedure with a steep learning curve. It was the standard imaging technique for DIEP flap until very recently, being substituted by the CTA.
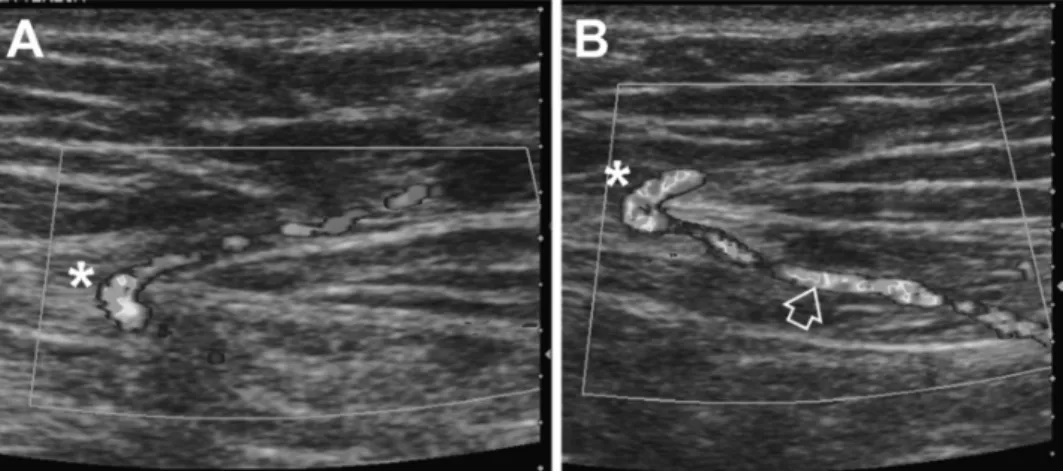
Cina et al. [9] found Color Doppler US to be reliable for estimating the caliber of the perforator and for giving an accurate mapping of the perforators when performed by experienced personnel. In addition, the authors verified that this technique was able to differentiate between the opacified artery and the unopacified veins, which run close together and have small calibers, something that CTA was not capable of. However, Color Doppler Ultrasound gave less information about the intramuscular course of perforator vessels and possible superficial venous communications. Figure 2.9 shows an example of an image acquired through this technique.
Figure 2.9: Color Doppler Ultrasound of the abdominal wall vasculature. (A) Subcutaneous course of the perforator, superficial to the anterior rectus sheath (asterisk). (B) Subfascial and intramus-cular course of the perforator (arrow), deep to the anterior rectus sheath (asterisk). Adapted from [13].
2.3.3 Computed Tomographic Angiography
CTA involves a combination of computer-analyzed-x-ray images with a bolus of venous contrast medium in order to obtain high-resolution images of blood vessels (Figure 2.10). Technology ad-vances have been allowing faster and more detailed acquisitions and, at the same time, reducing the time of the process. Despite the cost, radiation exposure and iodinated contrast media associ-ated to multidetector CT, the excellent accuracy it has demonstrassoci-ated led many authors to propose that it should become the standard preoperative imaging technique in DIEP surgery. Advantages include noninvasive nature, more accurate images than Doppler and color Doppler, detailed in-formation on intermuscular course of perforators, inin-formation on other vessels present in the area like the SIEA and less interuser variability.
Figure 2.10: CTA of the abdominal wall vasculature. (A) Oblique 3D volume rendered image showing the subcutaneous portion of the DIEA perforators and superficial venous system. (B) sagittal MIP image showing intramuscular course of a perforator. Adapted from [13].
Cina et al. [9] concluded that in some cases, CTA cannot distinguish between perforator artery and adjacent veins. Even then, this did not affect the selection of the main perforator. The authors also found that multidetector CT, in comparison to color Doppler US, is better to evaluate the intramuscular course of the perforator and to assess the superficial venous communications, which might be an important indicator of the survival of large flaps.
Rozen et al. [30] found trends for shorter operating times, decrease in fat necrosis and shorter lengths of hospital stay among patients undergoing preoperative CTA. Besides, the authors found statistical significance for reduced incidence of partial flap loss, abdominal wall herniation, donor site morbidity and surgeon’s stress level.
Smit et al. [31] verified that preoperative CTA decreases surgery time and a tendency to less morbidity. Although the cost of a CTA was around 350 pounds, a mean of 1750 pounds per patient was saved due to the reduction of surgery time and its associated costs. Besides, the authors found that CTA helped to determine if a patient was suitable for a DIEP flap, to design the flap and to plan the incision to perform.
Masia et al. [14] experienced no false negatives nor false positives in the identification and location of the dominant perforator. Plus, the imaging allowed the authors to discover the existence of the SIEA in 62% of the cases and to perform a SIEA flap in 19% of the cases. They found a decrease of postoperative complications when using multidetector CT before surgery.
Rozen et al. [32] stated that CTA was able to accurately identify the size, location, caliber and course of perforators throughout their intramuscular, subfascial and subcutaneous courses. The authors also found that, by limiting the scan range to the flap donor site, the radiation dose was less than 6mSV for a DIEP flap (less than a standard abdominal CT scan).
2.3.4 Magnetic Resonance Angiography
Magnetic Resonance Imaging (MRI) has been recently proposed for preoperative planning, in order to avoid the radiation dose inherent to the CTA. It uses the properties of magnets to align hydrogen nuclei in the tissues such that they resonate. The resulting signal can be processed, leading to the creation of an image (Figure 2.11). The disadvantages related to this technique include its high cost, large scanning time and the fact that it is not suitable for claustrophobic patients and for those who have metallic implants.
Although MRI allows to visualize vessels, supplementing the scan with nonionizing paramag-netic contrast material such as gadolinium, allows to increase even more the contrast of arteries. This technique is commonly known as MRA.
Despite the investigation and evolution of the technique, its lower spatial resolution leads to worse accuracy than CTA, as reported by Rozen et al. [33].
2.3.5 Summary
Different imaging techniques have been used to preoperatively study the abdominal wall vascula-ture. When microsurgery based reconstruction methods started to develop, Continuous-wave US
Figure 2.11: MRA of the abdominal wall vasculature. The black and white arrows point to the intramuscular and subcutaneous course of DIEA, respectively. A, B and C are the MIP 3D recon-structions in axial, sagittal and obliquely slices, respectively. Adapted from [13].
was the state-of-art imaging modality for creating the perforators map. Then, more accurate meth-ods started to be proposed in order to improve the accuracy of the studies findings. Color Doppler US retrieves more accurate information but is a highly-user dependent technique. CTA improved even more the extracted information by giving better insight about the intramuscular course of the perforators, which is very relevant for the flap design procedure. The radiation exposure inherent to the CTA scan contributed to a big interest in performing preoperative studies through MRA. Even then, this imaging modality still has lower spatial resolution than CTA, and consequently the latter presents higher accuracy.
Literature Review
To the best of our knowledge, there is no algorithm in the literature focusing the segmentation of the DIEA perforators. Still, vessel segmentation algorithms usually follow common principles and assumptions that stand true for different types of vessels, e.g., segmenting tubular structures with circular shaped cross section.
Then, a brief description of the main approaches regarding Three-Dimensional (3D) vessel segmentation is made in this Chapter. The methods in the literature are usually a combination of assumptions and vessel extraction techniques, which motivates a specific description for each of these concepts. Following Lesage et al. [34], a description of proposed vascular models, image features and extraction schemes is made in this Chapter.
3.1
Vascular models
Vascular models represent the prior knowledge related to the structures of interest. Algorithms can make different assumptions on the target vessels, e.g. having circular cross section. These as-sumptions can be based on appearance and/or geometric properties, leading to three main classes: appearance, geometric and hybrid models.
3.1.1 Appearance models
Appearance models are related to the luminance of vessels and are highly dependent of the imaging modality. Besides, the intensity of vessels also varies according to the specific acquisition protocol, whose specificities can be used to know the theoretical intensity of target vessels [35, 36, 37]. However, achieving steady concentrations of contrast agent is not a trivial task, commonly leading to variable vessel intensities. In this context, the intensities can be modeled by a distribution, like the Gaussian distribution, as proposed by Florin et al. in [38].
Some studies model not only the vessels but also their neighborhood. The simplest assumption is to consider vessels brighter than the surroundings in contrasted-enhanced modalities such as CTA and MRA [38]. More complex models based on statistical mixtures were proposed in [39, 40]. These approaches rely on intensity differences between the vessels and the background, an
assumption that is innacurate when other hyper-intense structures surround the vessels. Instead of only considering the intensity, Schaap et al. [41] analyzed the homogeneity as well, and modeled vessels as more homogeneous structures than their neighborhood.
3.1.2 Geometric models
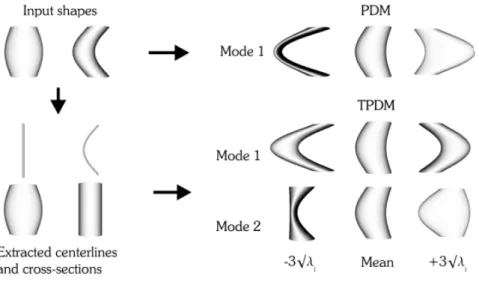
Geometric models are related to the shape of target vessels. Several works model directly the ves-sel surface, for instance, Frangi et al. [42, 43] exploited B-spline tensor surfaces and de Bruijne et al. [44] used active shape models to model vessel axis and cross section deformation indepen-dently, increasing the flexibility of shape generalization (Figure 3.1).
Figure 3.1: Modes of variation found by a single Point distribution model (PDM) and the com-bined model (TPDM) built from two illustrative input shapes. The latter is able to detect an additional mode of variation. Adapted from [44].
Other authors model the vessel centerline, commonly following the assumption that it presents limited curvature. Frangi et al. [42, 43] modeled the centerline as a One-Dimensional (1D) B-spline curve and Lacoste et al. [45] proposed an approximation by piece-wise linear curves.
3.1.3 Hybrid models
Hybrid models incorporate both appearance and geometric properties. For instance, Krissian et al. [46] used 3D Gaussian line profiles to model the vessel cross section. However, as vessel radius increases, the profile of the cross section starts to be more plateau-like (see the middle row of Figure 3.2). This behavior motivated the use of different models to represent the cross section of these vessels, such as bar-like profiles [47] and the 3D cylindrical intensity model proposed by Wörz and Rohr [48] (Figure 3.2). A different approach to model vessels was exploited by Aylward and Bullitt [49] and Fridman et al.[50], where the intensity of images is considered an additional dimension and vessels become local ridges of the image hyper-surface.
Figure 3.2: (Top row) Orthogonal 2D slices through vessels with different radius; (Middle row) Corresponding intensity plots; (Bottom row) Intensity plots of the cylindrical intensity model. Adapted from [48].
3.2
Image Features
Image features, e.g., local intensity curvature, allow to evaluate the vessel likelihood of a certain voxel. This section describes some of the image-based features that have been proposed in the literature.
3.2.1 Local isotropic features
Local isotropic features measure vessel likelihood without exploring their directionality. Aylward et al. [51] implemented a multiscale ridge detector through multiscale Laplacians of Gaussians, assuming that vascular intensities were locally maximum. This approach was extended in other works where vessel direction was also considered [49, 52]. Vasilevskiy and Siddiqi [53] measured the gradient flux through the boundaries of multiscale spheres to detect vessels. The authors stated that it was possible to detect low contrast and narrow vessels.
3.2.2 3D local geometry features
3D local geometry features explore the hyper-intensity and tubular shape intrinsic to vessels. Sev-eral approaches use the second-order derivatives to characterize the local geometry. 3D vessels can be distinguished by a small-curvature along the vessel direction and a normal high-curvature plane (Figure 3.3). Multiscale approaches using Hessian-based filters were proposed in [54, 55]. Figure 3.4 shows an example result obtained with the framework proposed by Frangi et al. [54].
Deviations from a single vessel, such as bifurcations and aneurysms, commonly produce false neg-ative responses to these filters. Besides, non-vessel hyper-intense structures might perturb vessel detection.
Figure 3.3: Second order ellipsoid describing the local principal directions of curvature. Adapted from [54].
Figure 3.4: Vessel enhancement obtained at increasing scales (first four images) and the final result obtained after the scale selection. Adapted from [54].
Agam et al. [56] developed a different approach, considering the spatial covariance of im-age gradient vectors. This alternative allows to detect more than one principal direction making it capable of discriminating between single vessels, bifurcations and nodules (Figure 3.5). The authors reported smaller mean square localization errors and better behavior at bifurcations when comparing to the Hessian-based approach of Frangi et al. [54, 55].
Integrative features were also proposed, in order to increase the robustness to noise [47, 52]. However, filters do not enjoy from a well-defined scale-space theoretical framework. Usually, these algorithms are restricted to a single scale, although Hernandez-Hoyos et al. [57] proposed heuristics to adapt the scale value.
Fitting a vessel model into the image is another popular approach to measure vessel likelihood. Friman et al. [58] used Gaussian profiles to model the Two-Dimensional (2D) cross section of vessels. Worz and Rohr [48] considered a 3D cylindrical parametric intensity model instead. The
Figure 3.5: Specific structure enhancement by applying different filters. a) synthetic original image; b) enhanced junctions; c) enhanced junctions and vessels; d) enhanced nodules. Adapted from [56].
reasoning comes from the fact that 2D cross sections of medium and large vessels is plateau-like, as already mentioned.
3.2.3 2D cross section features
2D cross section features are commonly used in frameworks where vessel direction is estimated and serves as input. Behrens et al. [59] used a randomized 2D ellipse Hough Transform to detect 2D cross sections on edge maps. The approach is computationally efficient but is dependent on the edge detector which is usually very prone to noise and not suitable for low-contrast regions. Florin et al. [38] compared the intensity inside a 2D ellipse with its surroundings. The local maxima contrast feature is reached when the ellipse is aligned with the vessel cross section.
Ray-casting features were used for the characterization of 2D vessel cross sections [37, 60, 61]. Considering a point inside the vessel and its cross section, this technique aims at detecting the vessel wall by emitting rays from that point in an equi-angularly manner. Analysis of each ray was performed in several ways, for instance, Wesarg and Firle [37] used intensity thresholding while Wink et al. [61] used gradient thresholding (Figure 3.6).
Figure 3.6: Vessel wall detection through gradient based ray-casting features. Gradient maximum is selected for each ray. Adapted from [61].
3.3
Extraction schemes
Extraction schemes use the considered vascular models and image features to perform the final vessel segmentation. This section covers different techniques that have been proposed for this task.
3.3.1 Region growing approaches
Region growing approaches segment a vessel from a starting point/region inside it, called seed point/region. Then, these methods iteratively join neighboring pixels to the seed, based on a spe-cific criteria (Figure 3.7). The simplicity of these methods makes them computationally efficient, although they are dependent on the initial seed point location, which might be an important factor in many frameworks. To overcome the initialization problem, Wan et al. [62] proposed a symmet-ric region growing algorithm capable of extracting the same vessel tree for different starting seed points.
Figure 3.7: Segmentation using a region growing algorithm. From the left to the right, the algo-rithm starts with a seed point and iteratively adds neighbor voxels that satisfy a certain inclusion criteria. Adapted from [35].
Boskamp et al. [35] proposed a simple intensity-based region-growing, however, the approach becomes innacurate in noisy and heterogeneities-rich vessel segments. Metz et al. [63] proposed
a growth-limiting criteria to avoid leakage problems. Other authors focused on wave propaga-tion techniques, as they assure spatially coherent propagapropaga-tion [64, 65]. Several wave speed func-tions have been proposed, such as, Uniform Euclidean speed and binary inclusion criterion [66], weighted geodesic speed [36] and dynamically adapted speed [39]. The connectivity of the prop-agating interface was exploited to detect bifurcations [36, 63, 66].
3.3.2 Active contour methods
Active contours evolve an interface based on internal and external forces. The former are related to the contour geometry and constraints while the latter are derived from the image.
Parametric active contours rely on explicit Lagrangian formulation of a contour evolution. Delingette and Montagnat [67] reviewed these techniques. Topology-adaptive snakes were in-troduced by McInerney and Terzopoulos [68] and allow to control the splitting and merging of contours. The authors claimed that these properties combined with a re-parameterization scheme allow to capture thin vessels and bifurcations (Figure 3.8). Eigen-snakes, presented by Toledo et al. [69], compute the principal component of the distribution of gradient vectors, in order to ex-ploit vessel direction in the energetic formulation. Yim et al. [70] considered a deformable tubular surface and optimized it with respect to the centerline of the vessel. Frangi et al. [42] optimized the B-spline tensor surface using explicit control points.
Figure 3.8: Segmentation based on topology-adaptive snakes. (a) to (d) shows the evolution of the snake. Adapted from [68].
Implicit active contours make use of level-set techniques, where the contour is the zero level of a higher dimension function. These methods avoid parameterization problems but also have higher computational costs. A detailed presentation of this topic is present in [71].
3.3.3 Centerline based approaches
The algorithms presented in the last sections focus on extracting the vessel surface. Centerline-based approaches aim at directly extracting the vessel centerline instead. Nevertheless, many frameworks apply methods to segment vessel lumen from its centerline.
Centerline-based methods usually require initialization by the user. Then, centerline points are commonly predicted through vessel direction estimation, which may be based on different image features described in section 5.2. To increase the robustness of these systems, past centerline
points can influence the current prediction, as considered in [43, 72]. A common approach is to use a Kalman filter for such task, as considered in Worz and Rohr [48].
Several frameworks correct the centerline position after analyzing local image features. We-sarg and Firle [37] considered the center mass of cross-sectional contour points detected along 1D rays as the new centerline position, while Friman et al. [58] used local optimization of 3D models instead.
Automatic bifurcation handling requires the segmentation of vessel lumen and the use of topo-logical criteria. Aylward and Bullitt [49] and Fridman et al. [50] used ridge-based features to perform online branching detection.
Centerline-based methods become better defined when both start and end points are given. In this context, Frangi et al. [42, 43] started by optimizing the centerline of the vessel consid-ering fixed boundary conditions. Minimum cost path techniques find the centerline path which minimizes a cost function. Lower costs are associated to voxels that are more likely to belong to the vessel centerline, based on extracted image features. These techniques differ according to the method they use for optimization. Wink et al. [73] implemented graph-based schemes, while Young et al. [74] used fast-marching schemes which are more accurate but have higher compu-tational costs. The cumulative nature of the path cost leads to the common problem of shortcut paths being selected as the ideal solution. Li and Yezzi [75] represented the vessel as a Four-Dimensional (4D) curve, where each point represents a 3D sphere and the radius (Figure 3.9). The efficiency and capability of reaching global minima of minimal path techniques is combined with the ability of active surface techniques to represent a full 3D surface.
Figure 3.9: Representation of a tubular surface as the envelope of a family of spheres with chang-ing center points and radius. Adapted from [75].
Some authors proposed termination criteria in order to remove the need of knowing the end points. Gulsun and Tek [60] used heuristic thresholds on image features and Wink et al. [73] propagated the waves of minimum cumulative costs, based on the response to an eigenvalue filter (Figure 3.10).
Figure 3.10: Vessel segmentation by propagation of waves of minimum cumulative costs. From left to right: (a) source point, (b) eigenvalue filter response, (c) wave of cumulative costs at a certain instant and (d) extracted vessel. Adapted from [73].
Yim et al. [76] addressed the characterization of small vessels in MRA. Vessel axis were determined through the ordered region growing (ORG) algorithm. Like common region growing approaches, this method starts from a user defined seed point/region. However, at each iteration, the voxel that is propagated is the one that belongs to the boundary of the current seed region and has the highest intensity value. This produces an acyclic graph as the one present in Figure 3.11. When the endpoints of the vessel tree are given, vessel segments can be obtained by tracing the path from each endpoint to the origin. Another option, is to remove all branches whose length is smaller than a specified length.
Figure 3.11: Vessel centerline extraction using ORG algorithm. (a) 2D image of a vessel where the arrow indicates the seed point. (b) Obtained ORG graph. Adapted from [76].
3.4
Summary
This chapter contains a brief description of some of the most representative works related to 3D vessel segmentation. The high number of methods proposed to solve this task shows that it is a crucial step for many medical image applications, such as facilitating visualization, measuring vessel features, surgery planning, between others.
Besides the high number of proposals, their nature is also highly variable. Even a single pro-posal is usually composed by a sequence of assumptions and techniques leading to the final seg-mentation. The design of a vessel segmentation algorithm is then dependent on the assumptions one can make according to the target structures and imaging modality. After choosing an appro-priate vascular model, image-based features and extraction scheme should be selected keeping in mind the final requirements, for instance, computational cost, required user input and robustness to noise.
Image-based features using derivative operators are sensitive to noise and should be avoided when the target structures have low Signal-to-noise ratio (SNR). Integrative operators are more robust to noise but do not allow to easily apply multiscale approaches. Local model fitting is highly dependent of expressing an accurate model of the target vessel in a closed form.
Region-growing schemes are highly efficient but are very prone to leakage problems on het-erogeneous environments. Parametric active contours are computationally efficient but their im-plementation becomes complex at 3D situations. Implicit active contours are not affected by pa-rameterization problems but their computational cost is higher and convergence must be ensured. Centerline-based methods seek higher robustness to noise and artifacts but require the estimation of more parameters in each iteration. Besides, these methods do not provide directly a vessel lumen segmentation.
Database and Region of Interest
This chapter describes the database provided by the Breast Cancer Unit of Fundação Champali-maud. Besides showing examples of the images contained in the database, the region of interest for our research purposes and the anatomical structures which exist there will be also focused. In the end, a characterization of the available Ground Truth annotations and how they were obtained is made.
4.1
CTA volumes
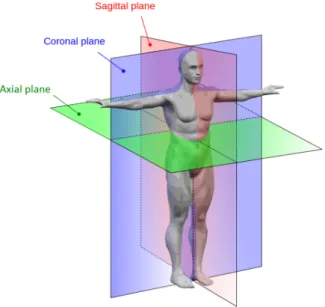
Fundação Champalimaudprovided CTA volumes from 20 different patients. They are in Digi-tal Imaging and Communications in Medicine (DICOM) format and contain several axial slices, which are perpendicular to the long axis of the body (see Figure 4.1).
Figure 4.1: Anatomical planes of the body. Adapted from http://www.interactive-biology.com/.
![Figure 2.3: Origin of the DIEA from the external iliac artery. Adapted from [16].](https://thumb-eu.123doks.com/thumbv2/123dok_br/15242069.1023088/27.892.273.663.329.703/figure-origin-diea-external-iliac-artery-adapted.webp)
![Figure 2.4: DIEA classification described by Moon and Taylor. Adapted from [10].](https://thumb-eu.123doks.com/thumbv2/123dok_br/15242069.1023088/28.892.171.690.146.526/figure-diea-classification-described-moon-taylor-adapted.webp)
![Figure 2.8: Comparison of the blood supply in free TRAM, DIEP and SIEA flaps. Adapted from [11].](https://thumb-eu.123doks.com/thumbv2/123dok_br/15242069.1023088/35.892.209.724.156.502/figure-comparison-blood-supply-tram-diep-siea-adapted.webp)