online | memorias.ioc.fiocruz.br
The quantification of infectious particles in samples and in cell culture is an important tool in virology. Vi-ral titres can be estimated based on cell culture methods that require serial dilution to determine infectivity and are expressed as plaque forming units or cell culture in-fective doses. Both methods are laborious and time con-suming (Khatib et al. 1980) and the sensitivity decreases with low numbers of viral particles. Determining accu-rate and precise titres is a challenge for viruses for which cell culture is not available or viral growth is limited, but this quantification is critical in vaccine production and quality control, gene therapy and the investigation of antivirals (Forcic et al. 2009).
Hepatitis A virus (HAV) is a representative member of the genus Hepatovirus within the family Picornaviri-dae (Minor 1991). The 27-32 nm particle is non-envel-oped and contains a single strand of positive-sense RNA as its genome (Siegl 1982). Cell propagation methods are the method of choice to demonstrate viral infectivity (Donia et al. 2009). However, since it was first adapted to cell culture (Provost 1979), HAV has been demonstrated to replicate slowly, with culture times of 10-14 days in most reported systems. HAV also establishes persistent infections in tissue culture (Provost 1979, Wheeler et al. 1986), but the slow, non-cytopathic growth of HAV has
hampered its study in tissue culture and its quantifica-tion. Subsequent methods developed to assay HAV in tis-sue culture include the radioimmunofocus assay (RIFA) (Lemon et al. 1983), in situ RIFA and the fluorescent fo-cus assay (Siegl et al. 1984); all three procedures have been commonly used to monitor the production of HAV antigen as an indirect indicator of viral growth (Purcell et al. 1976, Siegl et al. 1984). Few assay methods have been developed for HAV titration (Lemon et al. 1983, Richards & Watson 2001, Villar et al. 2004, Konduru et al. 2008).
Currently, molecular tests, including real-time-poly-merase chain reaction (RT-PCR), have been successfully applied in viral quantification and these tests allow rapid, specific detection. The molecular detection of viruses, which is now becoming more widely available, does not require the lengthy incubation period needed for viral isolation from cell culture, may require less technical expertise and is useful for viruses that do not prolifer-ate in standard cell culture (Leland & Ginocchio 2007). However, the detection of viral genomes in cell culture using RT-PCR is not sufficient to distinguish between in-fectious and non-inin-fectious particles and does not guar-antee that every copy of detected RNA corresponds with a complete viral particle. In currently available hepatitis A vaccines, the virus is grown in cell culture and then inactivated. The monitoring of viral inactivation may be achieved by leveraging an established pattern of correla-tion between the number of amplified copies of the viral genome, determined by RT-PCR and the number of viral particles titrated by ELISA in situ. A comparative study aimed at evaluating the correlation between the numbers of viral particles and HAV genomes, measured by ELISA
insitu and RT-PCR, was performed to evaluate the possi-bility of rapidly and efficiently determining HAV titres.
Financial support: CNPq, FIOCRUZ
+ Corresponding author: [email protected] Received 29 February 2012
Accepted 5 September 2012
Detection of replication-defective hepatitis A virus
based on the correlation between real-time
polymerase chain reaction and ELISA
in situ
results
Alyne Moraes Costa, Luciane Almeida Amado, Vanessa Salete de Paula/+
Laboratório de Desenvolvimento Tecnológico em Virologia, Instituto Oswaldo Cruz-Fiocruz, Rio de Janeiro, RJ, Brasil
ELISA in situ can be used to titrate hepatitis A virus (HAV) particles and real-time polymerase chain reaction (RT-PCR) has been shown to be a fast method to quantify the HAV genome. Precise quantification of viral concen-tration is necessary to distinguish between infectious and non-infectious particles. The purpose of this study was to compare cell culture and RT-PCR quantification results and determine whether HAV genome quantification can be correlated with infectivity. For this purpose, three stocks of undiluted, five-fold diluted and 10-fold diluted HAV were prepared to inoculate cells in a 96-well plate. Monolayers were then incubated for seven, 10 and 14 days and the correlation between the ELISA in situ and RT-PCR results was evaluated. At 10 days post-incubation, the high-est viral load was observed in all stocks of HAV via RT-PCR (105 copies/mL) (p = 0.0002), while ELISA revealed the highest quantity of particles after 14 days (optical density = 0.24, p < 0.001). At seven days post-infection, there was a significant statistical correlation between the results of the two methods, indicating equivalents titres of particles and HAV genome during this period of infection. The results reported here indicate that the duration of growth of HAV in cell culture must be taken into account to correlate genome quantification with infectivity.
MATERIALS AND METHODS
Foetal rhesus kidney-4 (FRhK-4) cell culture and HAV-A continuous FRhK-4 cell line was grown at 37ºC in 175 cm² disposable Falcon flasks containing 199 me-dium supplemented with 10% heat-inactivated foetal bovine serum (FBS), 2 mM L-glutamine, 0.1 mM MEM non-essential amino acids, 25 mM HEPES, 0.18% sodium bicarbonate, 100 U/mL penicillin and 100 µg/mL strep-tomycin (Sigma Chemical Co). Flat-bottomed 96-well microtitre plates (tissue culture grade, Nunc Inc Naper-ville, IL, USA) were seeded with 100 µL of a suspension of FRhK-4 cells prepared in growth medium (104.5 cells/
mL). After incubation at 37ºC in a 5% CO2 atmosphere for 24 h until confluence was just reached, 100 µL dilutions of virus sample prepared in 199 medium supplemented with 2% heat-inactivated FBS were added to test eight wells per dilution without removal of the growth medium.
HAV plate assay -Three aliquots of HAV (HAF-203) (undiluted, 5-fold diluted and 10-fold diluted) were pre-pared to inoculate the 96-well plate to compare the quan-tification of HAV by the tissue culture infective dose (TCID50) method and RT-PCR. Two columns of unin-fected wells were included on each plate as negative con-trols and one extra column was included to blank the plate reader. Monolayers were then incubated for seven, 10 and 14 days. The reproducibility of both tests was evaluated by performing the assays in triplicate and on different days.
ELISA in situ -To quantify the infectivity of HAV in cell culture, ELISA in situ was performed as previously described by Villar et al. (2004). After days 7, 10 and 14, the medium was removed and the cells were fixed using 100 µL per well of a 1:1 mixture of acetone and metha-nol at 4ºC for 5 min. The fixative was removed and the monolayers were allowed to dry uncovered at room tem-perature for at least 2 h. The presence of virus-specific antigen was detected using the conjugate diluted 1:8000 with phosphate buffered saline (PBS)/0.5% bovine
albu-min (w/v). The conjugate (100 µL) was added to each test and uninfected well but not to the blank wells. After incubation of the cells at 37ºC for 1 h, the antibody solu-tion was removed and the monolayers were washed four times with PBS plus 0.1% Tween 20 (w/v) (300 µL/well) using an automated plate washer. Immediately after washing, bound antibody was detected using hydrogen peroxide and tetramethylbenzidine. The colour change was monitored visually and stopped after 15 min by the addition of 100 µL of 1 M sulphuric acid per well. The absorbance of the plates was then read at 450 nm and a positive/negative ratio was determined using uninfected wells as the negative value. The titre of infectious virus was determined according to the method of Reed and Muench (1938), which is based on the TCID50 endpoint.
Extraction of viral RNA from cell culture superna-tants -A TaqMan RT-PCR assay was performed to quan-tify HAV genomes as previously described by de Paula et al. (2009). RNA was extracted from cells in microplates using the SV Total RNA Isolation System (Promega Cor-poration, Madison, WI), which specifically purifies vi-ral RNA from tissues and cultured cells. This method is based on a lysis-centrifugation process, followed by col-umn filtration through a silica membrane in an RNase-free environment. The trypsinised cells were pelleted by centrifugation at 500 g for 5 min and the supernatant was discarded. The whole cell pellets were disrupted by
add-ing 300 μL of lysis buffer (106 cells/mL) and viral RNA
was extracted from lysed whole cell samples. The
posi-tive strands of the 5′ non-translated region (5′NTR) of the
HAV genome were amplified. This region was selected as the target due to its sequence conservation. The posi-tive strands were reverse-transcribed using Superscript III reverse transcriptase (Invitrogen, Carlsbad, CA). The reaction was conducted at 50ºC for 1 h, followed by incu-bation for 10 min at 65ºC in a 20 µL volume containing
10 μL of RNA (10 pg-5 μg), 10 pmol/μL anti-sense primer
(HAV5NCRI-R) (Table), 1 U/μL RNasin (Promega, Mad
-TABLE
Reproducibility analysis of the ensyme immunoassay (EIA) and real-time (RT)-polymerase chain reaction assays and correlation between hepatitis A virus (HAV) particles and HAV genomes
Day
(dpi) Dilution
Real-time (copies/mL)a
CV% (RT)
EIA (OD)b
CV%
(RT) Rc p (95% CI)d
7 1/1 3.180 ± 30.2 0.9 0.819 ± 0.028 3.5 0.969 < 0.0001 (85.6-99.3)
1/5 201.0 ± 3.0 1.5 0.46 ± 0.01 4.1 -
-1/10 89.0 ± 1.0 1.1 0.33 ± 0.103 3.0 -
-10 1/1 111.333 ± 2.309.4 5.2 2.29 ± 0.04 1.9 0.853 0.003 (43.6-96.8)
1/5 84.833.3 ± 2.914.3 3.4 1.199 ± 0.05 4.7 -
-1/10 707.3 ± 34.5 4.8 0.87 ± 0.06 7.5 -
-14 1/1 11.233.3 ± 404.1 3.3 2.34 ± 0.1 4.4 0.784 0.012 (25.1-95.2)
1/5 205.6 ± 13.6 6.6 1.80 ± 0.13 7.5 -
-1/10 27 ± 1.0 3.7 0.04 ± 0.04 4.5 -
ison, WI), 125 mM of each deoxynucleoside triphosphate
and 1 U/μL Superscript III reverse transcriptase. After
cDNA synthesis, a master mix containing 1×TaqMan Universal PCR Master Mix (Applied Biosystems,
Ham-monton, NJ) and 1.25 μL of the assay mixture (300 nM of
each primer, 150 nM probe) (Applied Biosystems Assay, Foster City, CA) was prepared on ice. Five microlitres of
cDNA and standard curve points were added to 20 μL of
the PCR master mix. The thermal cycling conditions in-cluded an initial step at 50ºC for 2 min, 95ºC for 10 min, 40 cycles of 95ºC for 15 s and 60ºC for 1 min. The
prim-ers and probe used to quantify the 5′NTR are described
by de Paula et al. (2007).
Statistical analysis -All graphs were generated using GraphPad Prism software 5.0. Data are presented as the mean and standard deviation of triplicates for the RT and ensyme immunoassay (EIA) values. The statistical sig-nificance of the linear (Pearson) correlation between the methods was determined, with a p value < 0.05 considered significant. An analysis of variance was used to evaluate significant differences between the values of each group.
RESULTS
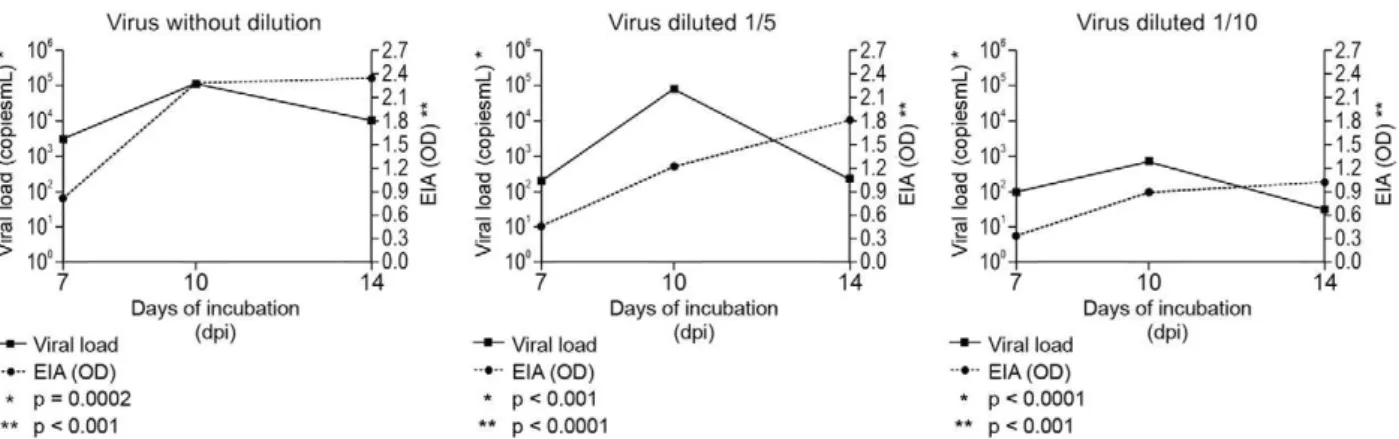
Correlation between the number of HAV particles and the HAV genome - To determine a relative correlation be-tween the number of HAV genomes and HAV particles, which could be used as a replacement to traditional viral titration methods, we quantified the virus by the standard method of titration (ELISA in situ) and a molecular test (RT-PCR) and used a statistical approach to test corre-lations. The number of HAV (HAF-203) particles in the three different stocks was determined by ELISA in situ
and compared with the viral load measured by RT-PCR (Fig. 1). From days 7-10, there was a significant increase in detection of HAV genome and particles by RT and EIA, respectively (p < 0.001). However, from day 10-14, there was a significant decrease in genome detection (p < 0.001) and a stabilization of HAV particles (Fig. 1). At 10 days post-infection, the maximum concentration of HAV RNA was reached in all stocks (105 copies/mL) (p
< 0.001), while the highest number of HAV particles was
observed at day 14 (optical density = 2.4, p < 0.001). A linear correlation analysis showed a strong positive corre-lation between the number of HAV particles and number of HAV genomes (r = 0.96, p < 0.0001) at seven days post-inoculation (Table). After 10 and 14 days of incubation, the linear correlation analysis showed a weak positive correlation between HAV particles and HAV genomes (r = 0.85 and 0.784, respectively) (Table).
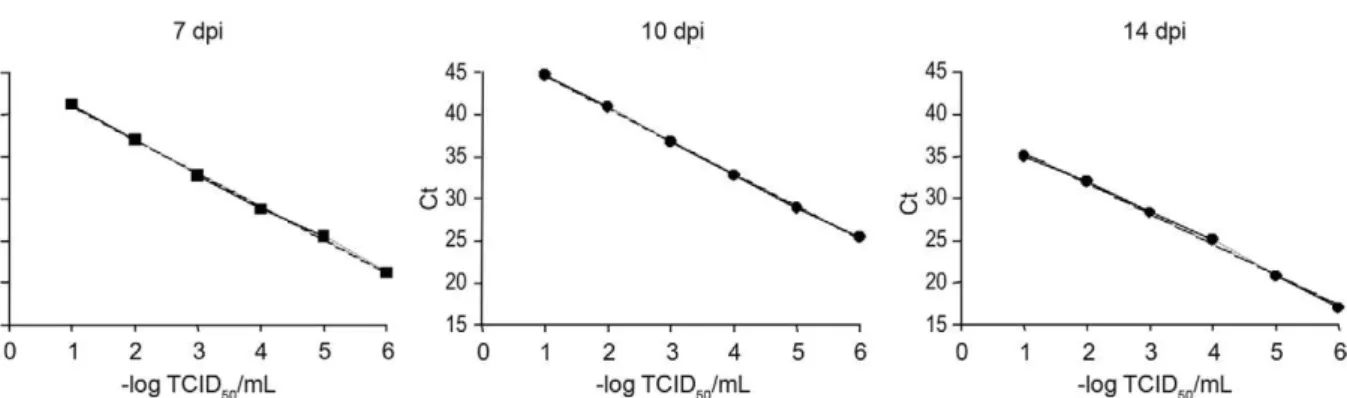
Relationship between the titre of infectious HAV and RNA copies - The titre of infectious HAV at seven, 10 and 14 days post-infection (dpi) was estimated by end-point titration using TCID50. The highest TCID50 value occurred on day 7 using serial one-fold dilutions (10-6.167).
The cycle threshold (Ct) values for each day of infection were measured and correlated with TCID50 (Fig. 2). This analysis demonstrated that there was a significant cor-relation between titre equivalent values, measured by RT-PCR and TCID50 titres. This correlation allowed the calculation of the number of RNA copies corresponding with the TCID50.
Analyses of assays accuracy -To test the reproduc-ibility of the EIA and RT-PCR assays, the assays were conducted in triplicate using different aliquots (1:1, 1:5 and 1:10) of the same stock. In addition, the assays were performed three times as an inter-assay analysis. The low variations in the EIA (with a coefficient of variation ranging from 3-7.5%) and RT-PCR (with a coefficient of variation ranging from 0.9-6.6%) demonstrated the re-producibility of the tests (Table).
DISCUSSION
Over the last few decades, several types of inacti-vated HAV vaccines have been developed. The vaccines are whole-virus preparations produced by the growth of HAV strains in cell culture, followed by inactivation of the virus. HAV grows poorly in cell culture and does not generally induce a cytopathic effect. The viral load can be quantified by TCID50 determination or RT-PCR. In this study, a statistical approach was used to verify the correlation between the number of particles and number of HAV RNA copies.
The number of HAV particles was estimated by EIA and this value was compared with the number of HAV genomes determined by RT-PCR (Fig. 1). The maximum concentration of HAV RNA was reached at 10 dpi and the highest number of HAV particles was observed at 14 dpi. However, at seven days post-incubation, there was a strong significant positive correlation (r = 0.969, p < 0.001) between the number of particles and number of HAV genomes (Table) for all three stocks, which sug-gests that there is a statistical correlation between the number of HAV genomes and the infectivity. A possible explanation for this result is that at seven days post-infec-tion, the new HAV genomes are predominantly encapsi-dated to generate mature virions instead of being used as templates for HAV genome replication. This correlation enabled the calculation of the number of RNA copies in a sample and the association with TCID50, as described recently for enterovirus. For enterovirus, the RT data were correlated over a wide range of viral concentrations with the titre obtained by endpoint titration (Jonsson et al. 2009). Our results are in accordance with Villar et al. (2004) , who reported that at 14 days of incubation, there was a higher optical density by ELISA in situ, while the highest HAV titre was observed at seven dpi.
From days 7-10, there was a significant increase in the detection of both the HAV genome and particles by RT and EIA (p < 0.001). This suggests that during this period, most of the new HAV genomes synthesized are encapsidated to generate virions. Linear correlation analysis showed that there was a weak positive correla-tion between the TCID50 and the number of HAV ge-nomes at 10 and 14 days post-infection. From days 10-14, there was a significant decrease in genome detection (p < 0.001) and a slight increase of the number of HAV particles. While these results did not provide biochemi-cal or virologibiochemi-cal evidence of the presence of defective particles, we speculate that during this period, a higher number of procapsids or empty particles are present in the viral stocks, likely due a reduced rate of genome rep-lication and predominant use of the genome to produce viral protein as mRNAs to produce viral proteins.
To evaluate the reproducibility of the tests, all ELI-SAs and RT-PCR assays were conducted in triplicate.
The coefficients of variation were lower than 10%, which demonstrates the reproducibility of the tests.
In a previous study, the density and sedimentation analyses of extracts from cells infected with HAV at 21 days revealed that the virion itself usually represented less than 50% of the total mass of the viral antigen. A major portion of the antigen was associated with non-infectious, empty particles (Ruchti et al. 1991). Replica-tion-defective mutant viruses are essential for viral ge-nome replication or synthesis and the assembly of viral particles. These mutant viruses possess the advantages of both classical types of viral vaccines because these mutant viruses are as safe as inactivated viruses, but ex-press viral antigens inside infected cells so that major histocompatibility complex class I and class II presenta-tion can occur efficiently. Replicapresenta-tion-defective viruses have served both as vaccines for the parent virus and as a vector for the expression of heterologous antigens. Ad-ditionally, these replication-defective viruses have also served as important probes of the host immune response by helping define the importance of the first round of infected cells in the host immune response, the mecha-nisms of activation of the innate immune response and the role of the complement pathway in humoural im-mune responses to viruses (Dudek & Knipe 2006).
In this study, we demonstrated that the number of de-fective HAV particles in cell culture at 14 days should be considered. The linear correlation analysis suggested that varying amounts of defective particles can modu-late the results of HAV quantification by ELISA or RT-PCR. On the first day of infection, the replication cycle occurred normally and progeny virions were produced. However, these virions were non-infectious and thus, the infection did not spread to a second round of cells. The released, non-infectious virions may provide inert anti-gen that can spread beyond the infected cells; neverthe-less, the blockage of spreading may not be complete for all viruses (Loudon et al. 2001). For this reason, stocks of RNA viruses can contain different mixtures of infec-tious and defective particles that are indistinguishable by ELISA in situ because the surfaces of both particles share the same immunoreactivity (Handke et al. 2009). Generally, only the number of infectious virions in the
Fig. 2: correlation of the amounts of hepatitis A virus particles and RNA, estimated by tissue culture infective dose (TCID50) and cycle threshold
reference stocks is of interest and the quantity of tive particles is neglected. The relative number of defec-tive particles can be at least five-fold higher in the stock with the lowest titre compared with the stock with the highest titre (Handke et al. 2009).
To further determine whether the viral titre was cor-related with the calculated Ct value from RT-PCR, titres of HAV-containing stocks were estimated by endpoint titration. The RT data were correlated over a wide range of viral concentrations with the HAV titre obtained by TCID50 (Fig. 2). This correlation enabled the calculation of the number of RNA copies in a sample and the associ-ation with TCID50, as described recently for enterovirus (Jonsson et al. 2009).
The need for a virus quantification assay is particu-larly important to determine viral quantities, follow HAV growth in cell culture and establish the quantity of antigen for diagnostic assays and inactivation. The results reported here indicate that the duration of HAV growth in cell culture must be taken into account when correlating the quantification methods. At seven days post-infection, a correlation between the quantity of HAV genomes determined by RT-PCR and the number of HAV particles determined by ELISA in situ was ob-served. It was also demonstrated here that titre equiva-lents generated by RT-PCR correlated with the titres ob-tained by the endpoint dilution method, which implies that RT-PCR may be a feasible, faster alternative assay to estimate HAV titres at approximately 10 days post-in-fection. The results for 14 days post-infection imply that defective particles in viral stocks should be considered when performing virus quantification assays.
REFERENCES
de Paula VS, Diniz-Mendes L, Villar LM, Luz SL, Silva LA, Jesus MS, da Silva NM, Gaspar AM 2007. Hepatitis A virus in envi-ronmental water samples from the Amazon Basin. Water Res 41: 1169-1176.
de Paula VS, Perse AS, Amado LA, de Morais LM, de Lima SM, Tourinho RS, Gaspar AM, Pinto MA 2009. Kinetics of hepati-tis A virus replication in vivo and in vitro using negative-strand quantitative PCR. Eur J Clin Microbiol Infect Dis28: 1167-1176. Donia D, Bonanni E, Diaco L, Divizia M 2009. Statistical
correla-tion between enterovirus genome copy numbers and infectious viral particles in wastewater samples. Lett Appl Microbiol50: 237-240.
Dudek T, Knipe DM 2006. Replication-defective viruses as vaccines and vaccine vectors. Virology344: 230-239.
Forcic D, Kosutic-Gulija T, Santak M, Jug R, Ivancic-Jelecki J, Markusic M, Mazuran R 2009. Comparisons of mumps virus po-tency estimates obtained by 50% cell culture infective dose assay and plaque assay. Vaccine28: 1887-1892.
Handke W, Kruger DH, Rang A 2009. Defective particles can lead to underestimated antibody titers in virus neutralization tests. Inter-virology52: 335-339.
Jonsson N, Gullberg M, Lindberg AM 2009. Real-time polymerase chain reaction as a rapid and efficient alternative to estimation of picornavirus titers by tissue culture infectious dose 50% or plaque forming units. Microbiol Immunol 53: 149-154.
Khatib R, Chason JL, Silberberg BK, Lerner AM 1980. Age-depen-dent pathogenicity of group B coxsackieviruses in Swiss-Webster mice: infectivity for myocardium and pancreas. J Infect Dis141: 394-403.
Konduru K, Virata-Theimer ML, Yu MY, Kaplan GG 2008. A simple and rapid hepatitis A virus (HAV) titration assay based on antibiot-ic resistance of infected cells: evaluation of the HAV neutralization potency of human immune globulin preparations. Virol J 155: 155. Leland DS, Ginocchio CC 2007. Role of cell culture for virus
detec-tion in the age of technology. Clin Microbiol Rev20: 49-78. Lemon SM, Binn LN, Marchwicki RH 1983. Radioimmunofocus
as-say for quantitation of hepatitis A virus in cell cultures. J Clin Microbiol17: 834-839.
Loudon PT, Blakeley DM, Boursnell ME, Day DA, Duncan IA, Lowden RC, McLean CS, Martin G, Miller JC, Shaw ML 2001. Preclinical safety testing of DISC-hGMCSF to support phase I clinical trials in cancer patients. J Gene Med3: 458-467. Minor P 1991. Picornaviridae. In RIB Francki, CM Fauquet, DL
Knudson (eds.), Classification and nomenclature of viruses (Arch Virol Suppl 2), Springer-Verlag, Wien, p. 320-326.
Provost PJ 1979. Propagation of human hepatitis A virus in cell cul-ture in vitro. Proc Soc Exp Biol Med 160: 213-221.
Purcell RH, Wong DC, Moritsugu Y, Dienstag JL, Routenberg JA, Boggs JD 1976. A microtiter solid-phase radioimmunoassay for hepatitis A antigen and antibody. J Immunol 116: 349-356. Reed LJ, Muench IL 1938. A simple method for estimating fifty per
cent endpoints. Am J Hyg 27: 493-497.
Richards GP, Watson MA 2001. Immunochemiluminescent focus as-says for the quantitation of hepatitis A virus and rotavirus in cell cultures. J Virol Methods94: 69-80.
Ruchti F, Siegl G, Weitz M 1991. Identification and characterization of incomplete hepatitis A virus particles. J Gen Virol72: 2159-2166. Siegl G 1982. Structure and biology of hepatitis A virus. In HAJM
Szmuness (ed.), Viral hepatitis, Franklin Institute Press, Phila-delphia, p. 13-20.
Siegl G, de Chastonay J, Kronauer G 1984. Propagation and assay of hepatitis A virus in vitro. J Virol Methods9: 53-67.
Villar LM, Amado LA, Gaspar AM 2004. In situ enzyme immunoas-say for titration of a Brazilian hepatitis A virus strain (HAF-203).
Braz J Med Biol Res37: 1023-1027.