How does influencer
marketing impact brands in the
sportswear industry?
Exploring the effects of brand coolness, brand
attitude and purchase intentions.
Lena Johanna Jäkel
Dissertation written under the supervision of Daniela Langaro
Dissertation submitted in partial fulfilment of requirements for the MSc in
Management with a specialization in Strategic Marketing , at the Universidade
Abstract
Title: How does influencer marketing impact brands in the sportswear industry? Exploring the
effects of brand coolness, brand attitude and purchase intentions.
Author: Lena Johanna Jäkel
This study aims to investigate the impact of using influencers on Instagram as a communication tool for sportswear brands.
While exploring this research field, brand attitude and the newly developed construct of brand coolness were evaluated for their effects on purchase intentions. Moreover, the current study evaluates whether the number of influencers´ followers influences the results.
For that matter, an experimental study was conducted with comparison between subjects among three groups. Those three groups were designed to test brand attitude, brand coolness and purchase intentions of participants being exposed to influencer’s posts or brand’s posts. Further, the influencer marketing conditions differed in the number of followers (high number of followers/ low number of followers) to investigate the effects.
Quantitative data of 310 participants was collected through an online survey and analysed. The results of this study found no significant difference for influencer’s posts compared to brand’s posts on the constructs brand attitude, brand coolness and purchase intentions, besides one exception: The dimension ‘Rebellious’ of brand coolness.
Furthermore, the impact of using influencers with a high number of followers for the brand coolness dimensions ‘Desirability’ and ‘Positive Autonomy’ was proven to be positive. The study is the first one connecting brand coolness with the construct of purchase intentions and confirms a positive significant impact of all dimensions on purchase intentions. The results show that the brand coolness dimensions have a positive significant impact on brand attitude. Finally, this study provides an outlook on future research and limitations are discussed.
Keywords: Influencer Marketing, purchase intentions, brand attitude, brand coolness,
Sumário
Título - Qual o impacto do Marketing de Influenciadores nas marcas da Indústria de Vestuário
de Desporto? Explorando os efeitos da “coolness” da marca, da atitude da marca e de intenções de compra.
Autor: Lena Johanna Jäkel
Este estudo visa investigar o impacto de influenciadores como ferramenta de comunicação no Instagram para marcas de vestuário desportivo.
Nesta pesquisa, a atitude e a nova construção de frescura da marca foram avaliadas quanto aos seus efeitos nas intenções de compra. Também, se o número de seguidores dos influenciadores influencia os resultados.
Assim, foi implementado um desenho experimental comparando sujeitos de três grupos. Esses três grupos foram desenhados para testar a atitude da marca, o brand coolness e a intenção de compra dos participantes expostos aos postos de influenciadores ou da marca. Além disso, as condições de marketing dos influenciadores diferiram no número de seguidores (alto número de seguidores/ baixo número de seguidores) para investigar os efeitos.
Foram recolhidos e analisados dados quantitativos de 310 participantes. Os resultados deste estudo não encontraram diferença significativa para os postos de influência em relação aos postos da marca na construção da atitude da marca, frescura da marca e intenção de compra, além de uma exceção: A dimensão 'Rebelde' da frieza da marca.
Além disso, este estudo demonstrou dois impactos positivos: o uso de influenciadores com um alto número de seguidores em comparação com as dimensões "Desejável" e "Autonomia Positiva" da marca; dimensões de frescura sobre a atitude da marca.
Finalmente, o estudo é o primeiro a ligar a frescura da marca à construção da intenção de compra e confirma um impacto positivo de todas as dimensões na intenção de compra.
Palavras Chave: Influenciador de Marketing, intenção de compra, atitude da marca,
“coolness” da marca, indústria de vestuário de desporto, micro-influenciador, macro-influenciador.
Acknowledgements
First of all, I gratefully acknowledge the support, the advice given and the guidance of my supervisor, Professor Daniela Langaro. There is no doubt that her orientation, focus and availability in the process of my dissertation were crucial for accomplishing this research and the final delivery. Thank you for everything.
I would like to express my deepest appreciation to my parents for their unconditional love and care. Thank you for being there, giving me advice and supporting me whenever I need it.
In addition, a big thank you to my sisters and friends, who helped my through the challenging months with their friendship. Your encouragement and support helped me to achieve this stage in my life and I am endlessly grateful for you.
Finally, I would like to thank all respondents who answered my online survey and especially, the ones who shared my survey. Without your time spent to support my research I would not have been able to gather the results and conclusions of my dissertation.
Table of Contents
Abstract ... i
Sumário ... ii
Acknowledgements ... iii
Table of Contents ... iv
Table of Tables ... vii
Table of Figures ... viii
Table of Appendices ... ix
1. Introduction ... 1
1.1 Background ... 1
1.2 Relevance and purpose of the study ... 2
1.3 Research Questions ... 3
1.4 Research Objectives ... 3
1.5 Scope of the study ... 4
1.6 Significance and contribution of the study ... 4
1.7 Thesis structure ... 4
2. Literature Review ... 5
2.1 The Sportswear industry ... 5
2.2 Social media and eWOM ... 5
2.2.1 Social Media and the Sportswear Industry ... 6
2.3 Influencer Marketing ... 6
2.3.1 Sportswear brands and influencer marketing ... 7
2.6 Brand Perceptions ... 9
2.6.1 Brand attitudes ... 10
2.6.2 Brand Coolness ... 10
2.7 Number of followers on Instagram ... 12
3. Research Methodology ... 14
3.1 Research Objectives ... 14
3.2 Research Approach ... 14
3.3 Data Collection ... 15
3.3.1 Primary Data ... 15
3.3.2 Experimental design and stimuli ... 15
3.3.3 Questionnaire Design ... 16 3.3.4 Population ... 17 3.3.5 Sample Size ... 17 3.4 Data Analyses ... 18 4. Data Analyses ... 19 4.1 Introduction ... 19 4.2 Demographics ... 19 4.2.1 Age ... 19 4.2.2 Education ... 20 4.2.3 Occupation ... 20
4.2.4 Sportswear purchase behavior ... 21
4.3 Reliability Test ... 21
4.4 Validity ... 22
4.5 Mean Analysis and normality test ... 24
4.6 Pearson Correlation Test ... 24
4.7.1 Independent Sample t-test: Age, Education Level, Current Occupation and
sportswear purchase behavior ... 25
4.7.2 Independent Sample t-test: Consumer’s liking of the presented brand “Jiva Activewear” ... 26 4.8 Hypotheses Testing ... 27 4.8.1 Hypothesis 1 ... 27 4.8.2 Hypothesis 2 ... 28 4.8.3 Hypothesis 2a ... 28 4.8.4 Hypotheses 3 ... 29 4.8.5 Hypotheses 4 ... 30 4.8.6 Hypotheses 5 ... 31 4.8.7 Hypotheses 6 ... 32 4.8.8 Hypotheses 7 ... 33 4.9 Summary ... 33
5. Conclusions, Limitations and Future Research ... 35
5.1 Discussion ... 35
5.2 Recommendation and managerial implication ... 36
5.3 Limitations and future research ... 37
6. References ... I Appendices ... VIII
Table of Tables
Table 1: Experiment Conditions ... 19
Table 2: Age ... 20
Table 3: Level of Education ... 20
Table 4: Occupation ... 21
Table 5: Sportswear Purchase Behavior ... 21
Table 6: Cronbach's Alpha ... 22
Table 7: Principal Component Analyses ... 23
Table 8: Measure of Construct and Descriptive Statistics ... 24
Table 9: Pearson Correlation ... 25
Table 10: Independent Sample t-test – Demographic Variables influencer created post vs. brand created post (Age, Education Level, Current Occupation and Sportswear Purchase Behavior) ... 26
Table 11: Independent Sample t-test– Demographic Variables HNF vs. LNF condition (Age, Education Level, Current Occupation and Sportswear Purchase Behavior) ... 26
Table 12: Independent Sample t-test – Liking for the brand (influencer created post vs. brand created post) ... 27
Table 13: Independent Sample t-test – Liking for the brand for HNF and. LNF condition .... 27
Table 14: ANOVA H1 ... 28
Table 15: ANOVA H2 ... 28
Table 16: Regression Analysis H2a ... 29
Table 18: ANOVA H3 ... 30
Table 19: Regression Analyses H4 (a-g) ... 31
Table 20: Regression Analyses H5 (a-g) ... 32
Table 21: ANOVA H6 (a-g) ... 33
Table 22: ANOVA H7 (a-b) ... 33
Table of Figures
Figure 1: Age ... 20
Figure 2: Level of Education ... 20
Figure 3: Occupation ... 21
Table of Appendices
Appendix 1: “Definitions for Component Characteristics of cool brands and Relevant Citations form Prior Research” by Warren et al. (2019) ... VIII Appendix 2: Table of Items ... IX Appendix 3: Survey Flow ... X Appendix 4: Online Survey Questionnaire (English Version) ... X Appendix 5: Online Survey Questionnaire (German Version) ... XIX Appendix 6: Krejcie and Morgan Table ... XXIX
1. Introduction
1.1 Background
Today more than ever, companies face the challenge of finding ways to address their target groups fairly and adequately. Due to technological developments like social networks and the new media landscape, the communication conditions for companies have changed fundamentally in recent decades. A large number of saturated industries, an increasing number of brands and increasingly substitutable products force a harsh competition. One of those industries is the sportswear industry.
By the time one has finished reading this sentence, Nike has sold 25 pairs of sneakers (Pearson, 2016). This example shows the immense purchase power in the sportswear industry where an annual compound rate of more than 10% is expected until 2025 (Global Sportswear Market
Size & Share | Industry Trends Report, 2025, 2019). Big players like Nike and Adidas have to
deal with many competitors and new incumbent sportswear brands to fight their market share. Like all firms in a highly competitive environment, companies in the sportswear market increase their marketing measures. As a result, consumers are exposed to a large number of advertising messages and often feel overwhelmed by this mass of information. This feeling leads to a dilemma for marketers: traditional advertising, such as advertising on television, is no longer perceived as an efficient communication instrument due to consumers’ numbness towards traditional advertising. Nowadays, consumers rely more and more on peer-to-peer communication (Hughes et al., 2019).
Social media networks like Instagram offer companies a way to gain customers’ attention and increase their visibility. On social media, customers are enabled to communicate their individual experience with a brand or a product to hundreds and thousands of other people with only one click (Pearson, 2016). In that manner, social media made a change towards communication as we knew it and became the alternative marketers have been looking for. A survey conducted by Bughin et al. (2010) found word of mouth (WOM) to produce more than twice the sales of paid advertising – hence recommendations have an impact on the point of purchase. Mastering this new, digital form of communication contributes significantly to the success of a brand and is thereby crucial for the competitive sportswear industry.
(Liu et al., 2015; Talavera, 2015). Further, brands can use IM to connect to consumers naturally and let them spread WOM on social media (Rogers, 2016). Thus, IM has become vital for companies’ digital marketing strategies and is one of the most discussed topics in digital marketing these days (Talavera, 2015). Influential personas, e.g. singers and models, are used by brands to increase awareness and desirability. However, also actual influencers, whom are exclusively known for their social media accounts, are more and more utilized by brands. Previous research found IM to have positive effects on brand performance, namely purchase intentions (PI) (Lim et al., 2017). Those have been associated with the effects, which influencers have on brand attitude (BA) (Lim et al., 2017). Brand attitude qualifies as a measure of brand perception. Besides BA, the recently introduced concept of brand coolness (BC) is another construct to retrieve brand perceptions (Warren et al., 2019).
Coolness is not only an adjective used by children to express their liking for certain things, it also reflects consumers’ desirability and a company’s performance. This can be treated as a symbolic currency adding value and driving trends (Warren and Campbell, 2014).
Especially for sportswear brands, coolness is a decisive factor (Hofer, 2017). Sports, as well as the coolness, are about building a favorable identity (Campbell and Warren, 2015). One does sports or engage in fitness and a healthy lifestyle to become ‘a better version of themselves’. Recently, a newly developed construct on how to measure BC was introduced by Warren et al. (2019). In their research, they found various positive effects of brands being perceived as cool. The novelty of this construct makes it highly interesting and worth investigating. By proposing to test the new construct of BC for its effects on BA and PI in the context of the sportswear industry, this study evolves. Further, this study aims to investigate how IM impacts brands for this industry by analyzing consumer’s BA, perceived BC, and PI by comparing influencer’s posts with a brand’s posts on Instagram. The central theme of this dissertation evolves as “How does influencer marketing impact brands in the sportswear industry”.
1.2 Relevance and purpose of the study
With the rise of the digital world and social media platforms, a shift in marketing as we knew it occured. Understanding the world of social media and its networks, like Instagram, is essential to maintain these days in order to interact with consumers. Here, the sportswear industry is no exception. Given the importance of forming consumers’ brand perceptions, managers can benefit from this study by gaining new insights on whether IM can strengthen positive brand perceptions, namely BA and BC, for the sportswear industry. Managers can benefit from the findings by understanding the impact of IM in that context and plan their digital
marketing efforts accordingly. Also, the impact on PI is going to be tested to give further guidance to managers.
Finally, by investigating the effects of the influencer’s number of followers on the constructs of BA, BC, and PI, managers are provided with insight on whether to use macro-influencer (followers > 1 Mio.) or micro-influencers (followers < 100.000) for their marketing activities.
1.3 Research Questions
Previous research revealed that a positive BA leads to enhanced PI. In the context of IM, such a favorable BA appears when compelling influencers are used in advertising (Lim et al., 2017). This research aims to gain knowledge if the same holds for BC. Thereof, the first research question evolves as:
RQ1: What is the effect of influencer marketing on purchase intentions in the context of the sportswear industry, and how do brand perceptions, namely, brand coolness and brand attitude, influence these?
Additionally, previous research has suggested that people rather follow influencers on Instagram with a high number of followers partly because they are perceived as more popular (Veirman et al., 2017). At the same time, the source stated that their popularity can weaken a brand’s perceived uniqueness, which might affect customers’ BA. This study aims to further investigate the topic by researching the impact of the number of followers (high number of followers = 5.3 Mio (HNF); a low number of followers = 55k (LNF)) an influencer has on the constructs of BA, BC, and PI. Thereof, the second research question derives as:
RQ2: How does the influencer’s number of followers affect brand perceptions, namely, brand attitude and brand coolness, and purchase intentions for the sportswear industry?
1.4 Research Objectives
The main objectives of this study are to determine the impact of whether people are exposed to an influencer created post or brand’s created post on Instagram and scrutinize the difference between those two groups in terms of BA, BC and PI. Additionally, the effects the constructs mentioned above have on each other are tested. Finally, this research aims to determine if there is an effect of the number of followers (HNF vs. LNF) an influencer has on BA, BC, and PI.
1.5 Scope of the study
This study is referring exclusively to the sportswear industry. Regarding the choice of a social media platform, this study focusses on Instagram since it is the most powerful and widely used platform nowadays. Furthermore, this study focusses on the female gender due to women playing a key role in athletic wear these days (Salpini, 2019) and them dominating the IM world (Karwowski, 2019).
1.6 Significance and contribution of the study
Due to the high competition in their branch, sportswear brands need effective ways to get to their target groups. Since IM is on the rise, this study aims to investigate how IM affects BA, BC, and PI for the industry. Also, the number of followers an influencer has will be taken into consideration in this study since the number of followers often is a criterion for choosing an influencer to collaborate with for marketing activities.
This study has two contributions: a practical and theoretical contribution. For the practical contribution, this study focuses on the sportswear industry, considering IM on Instagram. As a theoretical contribution, this study evolves by combining the constructs of BC, PI, and BA. Additionally, it investigates the effects of IM on those constructs.
1.7 Thesis structure
This thesis is divided into five separate chapters. The next chapters will review previous studies and highlight the underlying theories that support the relationships between BA, BC, and PI. Furthermore, literature regarding background information on social media and WOM will be reviewed, and finally, IM will be discussed. By considering these theories and concepts in the context of the sports industry, this study evolves from previous research.
In the third chapter, the methodology for this study, like sample size, population, sampling method, will be explained.
Afterwards, the gathered data will be analyzed and formulated hypotheses will be tested in chapter four.
Finally, chapter five includes the summary and conclusions of this research as well as implications for further research.
2. Literature Review
In this chapter, all relevant theories, previous work, and insights are provided and will be discussed in the context of the sportswear industry.
2.1 The Sportswear industry
The global sportswear market is growing. A healthy lifestyle is becoming increasingly important to a broad audience due to the obvious health benefits and gains awareness constantly. Trends like yoga, running, and other fitness activities are driving the sportswear market, and sports events, such as the Olympic Games, foster the its growth (Global Sportswear
Market Size & Share | Industry Trends Report, 2025, 2019). The numbers speak for themselves:
The global sportswear market was estimated at USD 239.78 billion in 2018 and is expected to have a compound annual growth rate of 10,4% from 2019 to 2025 (Global Sportswear Market
Size & Share | Industry Trends Report, 2025, 2019). Regarding the segments of the sportswear
industry, the clothing segment is predicted to have the most robust compound annual growth rate of 10,7% for that timeframe (Global Sportswear Market Size & Share | Industry Trends
Report, 2025, 2019)
With market growth, competition in the sportswear market is fierce. Innovative brands that disrupt the sportswear market through social media give even well-established brands a hard time to be noticed and to stay relevant. Strategies to connect to customers are much-needed. Especially via social media, brands can gain awareness, shape their brand perceptions, and stand apart from the crowd.
2.2 Social media and eWOM
With Web 2.0, social media, and the ubiquitous internet, mass communication transformed from one-way to two-way communication (Wang and Rodgers, 2011). The internet allowed “the democratization of knowledge giving companies, public or private; brands small or big; and people local or celebrity, an equal footing to share information”(Booth and Matic, 2011). With the evolution and advent of social media (SM), the particular form of communication
‘electronic word of mouth’ (eWOM) emerged (Cicvaric Kostic et al., 2018). SM can be
defined as web-based applications “(…) that build on the ideological and technological foundations of Web 2.0, and that allow the creation and exchange of User Generated Content”
and claim their brand preference to others within seconds. Therefore, SM represents an ideal tool for eWOM (Knoll, 2016; Veirman et al., 2017).
eWOM is closely related to consumer-generated content and became popular with the rise of SM (Wang and Rodgers, 2011). Hennig‐Thurau et al. (2004), defined it as “(…) any product or negative statement made by potential, actual, or former customers about a product or a company, which is made available to a multitude of people and institutions via the internet”. Previous research has shown that eWOM and information gained through interpersonal communication influences consumers’ decision-making more than traditional advertising (Goldsmith and Clark, 2008). If a fellow consumer is communicating a similar message, it is found more authentic and credible compared to being transmitted by an advertiser (Veirman et al., 2017). That makes eWOM one of the most widely discussed and exciting topics for marketers. With the rise of SM and eWOM, advertising has changed fundamentally. Higher proportions of media budgets shifted towards SM as a response to its growth and importance (Saxena and Khanna, 2013). Further, digital marketing strategies towards SM and eWOM were developed. Especially for brands reaching out to generations Y and Z, the integration of SM in one’s marketing strategy is critical (Obradović et al., 2017). Brands discovered that potential and tried to reach out to and connect their customers in that way. Also, sportswear brands have to be established on SM to not lose their relevance.
2.2.1 Social Media and the Sportswear Industry
Various websites report on SM trends for the sportswear industry (Connor, 2019; Suntinger, 2018; Unmetric, 2018). The primary and most engaging topic in the sportswear industry on SM is “new collection” (Unmetric, 2018). That shows the central role of SM for the industry as a platform to promote their products, especially new collections, to generate awareness for the brand and their products, and ultimately increase sales.
2.3 Influencer Marketing
With the rise of SM digital influencers evolved. “A social media influencer is first and foremost a content generator: one who has a status of expertise in a specific area, who has cultivated a sizable number of captive followers– who are marketing value to brands– by regularly producing valuable content via social media.”, defined Lou and Yuan, (2019).
The marketing strategy of using the influence of those opinion leaders to drive consumers’ BA and PI is called influencer marketing (IM) (Lou and Yuan, 2019). By using influencers as intermediaries when communicating with consumers, brands can leverage the relationship of
influencers to their audience and the emotional connection between them (Uzunoğlu and Misci Kip, 2014). Influencers obtain the halo-effect, due to their perceived credibility and followers feel obligated to keep up to their activities. They are observing, engaging and talking about influencers (Hoos, 2019).
”94% of marketers who have used influencer marketing campaigns found them effective” (Lou and Yuan, 2019) as a recent report stated. Additionally, the SM report claims that IM yielded eleven times the return on investment (ROI) compared to traditional advertising (Ahmad, 2018). Also, only 33% of consumers still trust traditional advertising, whereas 90% do trust peer recommendation (Ahmad, 2018). Those numbers support sources claiming IM “becoming one of the hottest trends in social media”(e.g. Cicvaric Kostic et al., 2018). “The Rise of Digital Influence", (2012) stated, “businesses will spark beneficial word of mouth, create brand lift, and ultimately influence the actions of other consumers much more authentically than does traditional marketing” when an efficient influencer strategy is used. There seems to be no doubt that IM is a significant field of digital marketing these days. That emphasizes why it should be further be explored to provide managers with well-researched findings to support their decision making.
2.3.1 Sportswear brands and influencer marketing
With strong leading brands, such as Nike, Adidas and Under Amour, and incumbents who established themselves through SM during the last years, like Shark sportswear and Aim’n Apparel, the competition in the sportswear market is fierce. Implications on how to get on top of consumers’ minds and win their hearts are desired. One common way to generate awareness and appear more desirable is to use brand ambassadors who are hyped on SM, says Mr. Björn Gulden, boss of Puma (Hofer, 2017). Puma has gathered celebrities like singer Rihanna and musician The Weekend around them to promote their brand. However, Puma is not the only brand doing so. Adidas is another example of a sportswear brand collaborating with high profile celebrities. They teamed up with rapper Kanye West and singer Rita Ora to shape their brand image. Adidas is earning every third Euro from lifestyle products, therefore their engagement shifted (Hofer, 2017). Sportswear brands, like Adidas, are engaging more in building their brands around the lifestyle than around their core business sports. That is where influential personas such as celebrities help. Especially when they have a massive audience on their SM, they spread awareness.
as so-called influencers. Besides prominent influencers also actual influencers are frequently used by sportswear labels to endorse their brand. Nike did a 60-second creative workout challenge in cooperation with influencers, e.g., Jenna Alvarez, where the influencer encouraged their followers to do the workout and repost it on their channel (Ong, 2018). By choosing actual influencers, brands are offered a broader and more complex range of influencers. They might be specialized in the field of sports, known for being a role model in terms of lifestyle or have an especially strong emotional bond with their followers which makes them a valuable partner in communication.
Big established brands like Adidas, Puma, or Nike can effort to further shape their brand with the support of megastars or influencers with massive follower bases. Smaller brands, however, cannot. The case of Lululemon, a by now very well established sportswear brand, known for being one of the best yoga wear brands, has never spent big budgets on celebrities (Sugrue, 2018). They focus on micro-influencers, such as yoga instructors, to maintain incredible authenticity and build a loyal community (Sugrue, 2018). With their strategy, they aim to use that micro-influencers connection to their audience to reach out to their follower base, which turned out to be successful (Sugrue, 2018). These conflicting cases show that there is an urgent need to clarify whether sports brands benefit from influencers with high follower numbers.
2.4 Instagram as a social media platform
Instagram was founded in 2010, and since has become one of the most widely used SM platforms. The platform allows users free access and offers them the possibility to share pictures and videos through their mobile devices. With 1 billion active users worldwide and more than 500 million daily users, Instagram is one of the most relevant SM platforms nowadays (Aslam, 2019). Phua et al. (2016) conducted a study on consumers’ usage of SM platforms where they found Instagram to be the most used platform to follow brands (Veirman et al., 2017). Further, Instagram is the fastest growing social network globally and has become an empowering medium in the world of social networking among young consumers (Lee et al., 2015).With the help of Instagram, companies can use visual content instead of plain presenting of textual information to connect to consumers and, if doing it right, are rewarded with engagement of consumers (Virtanen et al., 2017).
Given Instagram’s relevance for dominating engagement with sportswear brands (Prestipino, 2017), this study focuses on researching that specific platform.
2.5 Purchase Intentions
Consumers aim to gather information on the products or services they intend to buy to decrease the risk of making the wrong decision (Thirumalai and Sinha, 2011). This is based on the theory of planned behavior (TPB) which states that this intention is the antecedent of all behavior (Ajzen, 1991). That means that all behavior results from something and is a cause of behavior-relevant information (Ajzen, 1991). Based on the assumption that humans are rational beings and make their decisions according to the information available, the concept of PI is closely linked to consumer behavior and their perceptions.
During the decision-making-process, different attributes and factors are considered and evaluated before finally purchasing a product. Individual customer's criteria and standards for their evaluation might differ. Based on the perceived value of a product, consumer's PI derives (Lee and Lee, (2009), Spears and Singh, 2004). PI can be defined as “an individual’s conscious plan to make an effort to purchase a brand” (Spears and Singh, 2004).
According to Hearn and Smith, consumers decide based on Instagram profiles, posts, and comment on whether or not to buy a product (Hearn, 2019; Smith, 2019). “72% of Instagram users report to make purchase decisions based on something that they saw while browsing the app…” Smith, (2019) stated in a recent blog post. That makes Instagram a critical tool to foster consumers’ PI. Previous literature found advertisements that include a celebrity to generate higher PI (Daneshvary and Schwer, 2000; Friedman et al., 1976; Pradhan et al., 2014). Lim et al. (2017) found the same effect for influencers. Online sources point out that influencers have even higher rates of engagement compared to celebrities (Smith, 2019). Instagram's power to enhance consumer's PI is closer investigated in this study. Therefore, the first hypothesis was developed for this study:
H1: Respondents exposed to influencers created posts recommending a sportswear brand will have significantly higher scores on PI for a sportswear brand, compared to respondents, exposed to brand created posts.
2.6 Brand Perceptions
Due to the TPB, the attitude towards a behavior is highly essential and influences intentions (Ajzen, 2012). The same holds for the attitude towards a brand, as previous research showed (Faircloth et al., 2001). Therefore, the BA will be researched as one of the main concepts for measuring brand perception.
Due to the novelty of the construct and relevance of coolness for the sportswear industry, the construct of BC will be researched as well.
2.6.1 Brand attitudes
Brand attitudes (BA) are ‘consumers’ overall evaluation of a brand’ (Keller, 1993). Their
evaluations are important when it comes to decisions between different alternatives and have an impact on the final purchase (Kotler and Armstrong, 2010). Attitudes do guide the thoughts of consumers, have an impact on their feelings, whether they are favorable or unfavorable, and consequently affect consumers’ behaviors. Consequently, positive BA leads to an increase in market share and thus make brands more successful and profitable (Faircloth et al., 2001). BA, like all forms of brand perceptions, contribute to brand equity (BE). BE is based on consumers’ favorable evaluation and attitudes towards a brand and differentiates brands from unbranded products (Faircloth et al., 2001). Further, BE represents the value of a brand since a positive BE was proven to have a positive linear relationship with PI (Uthayakumar and Senthilnathan, 2011).
Recent studies have focused on how consumers’ favorable attitudes towards advertised brands lead to PI (e.g., Keller, 1993; Singh and Banerjee, 2018). Furthermore, Lim et al. (2017) conducted research on SM influencers’ effectiveness and found the use of compelling influencers to have a positive impact on consumers’ BA. This study is going to research whether the same effect holds for the sportswear industry to give guidance to managers of sportswear brands in that matter. In this sense, the following hypotheses are formulated:
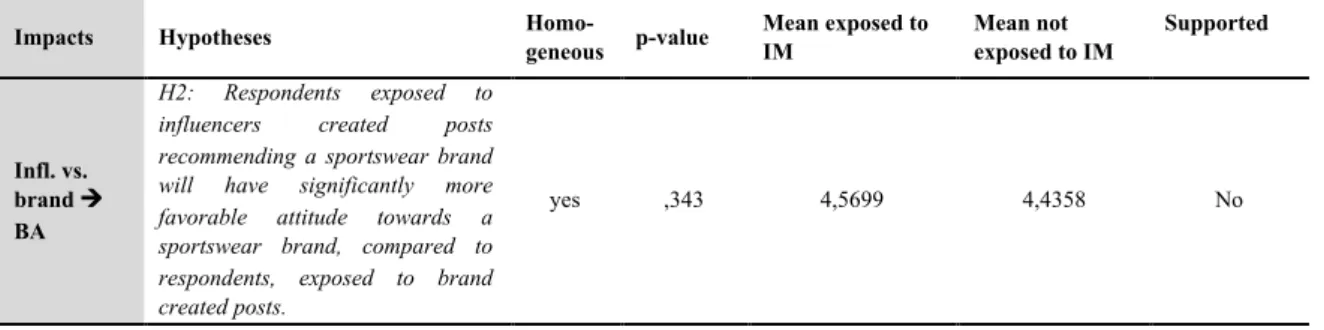
H2: Respondents exposed to influencers created posts recommending a sportswear brand will have a significantly more favorable attitude towards a sportswear brand, compared to respondents exposed to brand created posts.
H2a: A favorable brand attitude has a positive effect on purchase intentions for sportswear brands.
2.6.2 Brand Coolness
As previously discussed, due to fierce competition in a growing market, sportswear brands need to stand out. Coolness for sports brands is a decisive factor that is not to be underestimated. Literature offers a qualitative and broad understanding of what cool is (Belk et al., 2010; Nancarrow et al., 2002). It has been said to be a social construct (Warren and Campbell, 2014), subjective (Warren and Campbell, 2014), dynamic (Belk et al., 2010) and is “more than merely another way of saying something is good or desirable – it comes with a baggage” (Pountain &
Robbins, 2000, p. 32). The cool factor adds symbolic currency and drives trends (Warren and Campbell, 2014), which is what makes marketers thrilled when thinking about brands like Nike or Apple.
Coolness is not only a phrase used in the backyards of schools; it is much more than that as the case of Levi’s proves. Levi’s, the world’s largest denim brand, struggled in the 2000s and had to deal with a loss in market share. The occurrence of their struggles was closely linked to Levi’s losing its ‘cool factor’ (Bain, 2018).
Various positive outcomes of brands being perceived as cool have been suggested (Warren et al., 2019). According to Warren et al. (2019), consumers have more favorable BA towards cool brands, they are more familiar with the brands, more WOM is generated, and they can command a price benefit, to name a few. This study is the first that aims to connect the fields of research on IM with the new construct of BC. Further, the goal of this research is to find out whether BC affects BA and PI.
An article published in 2018 it stated “the Kardashian-Jenner family’s embrace of Levi’s is one indication that the brand is back on the radar of young shoppers” (Bain, 2018). Also, the statement by Mr. Heinrich from the consultancy firm Fjord “With megastars you buy increased sales, prominence and coolness for a short time. But you don’t become cool just by buying coolness.” awakens the impression that coolness is linked to influential personas (Hofer, 2017). Further, he is convinced brands need to give people the chance to tell their stories and influencers with a rather small follower base as well can tell good, compelling stories. Additionally, they are more closely connected to their target audience as a celebrity (Hofer, 2017). That raises the question if influencers have an impact on perceived BC. Based on these findings, the following hypotheses are formulated:
H3: Respondents exposed to influencer created posts recommending a sportswear brand will have significantly higher effects on dimensions of brand coolness for a sportswear brand, compared to respondents, exposed to a brand created posts. This impact is reflected on: H3a) Desirability; H3b) Positive autonomy; H3c) Rebellious; H3d) High status; H3e) Popular; H3f) Subcultural; H3g) Iconic.
H4: The dimensions of Brand coolness have a direct and significant impact on brand attitude for sportswear brands with effects from H4a) Desirability; H4b) Positive autonomy; H4c) Rebellious; H4d) High status; H4e) Popular; H4f) Subcultural; H4g) Iconic.
H5: Brand coolness has a direct and significant impact on purchase intentions for sportswear brands with the effects of H5a) Desirability; H5b) Positive autonomy; H5c) Rebellious; H5d) High status; H5e) Popular; H5f) Subcultural; H5g) Iconic.
The characteristics to measure BC by Warren et al. (2019) are used in this study to investigate the hypotheses. Due to the authors “Cool brands are perceived to be extraordinary, aesthetically appealing, energetic, high status, rebellious, original, authentic, subcultural, iconic, and popular.”. It is to be noted that the three characteristics ‘extraordinary’, ‘aesthetically appealing’ and ‘energetic’ load to the higher-order factor ‘desirability’(Warren et al., 2019). The other higher-order factor is ‘positive autonomy’ which includes the characteristics ‘original’ and ‘authentic’. Those two higher order factors plus the five first-order factors ‘high status,
rebellious, original, authentic, subcultural, iconic, and popular’ will be measured in the scope
of this study. Further, (Warren et al., 2019) found that desirability and positive autonomy are most strongly associated with BC whereas ‘iconic’ and ‘rebellious’ were the factors with the relatively lowest ratings. That has to be taken in mind regarding the analysis of the outcomes. Definitions of the component characteristics of coolness can be found in appendix 1.
2.7 Number of followers on Instagram
To assess an Instagram account or a brand, people rely on peripheral cues such as the number of followers. Micro-influencers are i.e., industry experts, bloggers, or experts with a follower-base of 1000 to 999.999 followers, whereas macro-influencers have more than 1 million followers, such as Chiara Ferragni or Kylie Jenner (Barker, 2019; Fitzpatrick, 2017). Regarding perceived trust, higher engagement, overall impact, and costs micro-influencers seem to be the smarter solution for brands due to Fitzpatrick, (2017). On the other hand, there is no doubt, using macro-influencers will reward a brand with a broad reach. Virtanen et al., (2017) state the importance of many followers, comments and likes for brands to become successful on Instagram because people will instead follow those brands than brands with fewer likes. That is connected to people perceiving an influencer with many followers as more popular (Veirman et al., 2017).
As discussed in chapter 2.3.1, sportswear brands that are well established and have the necessary financial resources to use celebrities or influencers with a huge follower base which are able to create a massive buzz on SM to boost desirability and popularity. As the case of Lululemon suggests, the authenticity by using micro-influencers can also be beneficial.
This study aims to further investigate in that field by taking the findings of Veirman et al., (2017) into account and research the impact of influencers’ number of followers on brand perceptions, namely BA and BC. The results shall give guidance to sportswear brands whether to use micro- or macro-influencers. Thereof, the following hypotheses are formulated:
H6: Using influencers with high numbers of followers (>1 Mio.) will lead to significantly higher effects on the dimensions of brand coolness, compared to an influencer with a low number of followers (< 100k). This impact is reflected on: H6a) Desirability; H6b) Positive autonomy; H6c) Rebellious; H6d) High status; H6e) Popular; H6f)Subcultural; H6g) Iconic.
H7: Using influencers with high numbers of followers (> 1 Mio.), compared to an influencer with a low number of followers (< 100k), will lead to significantly higher effects on H7a) brand attitude and H7b) purchase indentions.
3. Research Methodology
This chapter will present the methodology of this research. It will be described how the data was collected, measured, and analyzed. Also, the conduction of the online survey to test the hypotheses are explained.
3.1 Research Objectives
The impact of whether people are exposed to an influencer’s posts or a brand’s post on Instagram on a set of dependent variables (BA, BC, and PI) is going to be tested. Further, the impact these dependent variables have on each other is going to be researched. Finally, the impact of the number of followers of an influencer (5.3 Mio. vs. 55k) on the dependent variables will be scrutinized. All will be researched in the context of the sportswear industry.
3.2 Research Approach
This research was developed in different phases. Firstly, exploratory research to gain the main understandings of the topic of this research was applied by gathering information from various academic papers and sources. The goal of this step was to get a keen understanding of the central theme of this academic paper. Through descriptive research, the main subject was explained in-depth and previous research in combination with existing thoughts on the topic were combined to develop a full understanding of this research’s topic. A quantitative approach for this research was chosen due to the various advantages of this method, such as being more scientific, control-sensitive, and less biased. Amaratunga et al. (2002) state the importance of quantitative research for generating statistical proof or relations between constructs which is one of the aims of this research and further validates the choice of this method. Further, quantitative research makes the findings generalizable, which is essential when applying this research to real-life scenarios. This type of research is often used to predict popular patterns of human actions which suits this research topic well (Djamba and Neuman, 2002).
To provide strong reliability and validity of the result when investigating several hypotheses, the quantitative approach was utilized to verify this research.
3.3 Data Collection
On purpose of this study an online survey was conducted to retrieve quantitative primary data. This way consumers were interviewed directly and previously formulated hypotheses were tested.
3.3.1 Primary Data
Primary data gives insight on direct respondents' thoughts, ideas, and feelings (Shaughnessy and Zechmeister, 1997) and provides information on their beliefs, attitudes, and motives (Amaratunga et al., 2002). By designing a survey, additional information relevant to the sample can be assessed, and further conclusions of generalizations can be made regarding the sample and population (Creswell, 1999). Especially the time efficiency, costs, and the easiness of obtaining a large sample were reasons for deciding to use an online survey.
Finally, conducting an online survey is a widely accepted and used method of conducting research in digital marketing especially (Grover and Vriens, 2006; Leeflang et al., 2014). The online survey was created via the online platform Qualtrics. By distributing the survey on SM (Instagram and Facebook) and via a messenger (WhatsApp), as well as through personal e-mails, it was possible to target a broad audience in a short timeframe of seven days and get answers quickly. To make the survey convenient for the participants, it was available in two languages, English and German. This was decided because a lot of German native speakers were expected to participate in the survey due to the distribution, but also international participants should be able to participate (see appendix 4 and 5).
3.3.2 Experimental design and stimuli
The study is based on a between-subject experiment. In the between-subjects experiment, different participants are randomly assigned to one of the three conditions and are tested based on their exposure to certain stimuli (Charness et al., 2012). The decision to design a between-subject experiment rather than a within-between-subject experiment was made to prevent the study from cofounds.
The three conditions of the experiment of this study are the following: In the first condition participants are exposed to influencer created posts which are advertising a sportswear brand, where the influencer has a high number of followers (5.3 Mio.). The second condition is exposing the participants to the same influencer created posts, this time the influencer has a low number of followers (55.000). In the third condition, the participants are exposed to the same posts but this time they are created by the sportswear brand itself. Later, all groups are tested
influencer condition; a low number of followers (LNF) influencer condition and a brand condition.
For the experiment a fictional influencer and a brand had to be created to set the right stimuli for the experiment. Choosing an actual influencer might have biased the participants and the previous study by Veirman et al. (2017) used the same for their research. Therefore, pictures of a real-life influencer were used and based on various actual influencers' Instagram profiles, the fictional influencer's profile was created. It was designed as a stereotypical female Instagram influencer specialized in lifestyle and fitness (see appendix 4). Accordingly, her caption was designed (Ellee June | 25 y/o | Follow my journey | Health | Fitness | Positive Mindset). For IM it is essential to ensure a good brand fit of the influencer to make it efficient for a brand. Therefore, a pre-study was conducted were ten participants had to evaluate the fictional influencer's profile according to its fit for a yoga sportswear brand. This way, it was assured that a poor brand fit could not manipulate the results of the study.
Furthermore, a fictional brand was created. Again, this was done to not bias participants with their preoccupied opinions on known brands. The brand was introduced as “Jiva Activewear”. The brand name was chosen with the intent to be a reference to the yoga scene. Jiva means “individual soul” in Hinduism (Collins Dictionary, 2019) and is known in the yoga scene. The pictures featured in the brand's account were the same as for the influencer, to not set different stimuli. Further, the number of followers was 55.000 (55K).
Regarding the number of followers of an influencer, the fictional influencer had 55.000 (55k) followers in the low number of follower (LNF) condition since the literature refers to influencers with followers up to 100k as micro-influencers.
For the high number of followers (HNF) condition, 5.3 Mio. followers were chosen, since macro followers are considered to have more than 1 Mio. followers.
In total, three different groups were created to be able to compare the influencer and brand condition but also the influencer with the LNF condition and the influencer with the HNF condition. An overview of the profiles and posts can be found in appendix 4.
3.3.3 Questionnaire Design
The questionnaire was created to ensure the credibility and validity of the results. Further, the purpose of the between-groups experiment had to be fulfilled.
In the first part of the survey, the right audience was selected. Therefore, it was asked for gender, use of Instagram, and their sportswear purchase behavior. People who did not match the target audience – male participants, non-Instagram users, or people who do not purchase sportswear
were eliminated from the study as they are irrelevant for the study and might adulterate the results.
Next, each participant was randomly assigned to one of the three conditions in this experimental study and the study unfolded in three blocks: One condition exposed participants to the posts of a fictional influencer “Ellee June” who was sharing posts of the fictional brand “Jiva Activewear”. In the HNF condition, the influencer had 5.3 Mio. followers.
The LNF condition was designed identically besides the influencer had fewer followers (55k) in that scenario. Participants of the third condition were exposed to the brand Jiva Activewear’s profile and posts. In all three conditions, pictures, the number of likes, and the number of people following the account were held constant to not bias the participants and make the groups comparable.
After exposing the participants to the stimuli, they were asked to answer the same catalog of questions. Those questions were adapted from previous research and are the basis for answering the hypotheses later (see appendix 2). All questions were answered on a 7-point-Likert scale, being (1) Completely Disagree, (4) Nether agree nor disagree (7) Completely agree, to make the evaluation of the data as easy as possible.
Finally, the demographics of the participants, like age, nationality, and education level, were inquired. The whole questionnaire can be viewed in appendix 4 and the table of items can be found in appendix 2.
3.3.4 Population
Since women are dominating the IM world these days (Karwowski, 2019) and sources claim woman are said to play a key role in athletic wear these days (Salpini, 2019), the researcher decided to introduce a female influencer for the scope of this study. As discussed before, Instagram, as the most important SM network, was chosen for the scope of the study, which means all participants of the study need to have experience with using Instagram. Also, participants had to be sportswear purchasers to be relevant, given the research being specifically for that industry.
3.3.5 Sample Size
To determine the right sample size is of high importance to a study since if a too-small sample is chosen, the results would lack power, and a too-large sample would be a waste of resources (Bonett, 2002).
this research addresses a large sample size, that was used as a benchmark. Further, the sample size of a relevant study by Warren et al. (2019) was taken into consideration, which had 315 participants. Hence, the optimal sample size includes between 315 and 384 respondents.
3.4 Data Analyses
The collected data was analyzed by using the program IBM statistics SPSS version 25. This way, the data could be quantified regarding the hypotheses.
Before beginning the analysis, the data set had to be cleaned. Non-complete answers were diminished and variables were computed to prepare the data set for the analyses.
The first step to get a better understanding of the sample was to analyze the demographics and the sportswear purchase behavior by using descriptive statistics. In the next stage, the Cronbach’s Alpha was used to check the reliability of this study’s constructs. Further, by applying Principal Component Analysis (PCA), the linear components of a set of variables were identified in order to extract the nine different factors from the 45 items of the questionnaire. The Kolmogorov-Smirnov test was applied to check if the sample was following a normal distribution. This was not confirmed. However, according to the Central Limit Theorem, all variables can be considered normally distributed, due to the sample size being larger than 30 (Uttley, 2019). Hence, parametric tests were used.
Afterwards, the groups of the different conditions of the between-subject experiment had to be compared in terms of demographics, sportswear purchase behaviour, and likability for the brand to ensure that the groups are equal. Finally, by ANOVA test and regression analysis, the hypotheses were tested. For all those tests the confidence level used was 95%, thus when the p-value was inferior to 0.05 the hypotheses were rejected.
4. Data Analyses
4.1 Introduction
According to the statistical methods chosen, the data analyses of this research are provided in this chapter. It is the goal of this chapter to reach conclusions for the previously introduced research questions and test the hypotheses.
4.2 Demographics
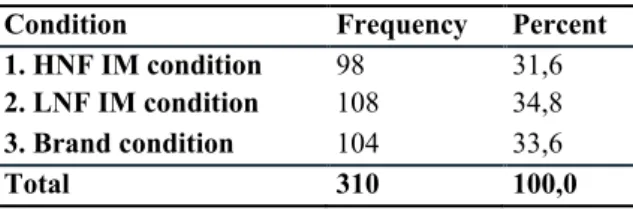
For this research, 310 fully completed answers were collected via Qualtrics; this makes the sample size N= 310. The sample was split into three groups by the randomizer. One group was exposed to the LNF IM condition (N=108), another group was showed the HNF IM condition (N=98), and last group was presented the brand condition (N=104); see Table 1: Experiment Conditions. Due to deleting incomplete answers and cleaning the data set, not all groups had the same sample size. Besides frequencies, the percentage is used in the following sections to describe the sample more accurately. Since the data set includes only fully completed answers, the values of valid percentage and cumulative percentage are not shown in the tables since they are equal to the percentage value.
Table 1: Experiment Conditions
Please note, that this study focusses on females only. Male participants had to leave the study after the first question.
4.2.1 Age
As shown in Table 2, the majority of the sample (47,4%; N=147) belongs to the age group 18-24. Additionally, participants of age 25-35 had a considerable share of the sample (36,5%; N=113) 9,7% of the participants were under 18 (N=30) and participants of the age 45 or older were in total four in total, which is 1.3% of the sample. That makes participants aged 18-34 the core group of the sample, as shown in Figure 1.
Condition Frequency Percent 1. HNF IM condition 98 31,6 2. LNF IM condition 108 34,8 3. Brand condition 104 33,6
Table 2: Age
Figure 1: Age
4.2.2 Education
The majority of the sample obtains a high school degree (39,4%; N= 122), see Table 3. The second-biggest share of the sample were participants (N= 102) who have a bachelor's degree (32,9%). 17,4% of the participants (N=54) have a master's degree. ‘Less than high school’ answered 30 people of the sample (=9,7%) and only two participants (=0,6%) obtain a doctoral degree. All results are displayed in Figure 2.
Table 3: Level of Education
Figure 2: Level of Education
4.2.3 Occupation
Regarding the occupation, more than half of the participants were students (53,2%; N= 165). The next biggest group was the once of employed participants (30,6%; N= 95). 14,2% of the sample were high school students (N=44). The minority of the sample was unemployed participants (1,3%; N=4) and retired (0,6%; N=2). All results are displayed in Figure 3.
Frequency Percent Under 18 30 9,7 18 - 24 147 47,4 25 - 34 113 36,5 35 - 44 16 5,2 45 - 54 3 1,0 55 - 64 0 0 65 or older 1 ,3 Total 310 100,0 Frequency Percent Less than High School 30 9,7
High School 122 39,4
Bachelor Degree 102 32,9
Master Degree 54 17,4
Doctoral Degree 2 ,6
Table 4: Occupation
Figure 3: Occupation
4.2.4 Sportswear purchase behavior
People who do not purchase sportswear were not allowed in this study. Most participants of this research purchase sportswear 1-2 times a year (48,4%; N= 150). Also, participants buying sportswear 3-4 times a year make a significant share of the sample (31,6%; N= 98). People buying sportswear less than once a year were represented by 11,9% (N=37) in this study. 7,1% (N= 22) said they purchase sportswear each month. Moreover, 3 participants (1%) claimed to get new sportswear more than once a month.
Frequency Percent Less than once a year 37 11,9
1-2 times a year 150 48,4
3-4 times a year 98 31,6
Every month 22 7,1
More than once a month 3 1,0
Total 310 100,0
Table 5: Sportswear Purchase Behavior
Figure 4: Sportswear Purchase Behavior
4.3 Reliability Test
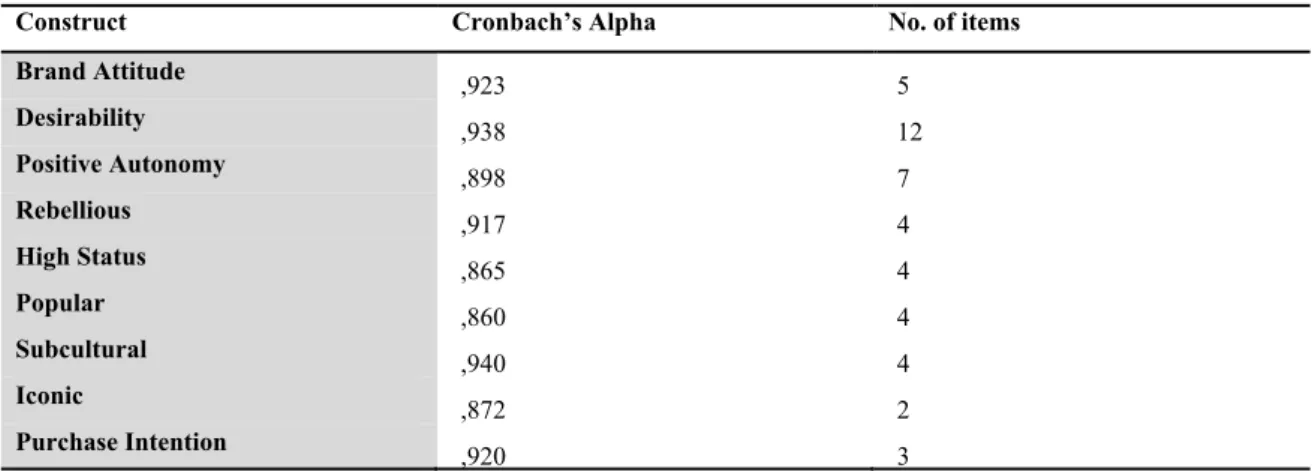
It is necessary to carry out a test of reliability to provide information about the internal consistency of the study. Therefore, Cronbach's Alpha was used. Nunnally and Bernstein, (1978) suggested internal consistency according to Cronbach’s Alpha. The values of this research are all above 0.8, which means they are right regarding internal consistency. For PI, subcultural, rebellious, desirability and BA the Cronbach's Alpha values are higher than 0.9.
Frequency Percent High School Student 44 14,2
University Student 165 53,2
Employed 95 30,6
Unemployed 4 1,3
Retired 2 ,6
would mean the variables would be redundant. None of the values are higher than 0.95, which makes them internally consistent. Therefore, the analyses can continue.
Table 6: Cronbach's Alpha
4.4 Validity
Since items and questions from previous studies were adopted, it is necessary to do a principal component analysis (PCA) for all factors. This way, we can investigate the matter of unidimensionality for the factors is investigated and the validity can be evaluated. The validity assesses the degree to which the given data really measures what was intended with this study. For this study, three constructs are researched. Due to BC being split into seven factors, nine factors will be presented in the following. All factors were composed of several items (e.g., PI was composed of 3 items).
Besides the PCA for the BC variables analyzed in this study, two more principal component analyses were run separately. One of them was for the variable desirability. This factor is a so-called “higher-order” factor (Warren et al., 2019), which is why it has three different components: ‘Usefulness’, ‘energetic’, and ‘aesthetically appealing’.
Another “higher-order” factor is positive autonomy. This higher-order factor is composed of the factors ‘original’ and ‘authentic’.
The three subfactors of desirability and positive autonomy have different meanings. Therefore, they are extracted separately for the PCA since it makes sense that each of those subdimensions contributes to one factor.
According to Table 7, we find all factors explained individually. The result of the PCA shows a good KMO value of KMO =,833 (Hair et al. 2010). Also, the level of p-value = ,000 < 0,05 is acceptable.
Construct Cronbach’s Alpha No. of items Brand Attitude ,923 5 Desirability ,938 12 Positive Autonomy ,898 7 Rebellious ,917 4 High Status ,865 4 Popular ,860 4 Subcultural ,940 4 Iconic ,872 2 Purchase Intention ,920 3
Table 7: Principal Component Analyses Items 1 2 3 4 5 6 7 8 9 10 11 12 Purchase Intention PI1 ,607 PI2 ,654 PI3 ,677 Brand Attitude BA1 ,792 BA2 ,558 BA3 ,534 BA4 ,714 BA5 ,680 Desirabi-lity Useful 1 ,711 Useful 2 ,640 Useful 3 ,734 Useful 4 ,559 Energ. 1 ,670 Energ 2 ,440 Energ 3 ,770 Energ 4 ,617 AesAp 1 ,826 AesAp 2 ,821 AesAp 3 ,763 AesAp 4 ,808 Positive Auto-nomy Orig1 ,660 Orig 2 ,658 Orig 3 ,706 Auth 1 ,648 Auth 2 ,657 Auth 3 ,671 Auth 4 ,558 Rebebel-ious Reb 1 ,644 Reb 2 ,660 Reb 3 ,775 Reb 4 ,784 High Status HighS 1 ,519 HighS 2 ,783 HighS3 ,636 HighS 4 ,760 Popular Popular 1 ,558 Popular 2 ,772 Popular 3 ,830 Popular 4 ,581 Subcultur al Subc 1 ,815 Subc 2 ,823 Subc 3 ,816 Subc 4 ,840 Iconic Iconic 1 ,581 Iconic 2 ,618 KMO =,833 Approx. Chi-Square = 3501,626 Df = 990 Sig. = ,000
4.5 Mean Analysis and normality test
For the descriptive statistics, four leading indicators are essential: standard deviation, mean, kurtosis, and skewness. Also, the Kolmogorov-Smirnov and Shapiro-Wilk will be analyzed to check the normality of the data. The normality of the data ensures that the population of the research follows a normal distribution, which has to be confirmed to use a parametric test. Table 8 implies an even distribution of the values for the variables with a negative Kurtosis, PI, and subcultural. On the other hand, variables like popular or desirability, which have a high positive value of Kurtosis, show that the values of their means are not widely distributed. Taking a look at Skewness, the positive values indicate a shift to the left of the mean values. Negative values for Skewness indicate a shift to the right of the means. The tendencies for each factor can be seen in Table 8. Since all sample sizes are larger than 50, the Kolmogorov-Smirnov test applies. All of the values except the one for “High Status“ had a p-value smaller than ,05. For high status, the value was .055 > .05, in other words, only high status was normally distributed due to that test. Nevertheless, according to the Central Limit Theorem, all variables can be considered normally distributed, due to the sample size being larger than 30 (Uttley, 2019).
Table 8: Measure of Construct and Descriptive Statistics
4.6 Pearson Correlation Test
The Table 9 shows that all p-values are <.05. Therefore, all variables have significant relationships with each other.
BA shows the highest correlation to desirability (.755) and the lowest correlation to iconic (.282). Of the BC variables, the strongest correlation is shown for desirability and positive autonomy (.722) and the lowest correlation between iconic and popular (.401). PI is strongly correlated to desirability (.718) and the least strongly correlated to iconic (.468).
N Mean Std. Deviation Skewness Kurtosis
p-value of Kolmogorov-Smirnova p-value of Shapiro-Wilk Brand_Attitude 310 4,5258 1,14921 -,299 ,113 ,000 ,010 Desirability 310 4,5962 1,02331 -,599 ,903 ,001 ,000 Positive_Autonomy 310 3,8438 1,09825 ,288 ,329 ,000 ,003 Rebellious 310 3,1758 1,27719 ,490 ,425 ,000 ,000 HighS 77 4,1721 1,24093 ,205 ,060 ,055 ,161 Popular 310 4,5452 1,04625 -,251 1,102 ,000 ,000 Subcultural 310 2,9540 1,42309 ,665 -,224 ,000 ,000 Iconic 310 2,6823 1,45031 ,826 ,109 ,000 ,000 Purchase_Intention 310 3,7237 1,66569 ,056 -1,006 ,000 ,000
Table 9: Pearson Correlation
4.7 Sample Validation
4.7.1 Independent Sample t-test: Age, Education Level, Current Occupation and sportswear purchase behavior
Since two groups were compared in this study (participants exposed to influencer’s posts and participants exposed to brand’s posts) in terms of BA, BC, and PI, it had to be ensured they were comparable. Therefore, not only the demographics of both groups but also their liking of the brand had to be compared.
Here, the comparison check for age, education level, current occupation, and sportswear purchase behavior is asserted. All demographic variables were of qualitative nature, thus Independent Sample t-tests was performed, and Levene’s Test for Equality of Variances was used to compare the groups in terms of homogeneity. Since the Levene’s test was insignificant, equality of variances of the sample can be assumed, and the t-test can be evaluated.
The means of the compared groups were almost equal for educational level, current occupation, and sportswear purchase behavior. Therefore, the similarity of compared groups was given and the hypotheses could be tested. All results are presented in the following Table 10.
Brand Attitude Desiability Positive Autonomy Rebellious High Status Popular Sub- cultural Iconic Purchase Intention Brand Attitude Pearson Correlation 1 ,755** ,605** ,372** ,543** ,546** ,392** ,282** ,655** Sig. (2-tailed) ,000 ,000 ,000 ,000 ,000 ,000 ,000 ,000 N 310 310 310 310 77 310 310 310 310 Desirability Pearson Correlation ,755** 1 ,722** ,502** ,644** ,694** ,510** ,416** ,718** Sig. (2-tailed) ,000 ,000 ,000 ,000 ,000 ,000 ,000 ,000 N 310 310 310 310 77 310 310 310 310 Positive Autonomy Pearson Correlation ,605** ,722** 1 ,688** ,665** ,573** ,685** ,525** ,670** Sig. (2-tailed) ,000 ,000 ,000 ,000 ,000 ,000 ,000 ,000 N 310 310 310 310 77 310 310 310 310 Rebellious Pearson Correlation ,372** ,502** ,688** 1 ,607** ,426** ,635** ,543** ,504** Sig. (2-tailed) ,000 ,000 ,000 ,000 ,000 ,000 ,000 ,000 N 310 310 310 310 77 310 310 310 310 High Status Pearson Correlation ,543** ,644** ,665** ,607** 1 ,454** ,508** ,557** ,603** Sig. (2-tailed) ,000 ,000 ,000 ,000 ,000 ,000 ,000 ,000 N 77 77 77 77 77 77 77 77 77 Popular Pearson Correlation ,546** ,694** ,573** ,426** ,454** 1 ,466** ,401** ,550** Sig. (2-tailed) ,000 ,000 ,000 ,000 ,000 ,000 ,000 ,000 N 310 310 310 310 77 310 310 310 310 Subcultural Pearson Correlation ,392** ,510** ,685** ,635** ,508** ,466** 1 ,599** ,571** Sig. (2-tailed) ,000 ,000 ,000 ,000 ,000 ,000 ,000 ,000 N 310 310 310 310 77 310 310 310 310 Iconic Pearson Correlation ,282** ,416** ,525** ,543** ,557** ,401** ,599** 1 ,468** Sig. (2-tailed) ,000 ,000 ,000 ,000 ,000 ,000 ,000 ,000 N 310 310 310 310 77 310 310 310 310 Purchase Intention Pearson Correlation ,655** ,718** ,670** ,504** ,603** ,550** ,571** ,468** 1 Sig. (2-tailed) ,000 ,000 ,000 ,000 ,000 ,000 ,000 ,000 N 310 310 310 310 77 310 310 310 310
Table 10: Independent Sample t-test – Demographic Variables influencer created post vs. brand created post (Age, Education Level, Current Occupation and Sportswear Purchase Behavior)
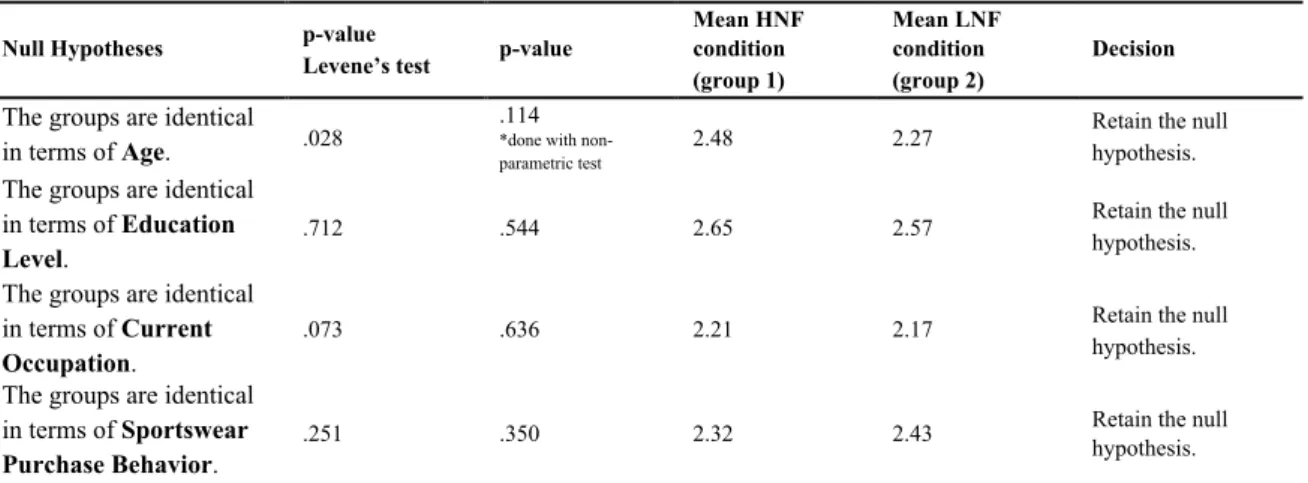
Further, the same comparison had to be made for the HNF condition vs. the LNF condition for the presented influencer to test hypotheses 6 and 7. Again, an independent t-test was run to test whether there were significant differences between the tested groups. The null hypotheses for age, education level, current occupation, and sportswear purchase behavior, had to be retained since all p-values were higher than .05. That means all demographic variables were the same for both samples of the HNF vs. LNF condition. The results and p-values are presented in the following table.
Table 11: Independent Sample t-test– Demographic Variables HNF vs. LNF condition (Age, Education Level, Current Occupation and Sportswear Purchase Behavior)
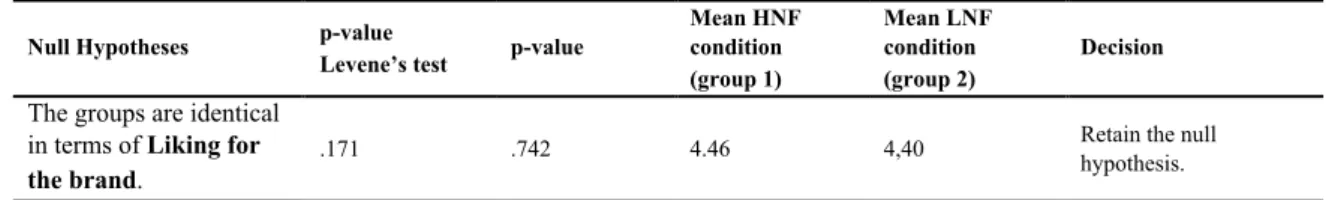
4.7.2 Independent Sample t-test: Consumer’s liking of the presented brand “Jiva Activewear”
Furthermore, it was checked if consumers liking for the brand was same among the groups. By running an independent sample t-test and applying Levene’s Test for Equality of Variances, no significant difference between both groups was found (p-value > .05). Therefore, the null
Null Hypotheses p-value
Levene’s test p-value t-test
Mean IM condition (group1 & 2) Mean brand condition (group 3) Decision
The groups are identical
in terms of Age. .968 .152 2.37 2.60 Retain the null hypothesis. The groups are identical
in terms of Education
Level.
.388 .751 2.58 2.61 Retain the null hypothesis. The groups are identical
in terms of Current
Occupation.
.983 .483 2.19 2.25 Retain the null hypothesis. The groups are identical
in terms of Sportswear
Purchase Behavior.
.541 .856 2.37 2.36 Retain the null
hypothesis.
Null Hypotheses p-value
Levene’s test p-value
Mean HNF condition (group 1) Mean LNF condition (group 2) Decision
The groups are identical in terms of Age. .028
.114
*done with non-parametric test
2.48 2.27 Retain the null hypothesis. The groups are identical
in terms of Education
Level.
.712 .544 2.65 2.57 Retain the null hypothesis. The groups are identical
in terms of Current
Occupation.
.073 .636 2.21 2.17 Retain the null
hypothesis. The groups are identical
in terms of Sportswear
Purchase Behavior.
.251 .350 2.32 2.43 Retain the null