Universidade de Lisboa
Faculdade de Farmácia
Optimization of HIV Residual Viremia
Quantification
Applications for HIV Cure Studies
Ana Raquel de Sousa Saraiva Mateus
Mestrado Integrado em Ciências Farmacêuticas
Universidade de Lisboa
Faculdade de Farmácia
Optimization of HIV Residual Viremia
Quantification
Applications for HIV Cure Studies
Ana Raquel de Sousa Saraiva Mateus
Monografia de Mestrado Integrado em Ciências Farmacêuticas apresentada à Universidade de Lisboa através da Faculdade de Farmácia
Orientadores: Dr. Gilles Darcis, Médico Infeciologista
Doutora Dolores Vaira
Co-Orientador: Doutor José Miguel Azevedo-Pereira, Professor
Auxiliar com Agregação
ABSTRACT
Human Immunodeficiency Virus type 1 (HIV-1) is one of the most serious health challenges worldwide and at the end of 2018 approximately 37.9 million people lived with HIV. In 1996 was developed a new therapeutic strategy for HIV infection that consist in the combination of different antiretroviral drugs and, with the development of effective cART, occurred a substantial reduction in deaths associated with the virus. This therapy rapidly decreases plasma viral load below the limit of detection and, at the same time, prevents viral replication. Although cART is highly effective it is not curative due to several mechanisms contribute to HIV persistence. HIV-1 can infect both activated and resting cells, which the viral genome can be permanently integrated into a host cell chromosome. Latent HIV-1 reservoirs are established early during primary infection and are a major barrier to eradication, even in the presence of highly active cART. Targeting this latent reservoir is one of the main focus of HIV-1 cure investigation, and the development of a rapid and accurate assay for the reservoir quantification is an essential step in the search for a cure. Thereby, correct quantification of residual viremia and of the viral reservoir size are crucial in HIV-1 eradication studies and is important to increase the sensibility of the methods used.
The most commonly used assays are standard PCR assays targeting conserved regions of HIV-1 genome and has been widely used to quantify plasma viremia in individuals on antiretroviral therapy, as the Roche COBAS AmpliPrep/ COBAS TaqMan HIV-1 test v2.0. Since this assay is used to quantify cell-associated HIV-1 nucleic acid in peripheral blood mononuclear cells from seropositive patients and assess the existing viral load, an optimized protocol for the sample’s preparation was developed to enhance the sensitivity of the technique. The results show that collecting a larger volume of blood from the patients, plasma ultracentrifugation and the treatment of the plasma samples with DNase I allowed achieve a more accurate result of HIV-1 residual viremia quantification. Thus, modification of commercial assays that quantify HIV residual viremia could contribute to the progress in HIV cure studies.
RESUMO
O Vírus da Imunodeficiência Humana tipo 1 é um dos maiores desafios relacionados com a saúde a nível global, sendo que, no final de 2018, aproximadamente 37,9 milhões de pessoas estavam infetadas pelo vírus.
Em 1996 foi desenvolvida uma nova estratégia terapêutica para a infeção com o HIV que consistia na combinação de diferentes classes de fármacos antirretrovíricos. Com o desenvolvimento desta terapêutica mais eficaz houve uma redução substancial das mortes associadas à infeção pelo HIV. Esta estratégia faz com que a carga viral sanguínea diminua rapidamente, abaixo do limite de deteção, e, ao mesmo tempo, impede que ocorra replicação viral. Apesar desta terapêutica antirretrovírica combinada ser altamente eficaz, esta não é curativa devido a diferentes mecanismos que contribuem para a persistência do HIV. Este vírus infeta tanto células ativadas com células em repouso, integrando permanentemente o seu genoma na célula hospedeira. Os reservatórios latentes do HIV-1 estabelecem-se no início da infeção primária e esta é uma das principais barreiras para a erradicação do vírus, mesmo na presença de uma terapêutica otimizada. Assim, um dos focos fundamentais dos estudos relacionados com a cura da infeção pelo HIV-1 são os reservatórios latentes do vírus, sendo o desenvolvimento de um método rápido e preciso para a quantificação dos mesmo um passo essencial para a descoberta de uma cura. Portanto, uma correta quantificação da carga viral e da dimensão dos reservatórios do vírus são cruciais nos estudos da área, sendo também importante aumentar a sensibilidade dos métodos usados.
O método mais utilizado para a quantificação da carga viral no plasma de indivíduos seropositivos sob terapia antirretrovírica é técnica de PCR que tem como alvo as regiões conservadas do genoma do HIV-1, sendo um exemplo deste método o teste COBAS AmpliPrep/ COBAS TaqMan HIV-1, versão 2.0. Este método quantifica ácidos nucleicos do vírus em células mononucleares do sangue periférico e avalia a carga viral e, neste estudo, foi desenvolvido um protocolo otimizado de preparação das amostras de plasma para aumentar a sensibilidade da técnica. Os resultados demonstraram que a recolha um maior volume de sangue dos doentes, a ultracentrifugação do plasma e o tratamento das amostras de plasma com DNase I permitiram obter resultados mais exatos e autênticos de carga viral. Deste modo, a modificação de métodos comerciais que quantificam a carga viral de HIV pode contribuir para o progresso nos estudos relacionados cura da infeção por HIV.
ACKNOWLEDGMENTS
Este é o culminar de 5 anos de trabalho, aprendizagem, algumas noites sem dormir e muitas épocas de exames. No entanto, nenhum deles foi passado sozinha e, por isso, dirijo agradecimentos sinceros a todos os que fizeram parte deste meu percurso:
Aos meus pais, por serem tão exigentes quanto motivadores. Pelo apoio incondicional, por tudo o que me ensinaram e vão continuar a ensinar e por acreditarem sempre nas minhas capacidades, mesmo quando eu não o faço.
Ao meu irmão Miguel, por me motivar cada dia a ser melhor. Pelo rigor que me incute e por me mostrar uma perspetiva diferente de ver o mundo.
Aos meus avós Ester, Gracinda, Fernando e Germano, que nunca chegaram a ver todo este meu percurso, mas que sei que estão orgulhosos.
À minha família, por toda a paciência e compreensão. Por todas as Páscoas e Natais passados a estudar e pelo apoio incondicional, mesmo a 400 km de distância.
Aos meus amigos, dos de longa data aos mais recentes, dos amigos de Évora aos amigos da Faculdade, que me tornaram o que sou hoje. Por tudo o que partilhámos e vivemos. Pela amizade verdadeira e por tudo o que ainda virá.
À DAEFFUL, por tudo o que me ensinou e fez crescer.
À Missão País, por me ter tirado da zona de conforto e ter permitido ver mais além. À Gilles, Dolores, Fabrice et à tous les membres du Laboratoire de Référence SIDA du Centre Hospitalier Universitaire de Liège, pour tous les enseignements transmis, à la fois en laboratoire et en français, et pour toute leur patience. Pour tous les moments, rires, chocolats et pour marquer mon expérience Erasmus.
Ao Professor José Miguel Azevedo-Pereira, por todo o apoio prestado ao longo do desenvolvimento deste trabalho. Pelo tempo dedicado e pelas dúvidas esclarecidas.
A todos os que não estão aqui, mas que, de alguma forma, deveriam estar.
ABBREVIATIONS
AIDS Acquired Immune Deficiency Syndrome
ART Antiretroviral Therapy
BSL-2+ Biosafety Level 2 Plus Laboratory
BSL-3 Biosafety Level 3 Laboratory
cART Combinational Antiretroviral Therapy
CCR5 Cysteine-Cysteine Chemokine Receptor Type 5
cDNA Complementary Deoxyribonucleic Acid
CD3 Cluster of Differentiation 3
CD4 Cluster of Differentiation 4
CD4 Cluster of Differentiation 8
CD28 Cluster of Differentiation 28
CNS Central Nervous System
CXCR4 C-X-C Chemokine Receptor type 4
DMSO Dimethyl Sulfoxide
DNA Deoxyribonucleic Acid
DTG Dolutegravir
EDTA Ethylenadiamine Tetraacetic Acid
ELISA Enzyme-linked Immunosorbent Assay
FBS Fetal Bovine Serum
GALT Gut-associated Lymphoid Tissue
HB Hepatitis B Virus
HCV Hepatitis C Virus
HIV Human Immunodeficiency Virus
HIV-1 Human Immunodeficiency Virus type 1
HIV-2 Human Immunodeficiency Virus type 2
ITI Integrase Inhibitors
IN Integrase
LTR Long Terminal Repeats
NFAT Nuclear Factor of Activated T-cells
NNRTI Non-Nucleoside Reverse Transcriptase Inhibitors
NRTI Nucleoside Reverse Transcriptase Inhibitors
NtRTI Nucleotide Reverse Transcriptase Inhibitors
PBMC Peripheral Blood Mononuclear Cells
PCR Polymerase Chain Reaction
PEP Postexposure Prophylaxis
PHA Phytohemagglutinin
PI Protease Inhibitors
PMTCT Prevention of Mother-to-Child Transmission
PR Protease
PrEP Pre-Exposure Prophylaxis
pTEFb Positive Transcription Elongation Factor b
qPCR Quantitative Polymerase Chain Reaction
QS Quantification Standard
QVOA Quantitative Viral Outgrowth Assay
RCR Replication Competent Retrovirus
RNA Ribonucleic Acid
RT Reverse Transcriptase
RT-PCR Reverse Transcription Polymerase Chain Reaction
SCA Simple Copy Assay
TDR Transmitted Drug Resistance
TABLE OF CONTENTS
1 INTRODUCTION ... 13
1.1 Human Immunodeficiency Virus (HIV) ... 13
1.1.1 The Virus ... 13
1.1.2 Structure ... 13
1.1.3 Replication Cycle / Infection of Human Cells ... 15
1.2 Antiretroviral Therapy ... 16
1.3 Latent Reservoirs ... 17
1.3.1 Establishment of Latent Reservoirs ... 19
1.3.2 Quantification of the Reservoirs ... 20
1.4 Persistent Viremia ... 24
1.4.1 Possible Sources of Viremia ... 26
2 GOALS ... 28
3 MATERIALS AND METHODS ... 29
3.1 Materials ... 29
3.1.1 Plasma ... 29
3.1.2 Negative Plasma ... 29
3.1.3 Peripheral Blood Mononuclear Cells (PBMCs) ... 29
3.1.4 Deoxyribonuclease I (DNase I), Amplification Grade (Invitrogen®) ... 30
3.2 Methods ... 30
3.2.1 Preparation of RNA Sample Prior to PCR assay with DNase I ... 30
3.2.2 Isolation and Cryopreservation of PBMCs ... 30
3.2.3 Ultracentrifugation of Plasma Samples ... 31
3.2.4 HIV-1 RNA PCR Assay: Roche COBAS AmpliPrep/COBAS Taqman HIV-1 test, version 2.0 ... 32
4 RESULTS ... 34
4.1 Analysis of the influence of Ultracentrifugation in Preparation of Plasma samples 34 4.2 Evaluation of the preparation of plasma samples prior to PCR with DNase I ... 35
5 DISCUSSION AND CONCLUSIONS ... 39
6 FUTURE PERSPECTIVES ... 42
LIST OF FIGURES
Figure 1 - Structure and organization of the HIV-1 genome ... 14 Figure 2 - HIV-1 Replication Cycle and cART ... 16 Figure 3 - Viral Outgrowth Assay. Resting CD4+ T cells are represented in green and activated
CD4+ T cells (in red) ... 20
Figure 4 - Schematic representation of the size of the latent reservoir, as assessed with different
assay methods ... 23
Figure 5 - Schematic representation of the importance of measuring the latent reservoir ... 23 Figure 6 - Decay dynamics of plasma HIV-1 RNA before, during and after cART treatment.
... 26
Figure 7- Schematic illustration of how to prepare the density gradient for isolation of PBMCs
LIST OF TABLES
Table 1- Interpretation of the obtained results by Roche COBAS AmpliPrep/COBAS Taqman
HIV-1 test, version 2.0. ... 33
Table 2 - Viral load, in HIV-1 RNA copies/ mL plasma sample from patients GIL14 and GIL19
... 34
Table 3 - Viral load, in HIV-1 RNA copies/ mL and log10 of the obtained value, in plasma
sample from patients GIL15, GIL16, GIL17 and GIL18 ... 36
Table 4 - Viral load, in HIV-1 RNA copies/ mL and log10 of the obtained value, in cells diluted
in Negative Plasma from infected patients AZT 63695, AZT 64042, AZT 64045, AZT 64069 and AZT 64081 ... 37
Table 5 - Viral load, in HIV-1 RNA copies/ mL and log10 of the obtained value, in seven
different dilutions in FBS (10x, 101x, 102x, 103 x, 104 x, 105 x and 106x) of 1x10⁶ cells..
1 INTRODUCTION
1.1 Human Immunodeficiency Virus (HIV)
1.1.1 The Virus
The Human Immunodeficiency Virus (HIV) belongs to the Retroviridae family and to the Lentivirus group (1), being a Ribonucleic Acid (RNA) virus. This virus was recognised as the causative agent of one of the most devastating infectious diseases to have appeared in recent history: the Acquired Immune Deficiency Syndrome (AIDS) (2).
In the beginning of the 1980s, in the United States of America, groups of people starter to show commons signs and symptoms of a novel immunodeficiency and it became evident that an infectious agent was involved. In 1983, Francoise Barre-Sinoussi and her colleagues at the Pasteur Institute in Paris prove the involvement of a retrovirus in the lymph node of a patient that show lymphadenopathy (1).
Based on genetic characteristics and viral antigens, exists two subtypes of the HIV: HIV-1 and HIV-2 (3). The main differences between the two types of this virus are the viral replication, the rate of evolution, the viral load and the co-receptor need in the host cell (4). The viral load of the HIV-2 is lower than the HIV-1, which leads to a lower transmission rate of this subtype (2).
The HIV-1 has four different lineages, that resulted from cross-species transmissions. The Group M represents the pandemic form of the virus and was the first being discovered. The Group O is restricted to Cameroon, Gabon and nearest countries. The Group N has only 13 cases documented, all from Cameroon. The Group P was discovered in 2009 in a Cameroonian women (2).
The three main ways of viral transmission are blood, sexual contact and maternal-fetal infection, and the highest viral load is found in the blood in two forms: as free virion (extracellular infective form of a virus) in the plasma or in infected peripheral blood cells (1).
1.1.2 Structure
1.1.2.1 Genome Structure
HIV-1 genome holds all the information needed to produce new virions after the infection and is formed by two identical single-stranded RNA molecules encapsulated in the
core of the virus particle. The HIV provirus genome is made by reverse transcription of the viral RNA into complementary Deoxyribonucleic Acid (cDNA), followed by degradation of the RNA and integration of the HIV Deoxyribonucleic Acid (DNA) into human genome (3). As showed in figure 1, flanking both ends of the DNA genome are the Long Terminal Repeat (LTR) sequences. The 5’LTR region codes for the promoter involved in the transcription of the viral genes (5). Following the reading frame in 5’ to 3’ direction there is the gag gene. This gene encodes the proteins of the external core membrane (p17), the capsid protein (p24) and the nucleocapsid (p7). Adjacent to gag gene is the pol reading frame that codes the protease enzyme (p12), the reverse transcriptase (RT), the RNase H (p15) or RT and RNase H together (p66) and integrase (p32). The pol gene is followed by the env reading frame, which the envelope glycoproteins gp 120 (surface protein) and gp41 (transmembrane protein) result. Besides this three structural genes, the HIV genome encodes for regulatory genes, such as tat (transactivator protein), rev (RNA splicing-regulator) and nef (negative regulating factor), important for the initiation of the HIV replication cycle, and accessory genes: vif (viral infectivity factor), vpr (virus protein r) and vpu (virus protein unique), playing an essential role on the replication, budding and pathogenesis of the virus (3).
Figure 1 - Structure and organization of the HIV-1 genome.Shown are the reading frames of the genes coding for viral proteins (structural, regulatory and accessory): LTR = long terminal repeat; gag = group-specific antigen; pol = polymerase; env = envelope. The regulator genes, the proteins of tat and rev have two gene regions. The 5´ and 3´ LTR nucleic acid sequences are not translated into protein. The genome of HIV-1 consists of 9,200– 9,600 nucleotides. Adapted from Khoury G, Darcis G, Lee MY, Bouchat S, Van Driessche B, Purcell DFJ, et al. The Molecular Biology of HIV latency. In: Advances in Experimental Medicine and Biology. 2018. p. 187–212.
1.1.2.2 Particle Structure
The HIV virus is rounded shaped, measuring approximately 100 nm in diameter. The particle has an external lipid membrane as envelope, formed of trimers of the env proteins (3). The gp120 surface protein trimers are attached to the membrane by the gp41 transmembrane protein trimers (6). The viral envelope has a lipid bilayer, which are part the glycoproteins
gp120 and gp41 in the mature virus particles, that covers the external capsid membrane. This capsid membrane is formed by matrix protein p17 and the inner capsid protein p24 (7). The two molecules of viral RNA, of approximately 9.7 kb, are encapsulated in the capsid (1) and the viral enzymes RT/ RNAse H are bound to the nucleic acid (3). The viral enzymes reverse transcriptase (RT), protease (PR) and integrase (IN) are also packaged into the core particle (1).
The maturation phase of the particle occurs by cleavage oh the gag and gag/pol precursor proteins (p55, p160) into individuals proteins at the final part of the budding phase and throughout release of virions from the cell (3).
1.1.3 Replication Cycle / Infection of Human Cells
The first phase of the infection of human cells by the HIV-1 virus is protein-protein interaction: in the mature HIV particle the surface gp120 recognize the Cluster of Differentiation 4 (CD4) receptor of the human host cell. Thus, all CD4+ cells (T helper cells,
monocytes, macrophages, dendritic cells and astrocytes) have susceptibility to this virus (3). After the attachment, the CD4 receptor and gp120 suffer a conformational change, establishing a new site for gp120 to allow binding to a co-receptor: chemokine receptor 5 (CCR5) or chemokine receptor type 4 (CXCR4) on the cell surface (8). This bindings produce another conformational change in gp120 and, consequently, in gp41(9). The N-terminus of gp41 is presented on the viral membrane, creates a channel and inserts into the plasma membrane of the target cell, completing the fusion of the viral envelope with the human cell membrane (3). This fusion promotes the translocation of the viral capsid into the cytoplasm, due to an absorption of the capsid by an endosome that leads to a change in the pH value in the phagosome (3). In the cytoplasm, the RT is activated, and a single-strand HIV RNA is transcribed into cDNA. At the same time, the other RNA strand is degraded by the RNase H and the single-stranded cDNA is converted into double-single-stranded DNA (proviral DNA) by an DNA polymerase (10). Then, the proviral DNA is imported into the cell nucleus (via nucleopores) in the form of a complex integrase – linear or circular proviral DNA. The integrase inserts the proviral genome into the host cell genome. This integration is the final step of the HIV infection. During the cell division, the proviral genome is replicated together with and as part of the human host cell genome (3), generating new viral proteins which will develop new virions. These virions, after the externalization, become mature and are ready to infect new cells (11).
For this reason, as all viruses, the HIV-1 virus depends on host cells to fully complete its replication cycle (12).
1.2 Antiretroviral Therapy
In the last years, significant progress has been accomplished in antiretroviral therapy, increasing the therapeutic strategies and making HIV infection a controllable condition rather than a fatal outcome.
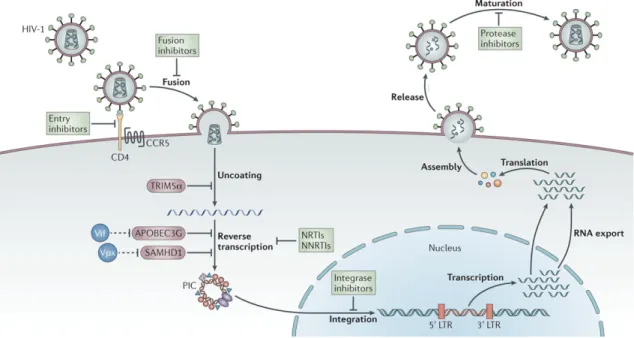
Drugs with different classes and mechanism of action are applied: Nucleoside Reverse Transcriptase Inhibitors (NRTI), Nucleotide Reverse Transcriptase Inhibitors (NtRTI), Non-Nucleoside Reverse Transcriptase Inhibitors (NNRTI), Reverse Transcriptase Inhibitors combined with Protease Inhibitors (PI or PRI), Fusion Inhibitors and Integrase Inhibitors (ITI) (13). These treatments aim different stages and targets in HIV replication cycle (see figure 2). The most frequently used therapeutic strategy consists in a combination of drugs from distinctive classes, being entitled as Combinational Antiretroviral Therapy (cART) (14), to improve the efficacy and durability of therapy (15).
Figure 2 - HIV-1 Replication Cycle and cART. Adapted from: Barré-Sinoussi F, Ross AL, Delfraissy J-F. Past, present and future: 30 years of HIV research. Nat Rev Microbiol. 2013 Oct 28;11:877–883
According to the World Health Organization (WHO), European and Portuguese Guidelines for antiretroviral treatment (16–18), a reference resistance test should be performed to determine transmitted drug resistance (TDR), which can influence the first-line antiretroviral response (19).
Antiretroviral drugs belonging to the no NNRTI and PI classes allows a fast reduction in plasma HIV-1 RNA levels (20), and the combination of three drugs rapidly reduced viremia to below the limit of detection of clinical assays (21). For this reason, for adults, the first-line Antiretroviral Therapy (ART) should consist in the combination of two NRTI with a NNRTI or an ITI, to achieve potent inhibition of viral replication (16–18).
The use of antiretroviral drugs could also be used for HIV prevention in specific cases as mother-to-child transmission (PMTCT), reduce the transmission of HIV, for example to serodiscordant sexual partners (pre-exposure prophylaxis (PrEP)), and to prevent the acquisition of HIV when a person is exposed to the virus (postexposure prophylaxis (PEP)) (16).
Currently, the cART is the most effective therapy against the HIV virus. However, patients on cART must not stop their therapy due to the presence of latently infected cells that could lead to viral rebound. Thereby, the cART is a long-term treatment and not a cure (14).
1.3 Latent Reservoirs
In the HIV-1 infection the major barrier to achieve the cure is a small group of latently infected resting CD4+ T cells that persist in the patients, even those who are on optimal cART
(22). In this state, the cells contain an integrated copy of the viral genome that is not expressed and, because of this, targeting the latent reservoir is one of the main focus of HIV-1 cure research (23).
The terms Latency and Reservoir are commonly used when the subject is “HIV-1 cure”.
Latency is a “reversibly nonproductive state of infection of individual cells where the viral
genome persists in some form within the cells, but viral gene expression is limited” (23). Particularly for the Herpesvirus family, latency is a really important mechanism for viral persistence and immune invasion (24). Recent studies suggest that HIV-1 latency could be a consequence of infection of CD4+ T cells in a small-time window after activation, when the
cells are present in all HIV-1 infected individuals and that these cells establish a reservoir that prevents cure with the antiretroviral therapy that are available (26). Thereby, this definition restricts the viral reservoirs to latently infected resting CD4+ T cells carrying stably integrated,
transcriptionally silent but replication-competent proviruses. In resting state, this family of cells does not produce virus particles but could be stimulated to give rise to infectious virus, leading to viral rebound after an interruption of ART (27).
A reservoir is a cell type or anatomical site where exist replication-competent forms of HIV-1 in patients on optimal cART regiments on a timescale of years (28). Currently, there are attention and several studies about other infected cell populations(29), including CD8+ T cells
and cells from the myeloid line, for example macrophages, that could represent stable reservoir for HIV-1(30).
Occasionally, these two terms are misused, considering that “latent reservoir” should be used only if the “relevant cell population is in a reversibly nonproductive state of infection” (23). Immune activation and viral reservoir are mechanisms that are dependent from each other: inflammatory environment and the activation of T cell can contribute to the preservation of HIV-1 reservoir by giving target cells for a new infection. At the same time, the perseverance of latently infected cells lead to immune activation (31) by the production of RNA and proteins and the capacity of these cells to reactivate the infection.
The term reactivation is used when latency has been reversed, allowing viral gene expression and virus production (23).
Compartment is defined as “a site that has a limited exchange of viral genetic information
with other sites of infection” (32). Therefore, “in vivo virologic compartments” are cell types or tissues where the virus flow is limited and “virologic reservoirs” are cell types or tissues where the replication is relatively restricted (33).
Exists specific anatomical compartments, called Sanctuary sites, that are poorly penetrated by antiretroviral drugs, allowing persistent viral replication (34). Gut-associated Lymphoid Tissue (GALT) is the largest lymphoid organ and is mainly constituted by lymphocytes and throughout untreated HIV-1 infection, most of viral replication takes place here (32). Based on higher amount of cells carrying HIV-1 DNA, comparing to plasma in patient under cART, GALT has been suggested as an anatomical compartment for HIV-1 during cART (12). There is also strong evidence for HIV-1 compartmentalization of the Central Nervous System (CNS) and that this works as a sanctuary site (35).
The frequency of latently infected cells is extremely small in patients under cART and only a small portion is replicant competent (28). The resting CD4+ T cells are the main cellular
reservoir and latency can be established pre or post-integration (31).
1.3.1 Establishment of Latent Reservoirs
The establishment of latent reservoirs HIV-1 seems to be a repercussion of the tropism of the virus for activated CD4+ T cells (30). The LTR region of the viral genome has attachment
sites for host transcription factors, for example nuclear factor k light chain-enhancer of activated B cells (NF-kB) or nuclear factor of activated T cells, both presents in nuclei of resting CD4+ T cells, that are sequestered in the cytoplasm. Additionally, the elongation phase of
HIV-1 is highly dependent on positive transcription elongation factor, that can also be sequestered in resting CD4+ T cells, in an inactive form (36). Furthermore, these resting cells have low
expression of CCR5 (HIV-1 co-receptor). For these reasons, HIV-1 replicates well in activated CD4+ T cells but inadequately in resting CD4+ T cells. Nevertheless, an activated CD4+ T cells
can be infected during the transition back to resting state, which is nonpermissive for viral replication, resulting in a “stably integrated but transcriptionally silent provirus in a long-lived memory T cell”. If, at any point, these provirus are stimulated by antigens or cytokines, a viral replication could start (30).
This theory, exposed for the first time in 1995, elucidates different aspects of HIV-1 persistence (37), having been demonstrated that resting CD4+ T cells contained integrated
HIV-1 DNA in all infected patients included in the investigation and that purified resting CD4+ T
cells from the same subjects did not produce virus in a spontaneous way but could be induced to do so through cellular activation (37,38).
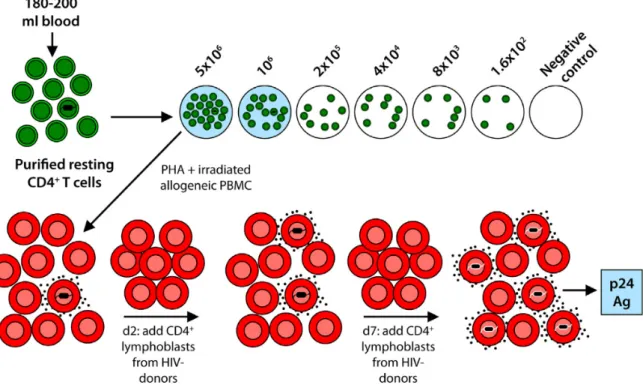
To demonstrate the presence of latently infected cell is used a Viral Outgrowth Assay (figure 3). In this assay, the resting CD4+ T cells are isolated from infected patients on cART,
diluted and activated with mitogen Phytohemagglutinin (PHA) and irradiated Peripheral Blood Mononuclear Cells (PBMC), causing a transformation of the CD4+ T cells to an activated state,
which are permissive for viral gene expression. After that, viruses are expanded by coculture with additions of CD4+ T lymphoblasts from healthy donors. Two weeks after, is possible to
expand the latently infected cells to the point that is possible to detect viral p24 antigen, using Enzyme-linked Immunosorbent Assay (ELISA), in the supernatant (30). This assay can be
converted into a Quantitative Viral Outgrowth Assay (QVOA), that will be explained in the next point (see Quantification of Reservoirs).
Figure 3 - Viral Outgrowth Assay. Resting CD4+ T cells are represented in green and activated CD4+ T cells (in red). From:
Siliciano JD, Siliciano RF. Recent developments in the search for a cure for HIV-1 infection: Targeting the latent reservoir for HIV-1. J Allergy Clin Immunol. 2014;134(1):12–19.
In the last years, new versions of the QVOA have been described. In some of them the activation of resting CD4+ T cells is accomplished with anti-CD3/anti-CD28 antibodies
instead of Phytohemagglutinin (PHA) and irradiated allogeneic PBMCs. These assay also can be simplified using a transformed CD4+ T cells expressing CCR5 or, instead of realizing the
final ELISA assay it is possible to use more sensitives assays, including Reverse Transcription Polymerase Chain Reaction (RT-PCR) for HIV-1 RNA in cells or in the supernatant virus, novel ultrasensitive assays for p24 protein or transfer of infection to a reporter cell line.
1.3.2 Quantification of the Reservoirs
Being the resting CD4+ T cells considered the main reservoir for the virus during cART,
the majority of the procedures for the quantification of the reservoirs are directed to this type of cells (39). Although these cells are found in the plasma and lymphatic tissues, exists a cross-infection between these two sites (40). Normally, studies are performed on cells found in blood.
As already explain, the QVOA takes into account the correlation between viral gene expression and the state of cell activation (23). Is important to point out that without activation, the CD4+ cells (the choice of input cell population) do not produce virus (37), so it is possible
to affirm that any virus isolated from these cells, following activation, come from a latently infect cell. In this sense, the QVOA can be used to quantify latent reservoirs performing an ELISA assay and determining the frequency of latently infected cells with Poisson statistics. Other important point is that this assay gives meaningful results only in patients who have had suppression of detectable viral replication for at least six months (23). Instead of realizing the final ELISA assay it is possible to use more sensitives assays, including RT-PCR for HIV-1 RNA in cells or in the supernatant virus, novel ultrasensitive assays for p24 protein or transfer of infection to a reporter cell line. However, these assays could potentially detected virus released from defective proviruses and some are capable of giving rise to viral RNA and protein. Although the standard QVOA detects the latent proviruses that are capable of causing viral rebound, some problems with the assay persist. It requires large blood samples (100-200 mL), the assay is labor-intensive (tissue culture work in Biosafety Level 3 (BSL-3) laboratory), and the turnaround time is slow (1-3 weeks to detect outgrowth) (23).
Due to the difficulties with the QVOA already elucidated, investigators use simple Polymerase Chain Reaction (PCR) assays to detect proviral DNA in latently infected cells. The frequency of infected cells detected by PCR is better than the frequency measure by QVOA (22). PCR assays amplify short conserved regions of the provirus and the Alu-PCR assays amplify the regions between an Alu element and the integrated provirus and, providing discrimination between integrated and unintegrated provirus. However, the subgenomic PCR assays do not precisely distinguish between intact and defective provirus since they will not amplify proviruses with deletions that overlap the primer binding sites, but do amplify proviruses with defects outside of the region amplified (23). Studies carried by Ho et al. and Bruner et al. concluded that in patients who start cART during chronic infection, 98% of provirus have major defects, preventing replication. Many of these proviruses would be detected by standard PCR assays or Alu-PCR assays that detect integrated HIV-1 DNA. These defects are quickly accumulated and are readily, even in patients who start cART in the beginning of the infection (41). Therefore, standard PCR assay overestimates latent reservoir size in all patients (23).
There are an increasing number of PCR-based assays capable of detecting lower concentrations of HIV RNA and HIV DNA. This technique have the advantages of using small volumes of fresh and frozen samples (including blood and tissues), is fast and simple (42).
Analyzing with full genome sequencing could be really useful to understand the distribution of latent HIV-1 in different T cells (12). So, there are a large number of intact proviruses that are not induced to produce replication-competent virus in the standard QVOA (23).
Recent studies have used hybridization-based assays for viral DNA and RNA, allowing the visualization of infected cells in tissues (43). These assays can be useful to understanding the anatomical distribution of infected cells.
Another approach to measure the reservoirs is the in vitro treatment of the latently infected cells with a latency reversing agent (44) and the induction of the viral gene expression is then measured. This is called “Induction Assays” because the dependence of the stimulus that will induce the latent proviruses. The QVOA belongs to this group of assays but the majority of inductions assays measure viral RNA in cells or in culture supernatants rather than release of infectious virus. Therefore, they are easier and quicker than the QVOA. If the cells are stimulated and cultured before plating a limiting dilution then cell proliferation, viral spread and other complications may impede the precise measurement of infected cell frequency. These assays suffer from two major disadvantages. First, they can detect viral gene expression from defective proviruses (that can be transcribed, and some can even give rise to viral proteins). Defective proviruses with small deletions in the packaging signal can give rise to virus-like particles. Thus, these assays may detect defective as well intact proviruses. Second, recent studies show that many agents that work well in this model systems fail to induce latent proviruses from patient cells (23).
Figure 4 - Schematic representation of the size of the latent reservoir, as assessed with different assay methods. The Viral Outgrowth assay (yellow) can estimate the minimal reservoir size, while PCR assays for proviral DNA (blue) drastically overestimate the dimension of the reservoir, since can detect defective and replication-competent provirus. A fraction of intact provirus (pink) are integrated into genomic regions that manage to prevent induction. The remaining intact provirus can be induced after activation (red) and represent the true size of the reservoir. From: Siliciano JD, Siliciano RF. Recent developments in the search for a cure for HIV-1 infection: Targeting the latent reservoir for HIV-1. J Allergy Clin Immunol. 2014;134(1):12–9
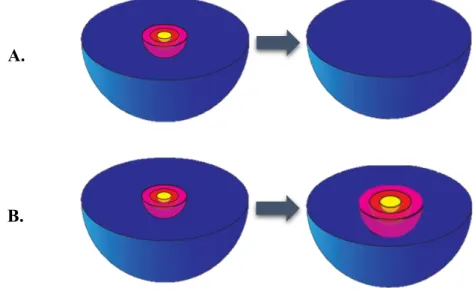
The importance of measuring the latent reservoir is the ability to distinguish a patient that is “cured” (Figure 5. A), that have just defective proviruses, from a patient that have increased replication-compartment of latent reservoir (Figure 5. B), consequently rising the frequency of the replication-competent proviruses. Since the most commonly used assay is PCR assays for proviral DNA and this method can detect defective and replication-competent provirus, is difficult to differentiate the two situations already exposed, since the value obtain from the assay for residual viremia is the same. So, the capacity to measure the “true” reservoir size have been a topic of different studies nowadays.
Figure 5 - Schematic representation of the importance of measuring the latent reservoir. The figure A is a representation of a “cured” patient, with just defective provirus (blue) and in the figure B exist an increasing of the quantity of intact non-induced proviruses (pink), intact non-non-induced proviruses but inducible after a stimulus (red) and non-induced proviruses (yellow). Adapted from: Siliciano JD, Siliciano RF. Recent developments in the search for a cure for HIV-1 infection: Targeting the latent reservoir for HIV-1. J Allergy Clin Immunol. 2014;134(1):12–9
A.
1.4 Persistent Viremia
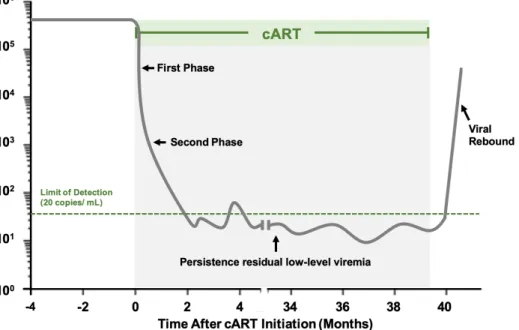
When the antiretroviral therapy is started, plasma viral load decline while cART prevents (almost) all infection of new target cells (32). Because the short half-life of the free plasma virus, viral decay in plasma throughout treatment is primally affected by the life period of previously infected cells (12). There are different phases of viral decay during cART (figure 6). The first phase match predominantly the infection of activated CD4+ T cells, occurring a rapid
exponential decay with a half-life of 1-2 days (45). This phase is followed by a gradual decay with a half-live of approximately 2-3 weeks and, based on this half-life, macrophages has been proposed to be the type of cells corresponding to this phase (12). During this second phase, the majority of the patients achieve viral suppression (<50 HIV-1 RNA copies/ mL) (32). Nevertheless, using more sensitive methods of quantification was possible to identified a third phase of decay with a half-life of 39 – 63 weeks (9 to 15 months) followed by a fourth phase that is extremely stable, around 1 to 3 HIV-1 RNA copies/ mL in most patients on cART (46). This level of viremia during cART has been called Residual Viremia (12). The half-life of the cells that match with the third phase of decay correspond to the characteristics of resting CD4+
T cells. These cells may also be found in the fourth phase, due to the possible rate of division corresponds to their death rate (32). If we correlate the residual viral set-point with pre-therapy plasma viral levels and with the levels of pre-treatment total HIV-1 DNA (47) is possible to realize that the infection is established in long-lived cells early in the infection, which is also set by the non-evolutionary nature of viruses captured from resting CD4+ T cells in patients under cART (12,48).
According to Portugal Guidelines, virologic failure is defined as the inability to achieved or maintain suppression of viral replication, in patients under cART during 6 or more months, to a viral load < 50 copies/mL, measured two times consecutives, separated at least for 15 days (18). Thereby, an important monitorization for develop HIV-1 eradication strategies is the measuring of residual viremia. In some patients, could be clinical important to monitor viremia even if < 50 HIV-1 RNA copies/ mL (49) and, in recent years, the Simple Copy Assay (SCA) has been widely used since is a quantitative technique that is able to detect less than 1 copy of HIV-1 RNA/ mL (50). However, this a technique that involves major laboratory work. So, for quantifying HIV-1 viremia in a systematized and reliable way, commercial quantitative PCR (qPCR) kits are used. These kits have the disadvantage that the limit of detection is between 20 and 50 copies/ mL, depending on the assay (23). Increasing the sample volume and ultracentrifugation of the sample could be strategies to reduce stochastic influences (51).
Nowadays the two commercial assays that are mainly used to monitor and control plasma viral load in patients with HIV-1 infection, under cART, are the Abbott RealTime assay and the COBAS Taqman HIV-1 test version 2.0. These assays are based on RT-PCR but the COBAS Taqman HIV-1 test, version 2.0, appears to have higher detectability rates than Abbott RealTime assay and have a lower limit of detection (20 copies/ mL compared to 40 copies/mL) (52).
Since the residual viremia represent virus release from stable viral reservoir is normal to ask if the measurement of residual viremia could, or not, provide an alternative approach to reservoir measurement. Probably the level of residual viremia is related to reservoir size, but the nature of this relationship is not clear because:
- The level of residual viremia is very low and is normally below the level of detection of sensitive assays. Thus, for some patients is necessary collect large volumes of plasma (23).
- The residual viremia is usually dominated by a clonal population of viruses and latently infected cells. This reflect the fact that CD4+ T cells can proliferate after infection and copying
unmodified forms of the viral genome into progeny cells (53).
Another important event is the viral rebound after the interruption of cART (figure 6). Normally, viral rebound is detected two weeks after interruption of the therapy (54). The relationship between the size of the latent reservoir and time until the rebound had been described in a mathematical model (30). Because of this correlation, time to viral rebound is used as an outcome measure in some clinical studies (23). Nevertheless, there are some problems with this approach: there are risks to the patient, including drug resistance (23), and the variations between patients, introducing a variability in rebound time for a given degree of reservoir reduction (26).
Figure 6 - Decay dynamics of plasma HIV-1 RNA before, during and after cART treatment. The green line represents the limit of detection of the PCR assay. When the cART is started occurs a rapid exponential decay until a persistence residual low-level viremia. If the cART is interrupted is possible to observe an increase of viremia (viral rebound).
1.4.1 Possible Sources of Viremia
In patients not treated with cART, viremia is mostly caused by repeated cycles of infection-replication in activated CD4+ T cells. This is sustained by classical studies in viral replication
kinetics that show a decay in viremia in two phases, after initiating cART (55). In the first phase occurs viral producing by activated CD4+T cells that have short half-lives (approximately 24
hours), that are responsible for 90% of plasma viral load. The second phase is related with the viral replication from reservoirs with a half-life of a few weeks, which produce HIV-1 at minor rates (56).
Currently different mechanisms are proposed to be possibly responsible for the residual viremia detected during cART: ongoing cycles of HIV replication in specific anatomical compartments with infection of new host cells and proliferation of infected long-lived cells that might produce virus, in reaction to cell activation (31).
At the first time that residual viremia was confirmed, in 1999, it was presumed that ongoing cycles of replication were possible, despite the presence of cART (57). However, based on the nature of the HIV-1, this theory infers some assumptions. The first assumption is the possibility of viral evolution and the appearance of resistant viral strains during residual viremia (15). Another assumption is the possibility of the intensification of cART affects residual viremia (12), being this an area widely study nowadays. Thus, ongoing HIV replication during cART
is still controversial in the scientific community and is sustained by the detection of free virions in plasma, mainly due to their short half-life, although their presence could not be an outcome of active viral replication (31). On the other hand, different studies question the role of active viral production in HIV persistence (46). Nevertheless, has been demonstrated that in sites where exists a suboptimal drug penetration or weak control by the host immune system (lymphoid tissue, gastrointestinal tract, CNS and genital tract) occurs low-level viral replication (28). Particularly in the lymph nodes was already documented residual replication due to high frequency of infection per cells and to a drug concentration lower than in the blood (12).
The existing data concerning the source of residual viremia is, generally, coherent with the release of archival viruses from stable reservoirs. Despite the existence of these reservoirs, transcriptionally silent but replication-competent proviruses can be isolated from resting CD4+
T cells in all patients on cART, regardless of the duration of treatment (49). This establishes the reservoirs of the virus as one of the most important barrier to HIV-1 eradication (58).
Thereby, the source of persistent residual viremia is controversial and have been proposed different theories to explain. Ongoing replication is proposed to occur due to a non-fully suppressive cART (59) caused by the intrinsic ability of the virus to exhibit genetic diversity that reduce the susceptibility to some antiretroviral drugs (60) and, in the other way, is suggested the reactivation of viral expression from latently-infected cellular reservoirs harboring stably integrated, transcriptionally silent but replication-competent proviruses, a theory well accepted.
2 GOALS
This thesis is integrated in Gilles Darci’s work entitled “Effect of Dolutegravir intensification on blood and tissue latent HIV-1 reservoirs and on residual viremia despite ART” and developed in the AIDS Reference Laboratory of the University Health Center (Laboratoire de Référence Sida du Centre Hospitalier Universitaire) in Liège, Belgium.
This study has three main goals:
- Develop an optimized highly sensitive assay to measure the Replication Competent Retrovirus (RCR) and to quantify RCR in tissues;
- Create a blood/PBMCs bank with samples from new patients (see the evolution of RCR under therapy) to better define the contribution of ongoing replication to residual viremia and immune activation;
- Evaluate the impact of dual therapy/monotherapy at the level of residual viremia, replication competent retrovirus and immune activation in blood in tissues.
Twenty patients under Triumeq (Abacavir + Dolutegravir + Lamivudine) were randomized into two different groups, being a triple blind study: 10 patients in the control group, that maintain the therapy already doing, and 10 patients that will receive an additional 50 mg of Dolutegravir. The impact of this strategy will be measured on residual viremia (by ultrasensitive RT-PCR), immune activation (by Fluorescence activated cell sorting from PBMCs) and replication competent retrovirus in blood and in tissues (by gut biopsies in day 0 and day 84).
Due to the importance of measuring the residual viremia of the HIV-1, the general aim of this work is to optimize a PCR assay, specifically the Roche COBAS AmpliPrep/ COBAS TaqMan HIV-1 v2.0 protocol, decreasing the limit of detection and enhancing the sensitivity. For this purpose, the protocol commonly used for this technique will be optimized in order to measure only viral RNA of the virus and reduce possible interferences.
3 MATERIALS AND METHODS
3.1 Materials
3.1.1 Plasma
The plasma samples were collected from patients at the National AIDS Reference Laboratory, Centre Hospitalier Universitaire (CHU) de Liège, and provided written informed consent for the “Effect of Dolutegravir intensification on blood and tissue latent HIV-1 reservoirs and on residual viremia despite ART” study. All patients were HIV-1 seropositive individuals on stable suppressive cART and underwent phlebotomy (12 tubes of 10 mL). In a Biosafety Level 2 Plus (BSL-2+) laboratory, the plasma was separated by centrifugation of whole blood at 1200 X g for 10 min, followed by removal of the plasma layer. Three aliquots of 1,5 mL of plasma were stored at -80ºC and one Falcon of 50 mL was stored at 2ºC. The plasma stored on the Falcon was ultracentrifuged at 20 000 rpm for 50 min (4 ºC) in a BSL-3 laboratory.
3.1.2 Negative Plasma
Negative plasma is a Defibrinated Delipidated Human Plasma, that was stored at 4 ºC. The plasma was acquired from SEQENS IVD manufactures and is obtained from human plasma, successively defibrinated, dialyzed, delipidated and then charcoal stripped to remove specific elements (vitamin D, steroids, hormones, T3/T4, TSH). Is tested and found negative for:
- anti-HIV 1+2 & anti- Hepatitis C Virus (HCV) antibodies; - Hepatitis B (HB) antigen;
- HIV 1 & HCV RNA; - Syphilitic serology.
3.1.3 Peripheral Blood Mononuclear Cells (PBMCs)
The PBMCs were collected from samples of HIV-1 seropositive individuals on stable suppressive cART, obtained by leukapheresis by Ficoll-Paque Plus density gradient centrifugation in a BSL-2+ laboratory. The PBMCs were cryopreserved in frozen mixture of
3.1.4 Deoxyribonuclease I (DNase I), Amplification Grade
(Invitrogen®)
The Amplification Grade from Invitrogen® is suitable for DNA during RNA purification, such as those prior to RNA-PCR amplification. DNase I, Amplification Grade is purified from bovine pancreas and has a specific activity of ³10000 U/ mg. The kit is composed by the DNase I, 10X DNase I Reaction Buffer and EDTA (pH 8,0).
3.2 Methods
3.2.1 Preparation of RNA Sample Prior to PCR assay with
DNase I
Due to the volume of plasma needed for the COBAS AmpliPrep/COBAS Taqman HIV-1 test was larger than the volume of sample described in the Amplification Grade protocol, was necessary to scale up linearly the volume used of all the reagents. Therefore, for 1,2 mL of plasma sample was added 120 µL of 10X DNase I Reaction Buffer and 1,2 µL of DNase I (1 U/ µL). The mixture was incubated for 15 minutes at room temperature. For the inactivation of the DNase I was added 120 µL of 25 mM Ethylenadiamine Tetraacetic Acid (EDTA) to the reaction mixture and heated 10 min at 65ºC.
3.2.2 Isolation and Cryopreservation of PBMCs
For the isolation of PBMCs by density gradient from whole human blood (figure 7), the blood samples from seropositive patients were collected (12 x 10 mL EDTA tubes from each patient) and centrifuged at 1200 X g for 10 min. The plasma was removed and stored at -80°C (2 aliquots of 1,5 mL) and at 2°C (1 Falcon of 50 mL). With RPMI, the blood was well homogenized. Gently, the blood was transferred for a Falcon that contained 12,5 mL of Ficoll and centrifuged for 20 minutes (acceleration 6, brake 0). The PBMCs layer was removed, diluted in RPMI (first wash) and centrifuged for 7 minutes (acceleration 9, brake 9). The supernatant was removed, and the process repeated 2 more times, completing 3 washes. The pellet of PBMCs was resuspended, and the cells were counted. FBS was added to the re-suspend pellet to obtain 10 x 106 cells/ 500 µL.
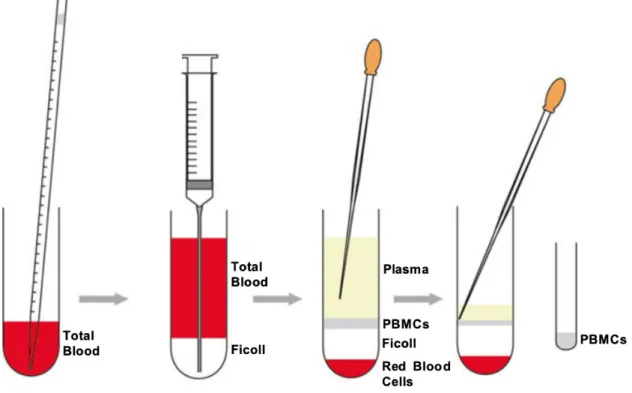
Figure 7- Schematic illustration of how to prepare the density gradient for isolation of PBMCs from blood and where
in the gradient the PBMCs are found after centrifugation. The total blood is represented by the red layer, the yellow layer
symbolizes the plasma, the Ficoll is the white layer and the PBMCs are represented by the green layer. Adapted from: Kleiveland CR (2015) Peripheral blood mononuclear cells. The impact of food bioactives on health. Springer Int Publishing, New York City, pp 161–167
For the cryopreservation was added 500 µL of freeze mixture (10% DMSO in FBS) into 500 µL of the cell suspension in cryotubes. For 24h, the cryotubes were storage in the Mr Frosty at -80 °C and then removed from the Mr Frosty and storage again at -80 °C.
3.2.3 Ultracentrifugation of Plasma Samples
The Ultracentrifugation was performed in a BSL-3 Laboratory in 50 mL of plasma samples. First was performed a centrifugation at 4°C, 500 x g, for 7 minutes. The total volume of plasma was divided between 2 ultracentrifugation tubes and added FBS to equilibrate the tubes in the support. This was followed by ultracentrifugation at 4°C, 20 000 rpm, for 50 minutes. The supernatant was removed and saved, and the cells were resuspended with 1 mL of FBS. To ensure that all the cells and impurities were eliminate from the plasma samples, one
more centrifugation was performed at 4°C, 500 x g, for 7 minutes. The ultracentrifuged plasma sample was stored in a 1,5 mL aliquot at -80 °C.
3.2.4 HIV-1
RNA
PCR
Assay:
Roche
COBAS
AmpliPrep/COBAS Taqman HIV-1 test, version 2.0
The Roche COBAS AmpliPrep/COBAS Taqman HIV-1 test, version 2.0 is use for quantitative detection of HIV-1 RNA in EDTA anti-coagulated plasma. Speciment preparation (isolation of HIV-1 RNA with a generic silica-based capture technique) is programmed in the COBAS AmpliPrep Instrument and the amplification and detection are automated in the COBAS TaqMan Analyzer. This method employs a dual target approach, using primers and probes specifics to LTR and gag genes. For the HIV-1 RNA quantification, this method uses a non-infectious armored RNA construct (quantification standard or QS) that contains HIV sequences with identical primers binding sites as the HIV-1 target RNA and a unique probe binding region that allows HIV-1 QS amplicon to be distinguished from HIV-1 target amplicon.
The HIV-1 QS is added to all the samples at a known copy number and is carried through the specimen preparation, reverse transcription (generating complementary DNA), PCR amplification (with thermostable recombinant enzyme thermus specie DNA polymerase) and detection (by monitoring the emission intensity of fluorescent reporter dyes released during the amplification) phases of cleaved dual-labeled oligonucleotide probes. The COBAS TaqMan Analyzer calculates the HIV-1 RNA concentration in the samples that are tested by comparing the HIV-1 signal to the HIV-1 QS signal for each specimen and control.
For this method is necessary 1,2 mL of plasma sample and is used a HIV-1 High Positive Control, a HIV-1 Low Positive Control, a Cobas TaqMan Negative Control (Human Plasma) and a Belgium Intern Control of 1000 copies/ mL.
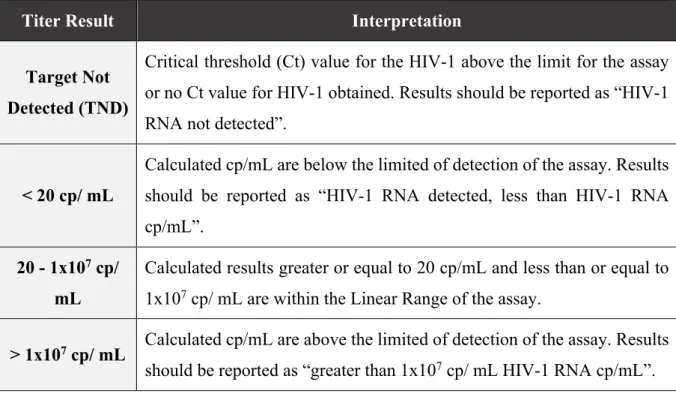
The results are shown in copies of HIV-1 RNA/ mL of plasma and the linear range is 20 – 1x10⁷ copies/ mL. The possible results, and the corresponding interpretation, are described
in the follow table. If the log10 of the results is above 0,50 it is considered a significant different
Table 1- Interpretation of the obtained results by Roche COBAS AmpliPrep/COBAS Taqman HIV-1 test, version 2.0.
Titer Result Interpretation
Target Not Detected (TND)
Critical threshold (Ct) value for the HIV-1 above the limit for the assay or no Ct value for HIV-1 obtained. Results should be reported as “HIV-1 RNA not detected”.
< 20 cp/ mL
Calculated cp/mL are below the limited of detection of the assay. Results should be reported as “HIV-1 RNA detected, less than HIV-1 RNA cp/mL”.
20 - 1x10⁷ cp/
mL
Calculated results greater or equal to 20 cp/mL and less than or equal to 1x10⁷ cp/ mL are within the Linear Range of the assay.
> 1x10⁷ cp/ mL Calculated cp/mL are above the limited of detection of the assay. Results
4 RESULTS
4.1 Analysis of the influence of Ultracentrifugation in Preparation of
Plasma samples
In the commonly used protocol for the preparation of the plasma samples prior to PCR assay, 1,2 mL of plasma is separate by a centrifugation of whole blood at 1200 X g for 10 min, followed by removal of the plasma layer. However, in studies that requires a measurement of residual viremia is necessary to increase the sensitivity of the methods used.
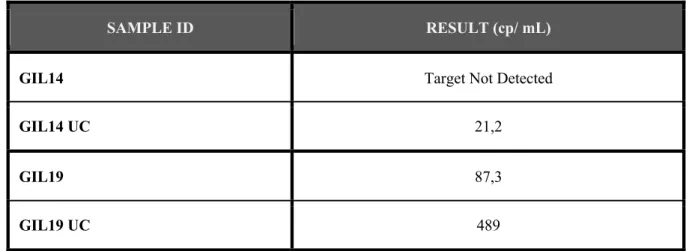
With the intention to understand if ultracentrifugation would contribute to the optimization of HIV-1 RNA quantification, the PCR assay was performed using samples collected from two seropositive patients (GIL14 and GIL19) that were on cART. Was collected a larger volume of blood from both patients and 1,2 mL of the plasma was centrifuged and 50 mL of plasma was ultracentrifuged.
The objective of performing the ultracentrifugation was to pellet virions and concentrate the virus.
Table 2 - Viral load, in HIV-1 RNA copies/ mL plasma sample from patients GIL14 and GIL19. The samples that were ultracentrifuged are identified with UC (GIL14 UC and GIL19 UC).
In both patients samples the viral load detected in the centrifuged samples (GIL14 and GIL19) was not detected or was lower than the viral load detected in the ultracentrifuged samples (GIL14 UC and GIL19 UC). Nevertheless, was not possible to assurance that the assay was just measuring the HIV-1 RNA or if exist some HIV-1 DNA present in the plasma samples that are influencing the results.
SAMPLE ID RESULT (cp/ mL)
GIL14 Target Not Detected
GIL14 UC 21,2
GIL19 87,3
4.2 Evaluation of the preparation of plasma samples prior to PCR with
DNase I
Considering that the plasma samples are collect from tubes with whole blood that were centrifuged or ultracentrifuged, is not possible to assurance that in the PCR assay only occur the measurement of HIV-1 RNA because could exist HIV-1 DNA in the sample that may change the obtained result.
DNase I is an endonuclease that nonspecifically degrades double-stranded and single-stranded DNA. In order to guarantee that in plasma samples did not exist DNA (from cells or virions) the Amplification Grade protocol was performed, with linear adjustments in the volume of reagents, in samples from 4 different seropositive patients on cART (GIL15, GIL16, GIL17 and GIL18), in samples centrifuged and ultracentrifuged. Thereby, from the same patient, was compared the viral load in centrifuged plasma sample, centrifuged plasma sample treated with DNase I, ultracentrifuged plasma sample and ultracentrifuged plasma sample treated with DNase I to evaluate the importance to prepare the RNA samples prior to PCR with this enzyme.
Table 3 - Viral load, in HIV-1 RNA copies/ mL and log10 of the obtained value, in plasma sample from patients GIL15, GIL16, GIL17 and GIL18. The samples that were ultracentrifuged are identified with UC (GIL15 UC, GIL16 UC, GIL17
UC and GIL18 UC) and the plasma samples treated with DNase I before the PCR assay are identified with DNase I, having been centrifuged (GIL15 DNase I, GIL16 DNase I, GIL17 DNase I and GIL18 DNase I) or ultracentrifuged (GIL15 UC DNase I, GIL16 UC DNase I, GIL17 UC DNase I and GIL18 UC DNase I).
SAMPLE ID RESULT (cp/ mL) RESULT (log10)
GIL15 1110 3,05
GIL15 DNase I Target Not Detected Target Not Detected
GIL15 UC 270 2,43
GIL15 UC DNase I 215 2,33
GIL16 Target Not Detected Target Not Detected
GIL16 DNase I Target Not Detected Target Not Detected
GIL16 UC 259 2,41
GIL16 UC DNase I 34,4 1,54
GIL17 < 20 < 1,30
GIL17 DNase I Target Not Detected Target Not Detected
GIL17 UC 32,4 1,51 GIL17 UC DNase I 228 2,36 GIL18 < 20 < 1,30 GIL18 DNase I < 20 < 1,30 GIL18 UC 108 2,03 GIL18 UC DNase I 176 2,25
Results continues to show that was an increase of copies/ mL when the samples were ultracentrifuged, except the patient GIL15. When the plasma samples were treated with DNase I, exists a lightly decreased of viral load result and the most significant difference of values of viral load was between the samples of Plasma Centrifuged compared to samples of Plasma Centrifuged treat with DNase I.
However, in the DNase I protocol is used EDTA to inactivate the enzyme. The blood of the donors was collected in tubes with EDTA so is important to ensure if the EDTA in the samples influences the activity of the DNase I.
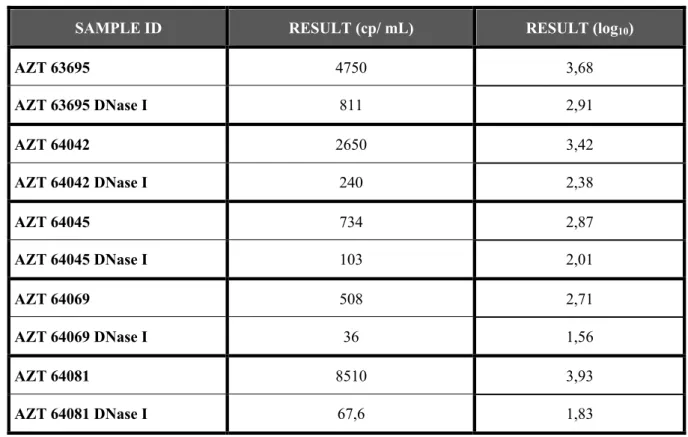
For this purpose, was used “Negative Plasma” (Defibrinated Delipidated Human Plasma) to resuspended 10x106 infected cells, isolated from five seropositive patients’ whole
blood (AZT63695, AZT64042, AZT64045, AZT64069, AZT64081) and compare the results with and without the treatment with DNase I.
Table 4 - Viral load, in HIV-1 RNA copies/ mL and log10 of the obtained value, in cells diluted in Negative Plasma from infected patients AZT 63695, AZT 64042, AZT 64045, AZT 64069 and AZT 64081. The samples treated with DNase I
before the PCR assay are identified with DNase I (AZT 63695 DNase I, AZT 64042 DNase I, AZT 64045 DNase I, AZT 64069 and AZT 64081 DNase I).
SAMPLE ID RESULT (cp/ mL) RESULT (log10)
AZT 63695 4750 3,68 AZT 63695 DNase I 811 2,91 AZT 64042 2650 3,42 AZT 64042 DNase I 240 2,38 AZT 64045 734 2,87 AZT 64045 DNase I 103 2,01 AZT 64069 508 2,71 AZT 64069 DNase I 36 1,56 AZT 64081 8510 3,93 AZT 64081 DNase I 67,6 1,83
In all samples was obtained a higher viral load in the samples not treated with DNase I but not a “Target Not Detected” result.
Due to this, was necessary to guarantee that the amount of DNase I used to prepare the plasma samples was enough to remove all HIV-1 DNA present, since the manufacturing protocol was changed.
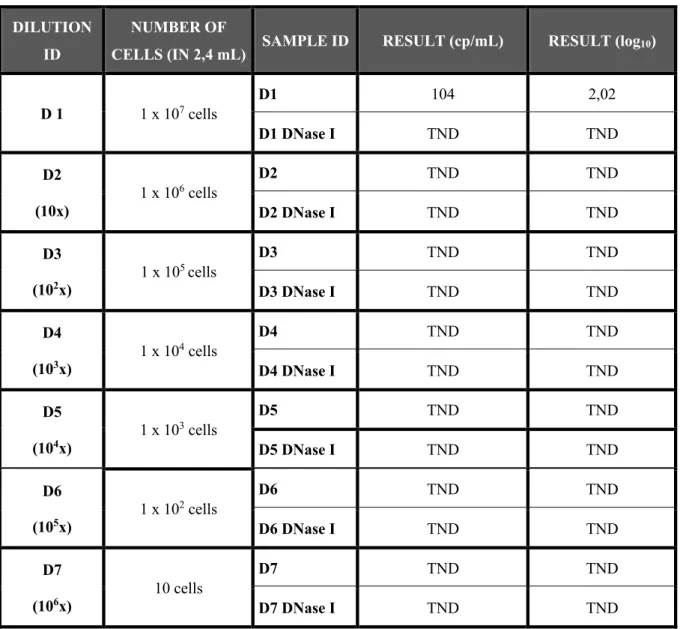
With the intention to understand if with a sample with less amount of viral DNA the result would be “Target Not Detect” (who means that the DNase I removed all the DNA present in the sample) was prepared pellets of 1 x 10⁷ cells from a patient (AZT65528) whose plasma
(10x, 101x, 102x, 103 x, 104 x, 105 x and 106x) and analyze in the Roche COBAS
AmpliPrep/COBAS Taqman HIV-1 test, version 2.0. The final volume of each dilutions was 2,4 mL to perform a DNase I and DNase I-free analysis. For DNase-free analysis was distributed 1,1μL of dilution and for the analysis with DNase was proceeded as follows while adapting the protocol, already explained above.
Table 5 - Viral load, in HIV-1 RNA copies/ mL and log10 of the obtained value, in seven different dilutions in FBS (10x, 101x, 102x, 103 x, 104 x, 105 x and 106x) of 1x10⁶ cells. The total volume of the dilutions was 2,4 mL, having been used 1,1
mL for the analyze of the samples not treated with DNase I (D1, D2, D3, D4, D5, D6 and D7) and 1,1 mL for the samples treated with the DNase I after the dilution (D1 DNase I, D2 DNase I, D3 DNase I, D4 DNase I, D5 DNase I, D6 DNase I and D7 DNase I).
DILUTION ID
NUMBER OF
CELLS (IN 2,4 mL) SAMPLE ID RESULT (cp/mL) RESULT (log10)
D 1 1 x 10⁷ cells D1 104 2,02 D1 DNase I TND TND D2 (10x) 1 x 10⁶ cells D2 TND TND D2 DNase I TND TND D3 (102x) 1 x 10 5 cells D3 TND TND D3 DNase I TND TND D4 (103x) 1 x 10 4 cells D4 TND TND D4 DNase I TND TND D5 (104x) 1 x 10 3 cells D5 TND TND D5 DNase I TND TND D6 (105x) 1 x 10 2 cells D6 TND TND D6 DNase I TND TND D7 (106x) 10 cells D7 TND TND D7 DNase I TND TND
Results show that only in the sample with 1 x 10⁷ cells not treated with DNase I (sample
D1) was detected viral load. In all the other samples the result was “Target not Detected”, meaning that all HIV-1 DNA was removed from the sample.
5 DISCUSSION AND CONCLUSIONS
Since the discovery of viral reservoirs in HIV-infected patients receiving cART, measuring the level of viral persistence has been one of the major challenges of the HIV research. These reservoirs can be found primarily in resting memory CD4+ T cells, which contain HIV-1 DNA
integrated into their genome. The existing antiretroviral therapies available depend on active viral replication to be efficient, therefore they are incapable of eliminating the latent cells from the host. Because latently infected CD4+ T cells are particularly rare (1 cell in a million resting
CD4+ T cells are replication-competent), even the most sensitive assays have a limit of
detection, often determined by the quantity of biological material that is available (61). The most commonly used assay is the PCR which target are the conserved regions of the HIV-1 genome. For that reason, it is crucial to optimize this assay to decrease the limit of detection an increase the sensitivity.
The Roche COBAS AmpliPrep/ COBAS TaqMan HIV-1 v2.0 protocol is commonly used for measuring the HIV-1 RNA in 1,2 mL plasma sample collected from whole blood of seropositive patients on cART and the limit of detection is 20 copies/mL.
Usually, after collecting the blood from the patients is performed a normal centrifugation (1200 X g for 10 min) to the blood tubes and then the plasma is collected and analyzed by PCR assay. Realizing ultracentrifugation in the plasma samples of HIV-1 infected patients GIL14 and GIL19 and comparing with samples from the same patients that only underwent centrifugation was possible to understand that the ultracentrifugation is important to detect the actual quantity of HIV-1 RNA in the plasma. In both centrifuged samples the result was “Target Not Detected”, meaning that none HIV-1 RNA was detected, but in the ultracentrifuged samples a small amount of HIV-1 RNA was measured. Nevertheless, was not possible to guarantee that only HIV-1 RNA was measured, considering that HIV-1 DNA from cells could exist in the plasma samples.
To evaluate the possible interference of the HIV-1 DNA in the obtained viral load values of the PCR assay was compared the results from samples centrifuged not treated with DNase I, centrifuged treated with DNase I, ultracentrifuged not treated with DNase I and ultracentrifuged treated with DNase I from four different patients (GIL15, GIL16, GIL17 and GIL18). Although slight, when the HIV-1 DNA was removed from the samples (centrifuged or ultracentrifuged, excluding in the GILP17) with the DNase I treatment was possible to verify that less copies/mL
of HIV-1 RNA were detected, which means that is possible that the plasma samples are contaminated with viral DNA when the protocol is performed, even in the ultracentrifuged samples. Thus, removing the viral DNA from the samples increases the sensitivity of the method and its possible to obtain more reliable results. The ultracentrifugation step continued to prove to be important to the optimization of the assay.
On the other way, in the DNase I protocol we used EDTA to inactivate the enzyme. Therefore, was necessary to ensure that the EDTA present in the patient's blood tubes would not influence DNase I activity. Using Negative Plasma to resuspend a predetermined number of cells from five patients (AZT 63695, AZT 64042, AZT 64045, AZT 64069 and AZT 64081) was performed the PCR assay in the Roche COBAS AmpliPrep/ COBAS TaqMan HIV-1 v2.0. Two possible results were expected, since that only HIV-1 DNA from the cells existed in the sample: equal results for samples with or without DNase I, meaning that the viral DNA was not removed from the sample by the DNase I and that was possible that the EDTA in the blood tubes inhibits the enzyme, or different results for samples with or without DNase I, meaning that the enzyme was not inhibit and the viral DNA was removed. Evaluating the results, in all the samples it was obtained a lower value of copies/ mL when the DNase I was used but none “Target Not Detected” result. This could mean that the EDTA in the collecting tube could partial inhibit the enzyme or that we were not using enough DNase I to remove all the viral DNA of the samples. Nevertheless, when we analyze the plasma samples, we have less quantity of viral DNA comparing to the samples that we had with ten million of cells.
Is known that: was used the same negative plasma in all of the samples; the quantity of EDTA was similar in all of the samples; and that the quantity of EDTA in the plasma was not enough to inhibit the action of the DNase I so if we have a sample with less HIV-1 DNA (plasma sample) the DNase I would remove all of the viral DNA. Due to this, several dilutions of ten million of cells were made to assurance that the amount of DNase I that was used was correct and was enough to remove all the viral DNA from the plasma sample, since the manufacture DNase I protocol was changed (because of the larger volume of plasma sample necessary to the assay). Since all of the results were “Target Not Detected”, except in the sample with 1 x 10⁷
cells and not treated with DNase I, is possible to conclude that the quantity of DNase I that was used is adequate and that manage to remove the possible viral DNA that could alter the obtained result of viral load from plasma samples.
Thus, the Roche COBAS AmpliPrep/ COBAS TaqMan HIV-1 v2.0 protocol was possible to optimize by collecting a larger volume of blood from the patients to proceed to the