Creating value in pharma through M&A:
The case of Watson Pharmaceuticals
Sebastian Zweiphenning
Dissertation written under the supervision of Susana Frazão Pinheiro
Dissertation submitted in partial fulfilment of requirements for the MSc in Business Administration, at the Universidade Católica Portuguesa, June 2016.
Table of contents
Abstract & Resumo ... 1
Introduction ... 2
Chapter 1 - Literature review... 4
The nature of the Pharmaceutical Industry and Key Developments ... 4
Coming into existence ... 4
The growth of the industry ... 4
Headwinds in the industry ... 6
M&A motives and value creation ... 8
Chapter 2 - Methodology ... 12
Chapter 3 - Case-study... 12
Growth pharma in question ... 12
Creating a leading global generics company ... 13
Creation of a specialty pharmaceutical powerhouse ... 16
New leader, new model ... 18
The beginning of Growth pharma ... 20
Transformation to branded growth pharma ... 24
Industry overview ... 25
Looking ahead ... 28
Exhibits ... s0-17 Chapter 4 - Teaching Notes ... 1
Objective ... 1
Suggested Teaching Questions ... 1
TQ1 ... 2 TQ2 ... 4 TQ3 ... 6 TQ4 ... 7 TQ5 ... 9 TQ6 ... 10 TQ7 ... 11
Chapter 5 - Conclusion, Limitations and suggestions for future research ... 12
Conclusion ... 12
Limitations of the study ... 14
Future research ... 14
1
Abstract:
This paper analyses the motives for mergers and acquisitions (M&A) in the pharmaceutical sector and whether these M&A’s create value. In order to give an industry perspective and let the reader experience the situation wherein managers of pharmaceutical companies operate, a case-study on Watson Pharmaceuticals is done. It provides a detailed perspective into the company’s M&A rationale. Through the literature review as well as the case-study the changes in the pharmaceutical industry are described as well as findings that indicate that shareholder value is created through M&A. Finally, similar motives for M&A are uncovered in the case-study as found in previous studies and current industry changes are described.
Resumo:
Este trabalho analisa as razões que motivam as fusões e aquisições no setor farmacêutico e o reflexo de tais fusões e aquisições na criação de valor. De modo a fornecer uma perspectiva industrial e permitir que o leitor experimente a realidade na qual os gestores de companhias farmacêuticas operam, foi realizado um estudo casuístico da companhia Watson Pharmaceuticals, fornecendo um panorama detalhado acerca da lógica de fusões e aquisições da companhia. Por meio da análise literária, bem como do estudo casuístico, são descritas as alterações na indústria farmacêutica, assim como as conclusões que indicam que a criação de valor acionário se dá através das fusões e aquisições. Por fim, razões similares para fusões e aquisições são reveladas no estudo casuístico, como visto nos estudos prévios e nas descrições das alterações atuais da indústria.
2
Introduction
Several deals between big pharmaceutical companies have crossed the newspapers in the last few years, with as of late (6th of April 2016) the busted deal between Pfizer and Allergan. Whenever combinations such as these hit the news, media commentators and (self-proclaimed) industry experts comment on the supposed benefits and challenges encompassing the new combined corporate entities. Most of the world's top pharmaceutical companies (based on sales) since 1995 that remained so until 2012 have done so through large acquisition(s) ( (Cha & Lorriman, 2014). In general, the industry has become much more concentrated throughout the years. In 1985 for example, the 10 largest pharmaceuticals based on sales made up 20 percent of global sales while in 2002 the top 10 global companies contributed 48 percent of sale (Danzon, Epstein, & Nicholson, 2004). Most of the consolidation has been achieved through mergers and acquisitions (M&A). Often several revenue synergies and cost savings are expected to be achieved, while commentators warn for a decrease in research and development (R&D) productivity and the risk of an unsuccessfully implemented integration.
The pharmaceutical industry is experiencing notable structural challenges after New Molecular Entities (NME's) output has grown only slightly, while costs of R&D increased. For example, based on year 2000 price levels, average R&D costs per NME based on clinical testing costs increased from $40 million in the 1980s to $280 million in the 1990s and rising currently (Scherer, Pharmaceutical innovation, 2010). While also the introduction of new drug discovery techniques and the emergence of the biotechnology industry changed the traditional R&D process. Finally, due to the loss off patents on top-selling drugs (so called "blockbusters"), insufficient replacement products and increased competition from generics (and indirectly their resulting price competition after patent loss) the pharmaceutical industry is changing structurally. As a response to these challenges, several pharmaceutical companies became involved in M&A in order to overcome the headwinds (Comanor & Scherer, 2013).
In this paper we aim to outline the historic motives for mergers and acquisitions in the pharmaceutical industry and identify factors that potentially increase or decrease the new combined company's value as a result of the M&A. More specifically, the
3
aim is to clarify the merits and feasibility of an M&A strategy for a Pharmaceutical company in comparison to the more traditional R&D based business model. In order to uncover this, we first analyze the development of the pharmaceutical sector to give a good overview. Secondly, we look into M&A motives given in the past and how these relate to value creation, also taking into account traditional M&A theory. Finally, through a case study of Watson Pharmaceuticals, a company that has grown into a notable player in the pharmaceutical sector through M&A, we gain a more practical perspective into the motives and objectives of M&A in the pharmaceutical industry and its feasibility in the future.
This paper now proceeds as follows: Chapter 1 provides the literature review, Chapter 2 discusses the methodology used, in Chapter 3 the case-study is provided, Chapter 4 are the teaching notes and finally in Chapter 5 the conclusion, limitations and suggestions for future research are discussed.
4
Chapter 1 - Literature Review
The nature of the Pharmaceutical Industry and Key Developments
The pharmaceutical industry consists out of several aspects that are important to understand the key developments that happened.
Coming into existence
The industry came into existence towards the end of the nineteenth century as sections of European chemical firms (e.g. Bayer, Sandoz and Roche) that used their know-how from the chemicals business. US companies (e.g. Merck, Pfizer and Lilly) joined in later and depended on European technology until after WWI. They were either producing and selling EU over the counter (OTC) drugs with a patent or making prescription drugs to sell to pharmacies and hospitals. In this period, there was little R&D activity in the sector.
Due to the start of WWII, R&D experienced an uptick. Especially US and UK based companies received financing and other resources during and after the war to develop drugs such as antibiotics. After the war, national governments started to finance national health research programs or programs that benefited the greater good (e.g. the National Institute of Health (NIH) in the US or universities). As a result, knowledge in the pharmaceutical industry rose drastically but output of new drugs remained relatively low (Malerba & Orsenigo, 2015). Since drug manufacturers did research by randomly looking through combinations to find something that worked without any prior knowledge or reasoning why it should work. As firms started to run several similar tests in a large quantity, developed databases of potential fruitful molecules and the R&D process become more standardized, new drugs reached the market. Due to the little amount of drugs that existed, the ability to patent new drugs and growing demand for the drugs coming to market, it became a very profitable undertaking. As a result of the large markets available and low amount of new drugs coming to market, revenue and growth was centralized in a few products called "blockbusters".
The growth of the industry
Demand was rapidly increasing as a result of higher living standards, growing populations, the installment of Welfare states in Europe or healthcare insurance in
5
the US and the potential needs new drugs could solve. At the time, generics were also not a threat to the branded drugs manufacturers, as until the 1984 Hatch Act was passed in 1984 in the US, generic drugs had to undergo a stringent amount of clinical trials similar to a new branded product before they reached the market. The combination of all these factors caused the pharmaceutical industry to change into a R&D intensive, soaring industry. R&D relative to sales increased from 3.7% in 1951 to roughly 10% in the 60s, while averaging 18% in the pharmaceutical sector compared to a mere 4% in the overall US manufacturing industry during 1988-2001 (Danzon, Epstein, & Nicholson, 2004). Economies of scope and iterative growth of knowledge were however little for pharmaceutical companies. As a result, it was relatively though to gain a long-term competitive advantage in the R&D process. Although successful new drugs launched did give those firms the opportunity to invest their resources in future R&D which gave them a higher chance of success in the future. Also, due to the nature of drugs, dominance in the market for one drug did not benefit presence in other markets except for company reputation. By now, US companies had also entered the drug manufacturing market by bringing innovations to the market.
In the 1970s, efforts to increase sales and marketing also started to take place. In order to make sure drugs on the market were safe and available to everyone if required, governments introduced legislation into the market. Regulators designed a distinction between drugs which could be sold over the counter and drugs that required a prescription from a specialist. This caused the larger pharmaceutical companies to invest heavily in R&D and salesforces. As prescription drugs became more prevalent, the drug manufacturers started to market their products directly to the prescribing specialists with focused marketing & sales personnel. To keep drugs affordable to everyone nations also implemented some form of price regulation and to remain safety standards high the drug approval process became more stringent. In the 1970s, the companies also started to expand beyond their home markets in order to lower the costs per unit of their products and spread R&D, sales and marketing costs better. Besides international expansion, this was also done through licensing and other commercial agreements. In general, the firms benefited more direct from the public health research that was done which caused a more systematic research design to take place.
6
Towards the 1980s, the biotechnology industry came into existence. The developments in themes such as genomics, combinatorial chemistry, and high-throughput-screening drastically changed the research process and economics of drug discovery (Schweizer, 2002). These companies were focused on commercializing scientific research with the funding of venture capital investors and strong patent protections. They did this by working closely with universities, transferring knowledge through academic spin-offs to biotechnology ventures aiming to discover potential new products. While the large pharmaceutical companies first waited on the sidelines, later they tapped into the knowledge of these biotechnology ventures through the creation of alliances and sharing relationships and buy-outs. It was necessary to participate in gathering the access to the biotechnology ventures knowledge and expertise for the pharmaceutical companies' survival as it seen as competence-destroying move (Tushman & Anderson, 1986) .Due to the capabilities and costs associated with being a large pharmaceutical company which was vertically integrated, they bought the successful biotechnology ventures to commercialize it.
The rise of the biotechnology industry was caused by a change in intellectual property rights (IPR). The new legislature slowly coming available in the 1980s reduced costs and the timespan of the patent process, extended patent's lives for some products and supported non-profit or publicly funded research to apply for patents and market the technology.
Headwinds in the industry
General pharmaceutical products have strong demand because they are often a necessity. As result, the industry has a strong foundation, pricing power and is less susceptible to recessions (Ganguin & Bilardello, 2005). However, by the 1990s, increases in drug prices and growing aging populations caused expenses to the pharmaceutical industry to increase and headwinds to arise. As it was becoming a growing expense for the public and government, pressure emerged to contain the costs. In addition, criticism towards the patent protection systems emerged as it focused mostly on R&D for drugs in rich markets that were unaffordable or not needed in poorer countries. The inability of access to some drugs or affordable drugs
7
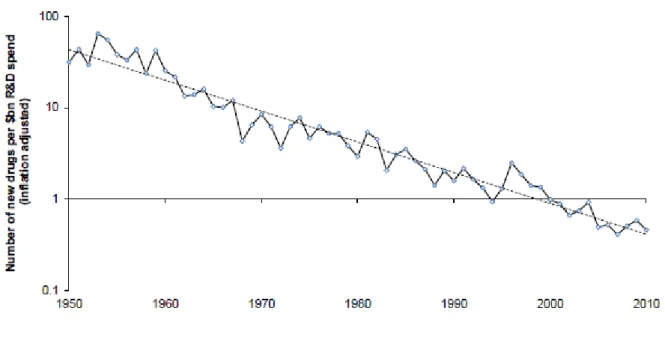
became an important political topic. Up to the 2000s advances in science and technology drove new innovative products to markets. As patents were coming off going forward and competition from generic manufacturers was increasing, big pharmaceuticals were in need for a new pipeline of successful products. By now, R&D productivity was decreasing since the mid 1990s (Malerba & Orsenigo, 2015) (see figure 1 below). Instead of focusing solely on internally driven R&D, they started to look for other options to fill their pipeline. They did this through M&A and by increasingly partnering with biotechnology firms and universities for new research through licensing and collaboration and a more focused approach.
Figure 1: Pharmaceutical R&D Productivity Trend
Source: (Upadhyay, 2015)
As the low hanging fruit had already been picked, companies were now attempting to discover increasingly difficult drugs but full with cash from past blockbusters they were able to buy companies faster than doing the internal research. From 1950 to 2008, the US Food and Drug Administration (FDA) had approved 1222 drugs that improved the public's health. However, towards the beginning of the 21st century costs were increasing quickly (R&D spending increased by roughly 7 percent per year (Scherer, R&D costs and productivity in biopharmaceuticals, 2013)), innovation was decreasing, competition was increasing and sales growth flattening. The industry is increasingly caught in new drugs output that is linear while costs of
8
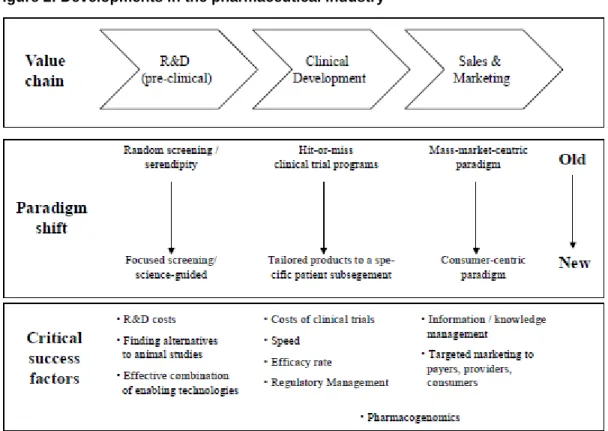
producing them are rising exponentially (Munos, 2009). Figure 2 below shows the shift in the pharmaceutical industry and the changing skills required to succeed.
Figure 2: Developments in the pharmaceutical industry
Source: (Schweizer, 2002)
M&A motives and value creation
The main motivation for M&A is that it increases profits and thus shareholder wealth (Gugler, Mueller, Yurtoglu, & Zulehner, 2003). As pipelines have started to slim down, and no new blockbuster products are found to replace revenue streams, M&A has often been used as an option in the pharmaceutical industry. There has however been a debate whether bidding firms actually gain shareholder value through M&A (Bruner, 2002).The big pharmaceutical companies are trying to replace the decreasing revenues and internal growth by acquiring competitors with promising products in their pipeline (Jarvis, 2010). Besides from building a pipeline internally or through licensing and partnerships, M&A is one of the only options to smoothen near-term earnings cycles and improve operational performance next to acquiring knowledge and the new capabilities required. It offers the opportunity to run combined operations more cost effective, fill uneven or lumpy pipelines, add capabilities and fill earnings downturns. Cost savings come from economies of scale
9
or scope, reductions in excess capacity and removal of inefficiencies. On the other side, revenue is enhanced by expanded global reach, a wider set of products, more application of winning technologies and the sharing of skills, knowledge and best practices (Ravenscraft & Long, 2000). Danzon, Epstein and Nicholson (2004) find that large pharmaceutical firms do mergers in response to excess capacity because of anticipated patents coming off and gaps in the product pipeline (measured by Tobin's Q ratio). One can see the patent-expiration having a similar effect as technological or regulatory shocks that prompt mergers in other industries. For small firms, mergers serve mostly as an exit strategy for firms in financial distress.
General economic research has listed several reasons for mergers such as economies of scale and scope, acquisition of specific assets and the corporate control market (Danzon, Epstein, & Nicholson, 2004). However, they cannot explain the reason they happened in waves historically. Pharmaceutical firms have been involved in merger waves since the end of the 20th and start of the 21st century. The waves took place in the late 1980s/early 1990s, mid 1990's, start of the 21st century and finally the 2010s and changed the industry set-up drastically. Before this period, the industry landscape had been relatively stable and not changed drastically. In the first M&A wave, Bristol-Myers Squibb and Smith-Kline Beecham merged. The second one consisted out of American Home Products combined with Ayerst and later Wyeth. Then Glaxo and Wellcome, Pharmacia and Upjohn, Hoechst AG and Marion Merrell Dow and Novartis Sandoz. In the third wave Pfizer combined with Warner Lambert (Koenig & Mezick, 2004). Finally, more recently in 2009 with the large mergers between Pfizer and Wyeth Laboratories and the combination of Schering-Plough and Merck and in 2011 the union of Novartis with Alcon and Sanofi-Aventis and Genzyme, one could opine a new wave has started. Hall (1999) and Andrade, Mitchell and Stafford (2001), suggest shocks as a result of technological disruption or deregulation efforts specific to industries as reasons that create excess capacity or other inefficiencies that cause M&A activity. Their studies however do not explain the within-industries pick-ups in M&A activity. As to value creation, Andrade, Mitchell and Stafford (2001) find improvements in efficiency as a result of mergers and announcement abnormal returns are in line with future expectations of cash flows. Hall (1999) finds that firms that have a high inclination to merge, experience a higher growth after they do M&A.
10
Ravenscraft and Long (2000), found positive abnormal returns of 0.59 percent for the newly combined firm plus 13.31% and -2.12% for target and bidder firms during the period 1985 to 1996 for 65 pharmaceutical deals with a value over $500 million. The 0.59 percent market value weighted combined company return was however insignificant. When looking more specifically at Ravenscraft and Long's sample, one sees high significant abnormal returns of 9.84, 4.97 and 7.6 percent for target, bidder and combined firms for large horizontal mergers. They define horizontal as being M&A between two top thirty pharmaceutical firms. For cross-national mergers, returns were also found to be positive and significant.
An often cited reason to oppose mergers in the pharmaceutical industry was because research of Comanor (1965) found diseconomies of scale in R&D for pharmaceutical companies. The research had been influential in opposing proposed mergers such as the Warner Lambert combination with Parke Davis in 1970. However, later research by Koenig and Gans (1975) suggested pharmaceutical R&D did benefit from economies of scale. Their different conclusions might be derived from other measures: Comanor's based on sales while Koenig and Gans looked at number of new drugs (NCEs). Schwartzman (1976) concluded similarly that NCEs increased with scale. However, Jensen (1987) found no economies of scale and later Graves and Langowitz (1993) found diseconomies of scale using a NCE approach similar to Koenig and Gans'. Together these studies suggest that increases or decreases in R&D productivity as a result of M&A are not yet clear while for industry participants it's no reason to stem their M&A activity. Barrret and Capell (2002) could not find correlations between the return on investment and size for pharmaceutical firms. Finally, more recently Koenig and Mezick (2004) concluded that pharmaceutical companies that engaged in M&A activity achieved more favorable post-merger R&D productivity scores than before. Regarding biotech acquisitions by pharmaceutical companies, Schweizer (2005) find in a limited size and scope sample no know-how transfer but the positioning as a center of R&D excellence, in essence they want access to the knowledge and R&D capabilities within the biotech company. Higgins and Rodriguez (2006), suggest that pharmaceutical firms with more rapid worsening pipelines and sales are more "desperate" and as a result show a higher chance of engaging in M&A.
11
Although the rationale for M&A in the pharmaceutical sector can be made from a shareholder's perspective, it could have negative social implications and negative influence on the new company's creativity and entrepreneurship. Scale effects, improvements in efficiencies and arguably more effective R&D (see the debate above) as well as tax inversions (transferring operations to a lower corporate tax jurisdiction) will drive shareholder value. However, social implications might be less pretty by employee lay-offs and business closures and transfers to other countries. Finally, individuality and small team spirit that drives teams plus discovery and innovation might be reduced as processes get standardized and departments and teams grow in size (Kanavos & Angelis, 2014).
12
Chapter 2 - Methodology
The study is primarily based on qualitative analysis and compilation of secondary resources such as annual reports, academic articles, newspaper items, SEC filings, Investor presentations, transcripts of investor earnings calls, industry reports, transcribed interviews, official company announcements and topic related websites. Mostly qualitative research has been done, as it is intended to grasp and explain the specific real-life situation in our case study.
The literature review was constructed with the use of academic literature databases and search engines such as Science Direct and Google Scholar.
The case study was primarily built upon information out of the Watson Pharmaceuticals, Actavis and Allergan annual report in addition to their official company announcements and SEC files. The combination of the gathered data and information has been used to develop the case-study and accompanying teaching notes. In addition, secondary quantitative data is retrieved from official government statistics (e.g. FDA.gov), Industry associations (e.g. PhRMA) and commercial data providers (e.g. EvaluatePharma). An interpretive approach is used to build a holistic understanding of the phenomenon under investigation in the study. The case-study design should prove to be useful for answering "how" and "why" questions (Yin, 2003) , at which we aim in this study.
Chapter 3 - Case-study Growth pharma in question
On Wednesday 6 April 2016 Pfizer Inc. and Allergan plc announced that their $160 billion merger deal, which would create the world’s largest drugmaker in the world, had been terminated. Allergan CEO Brenton Saunders commented as follows:
“While we are disappointed that the Pfizer transaction will no longer move forward, Allergan is poised to deliver strong, sustainable growth built on a set of powerful attributes. Leading therapeutic franchises with strong brands across seven therapeutic areas provide the foundation for continued strong growth in 2016 and beyond. Our pipeline is one of the strongest in the industry, loaded with 70 mid-to-late stage programs including 14 expected approvals and 16 regulatory submissions in 2016 alone.” 1
1
13
Saunders, had made his rise by managing integrations throughout his career in the pharmaceutical industry, transforming Actavis (the company’s name preceding the acquisition of Allergan) into a top ten global pharmaceutical company. Known as a skeptic of in-house drug discovery, he followed his self-coined “growth pharma” strategy. Now, the world’s largest ever healthcare deal to be, was terminated after the US treasury department changed a rule that took away many of the tax-based benefits of the deal. As the termination basically barred similar future deals, investors and the media were wondering how Allergan’s growth story might continue in light of some internal and external challenges going forward.
Creating a leading global generics company
After nearly 24 years at the helm of Watson pharmaceuticals, founder Allen Chao, Ph.D. decided in 2007 to name industry veteran Paul Bisaro as new CEO (Exhibit 5: CEO biographies). The leadership change signaled the next phase of the company towards “Watson 2.0”. The Watson left by Chao was a well-positioned specialty pharmaceutical company, operations consisted out of a broad portfolio of generics, brands and distribution in the US and India. The differentiated products in the brand portfolio were high-margin products with attractive revenue opportunities. The company selected therapeutic areas, such as a growing urology franchise, based on growth opportunities and the size of the physician audience. The 27 branded products were distributed by roughly 330 sales professionals in two specialized sales groups: specialty products (e.g. the urology franchise) and nephrology (Exhibit 1B: Key metrics of Allergan). Although only providing for 19% of revenue, these helped to offset potential market fluctuations in their broad generics portfolio which accounted for the bulk (59%) of Watson’s business (Exhibit 1A: Key financials of Allergan). Watson claimed a leader position in oral contraceptives and pain management products and boasted 150 product families. It’s focus was primarily on complex generics or pharmaceuticals that complemented the existing product lines. Most of Watson’s generics were distributed in its key market the US by its Anda distribution business to approximately 50000 ship-to locations over 200 suppliers, providing the company a direct link to customers in pharmacies and medical buying centers worldwide. With the 4th largest distribution operations in the US, the company was unique among US pharmaceutical companies.
14
Watson 2.0 primarily aimed at growing the company’s international presence through offshore expansion via strategic alliances and synergistic acquisitions while simultaneously increasing profitability of the branded segment up to a similar contribution to earnings as the generics business and enhancing efficiencies throughout the company.
In 2009, Bisaro made great inroads towards Watson 2.0 by acquiring generic drugmaker Arrow Group for $1.75 billion (Exhibit 2A: Allergan M&A activity), stating:
“The acquisition of Arrow will mark a significant milestone in realizing our strategic vision to expand our global footprint and leverage our assets across many developed and emerging markets around the world,"2
The combined company would go from operations in the US, India and China to over 20 countries, including Arrow’s key markets Canada, France and the UK (Exhibit 3: Evolution of countries active). The expanded footprint would allow Watson to market its products in many established and emerging countries. While also strengthening and diversifying the company’s product portfolio and pipeline. The newly obtained global infrastructure and product portfolio had little overlap with Watson’s, creating a platform for long-term growth. The now global company marketed roughly 170 generic and 30 brand product families (focused on Urology and Women’s Health) in the US, while offering 250 different products in the UK under Arrow Generics. The acquisition also gave entry into Eden Biodesign, a biotechnology company through a minority stake, which it acquired completely by January 2010.
In the following two years, Watson reduced its debt and integrated its global operations while also investing to expand its product portfolios. In 2011, it strengthened its commercial presence and generics portfolio in key European markets while adding product development capability with the $562 million acquisition of Specifar Pharmaceuticals.
"We got the beachhead established but now we needed the firepower to go out and expand that beachhead, and that's what this does." - Bisaro3
2
15
Shortly thereafter the expansion story continued by gaining strong presence in key southeast asian markets while vaulting into the number five position for generics in Australia through the January 2012 acquisition of the Australian Ascent Pharmahealth.
By November 2012, the company became the world’s third-largest generics
company behind Teva Pharmaceutical and Novartis by a €4.25 billion merger with
Actavis. The merger allows it to compete more effectively and signified the completion of Watson’s transformation to Watson 2.0: a global generic company. It also changed its name to Actavis to represent itself worldwide under one trademarked and protected name. Bisaro stated the rationale for the merger as following:
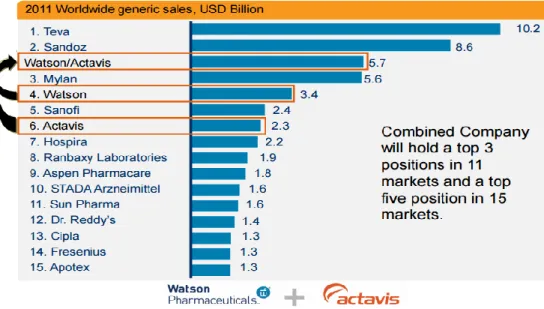
“In a single, commercially compelling transaction, we more than double Watson’s international access and strengthen our commercial position in key established European markets as well as exciting emerging growth markets, including Central and Eastern Europe and Russia. The transaction achieves Watson’s stated strategic objective of expanding and diversifying our business into a truly global company. Once the transaction is completed, approximately 40% of our generic revenues will come from markets outside of the U.S.”4
Figure 1: Impact of Watson Pharmaceuticals and Actavis combination
source: Watson pharmaceuticals investor presentation, (Actavis, 2012)
3
Watson Pharma buys Greece's Specifar for $562 million, accessed May 2016, Krauskopf (2011)
4
16
Actavis as a separate company was well positioned with presence in more than 40 countries and approximately 1000 products marketed worldwide, added to Watson it transformed the company’s commercial position and added complementary products to its portfolio and pipeline. The combined company held the top 3 position in 12 markets and a top 5 position in 16 markets and was active in more than 60 countries.
Creation of a specialty pharmaceutical powerhouse
The merger also highlighted a shift in strategy to not only play on a global stage but also build up a branded drug and biotech business to supplement the less profitable generics. Bisaro stated in a telephone interview:
“We will be focusing even more heavily on brand acquisitions and brand-licensing deals to diversify our business.”5
The strategic objective to become a global specialty pharmaceutical company, set five years ago, was achieved. A new goal was to become a premier global specialty pharmaceutical by 2018. The merger with Actavis helped towards this objective as it broadened the company’s product portfolio and expanded the development pipeline (over 185 Abbreviated New Drug Applications (“ANDAs”) pending with the FDA). It had gained core leadership positions in modified release, solid oral dosage and transdermal products into semi-solids, liquids and injectables. Only two months later Actavis already followed through on its brand growth strategy with a small bolt-on acquisition of Uteron Pharma for $150 million to add to their Women’s Health portfolio.
In 2013 Actavis made a bold move towards its new strategic objective with the acquisition of Warner Chilcott. Bisaro saw compelling commercial and financial
benefits in the combination: “The combination of Actavis and Warner Chilcott creates
a strong specialty brand portfolio focused in therapeutic categories with strong growth potential, and is supported by a deep pipeline of development programs”.6
5
Watson CEO eyes cost cuts, brand growth as Actavis deal closes, accessed May 2016, Station (2012) 6
17
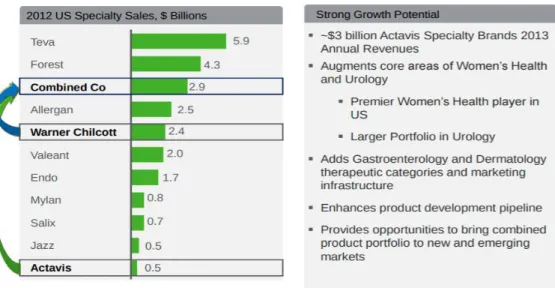
By combining, he created a powerful global player with a top three position in the US specialty pharmaceuticals market that was strong in Women’s Health, Gastroenterology, Urology and Dermatology (Exhibit 4A: Therapeutic categories evolution). According to investment bank Jefferies analysts the enhancement of Actavis’ branded business was very beneficial in this transaction, as the company itself had shown relatively little advancements in bolstering its specialty pharmaceuticals division. The addition would increase the marketed specialty brands products offering by 125% (4B: Branded products pipeline evolution). The acquisition would provide the ability for in-licensing opportunities within key therapeutic categories and the introduction of a broader portfolio of products to Actavis’ worldwide markets, creating better coverage. In the new combination specialty brand sales would jump from roughly 7% to 25% in 2013, while reducing the US sales force from approximately 1100 professionals to 750.
Figure 2: Impact of Actavis & Warner Chilcott combination
Source: Actavis investor presentation, (Actavis, 2013)
In addition to the operational benefits, the combination also relocated headquarters to Dublin as an Irish plc. This created a favorable tax structure by lowering the company’s tax rate overnight from about 28% to 17%. According to Bisaro, the tax inversion as part of the combination with Warner Chilcott was “icing on the cake…
18
What we’re trying to do is level the playing field”7
. Industry analysts were happy with the incorporation in Ireland, David Maris of BMO Capital Markets was already looking towards the future: “the longer-term benefit of a lower tax rate is that it allows
you to acquire other companies at even better price,”8
expecting more (potentially bigger) deals going forward.
To fulfill the desire set by the board to become a premier player in specialty pharmaceuticals, the company continued with its biggest deal ever. In 2014 Actavis was to acquire Forest Laboratories for $25 billion, combining two of the world’s fast specialty pharmaceuticals. Bisaro noted:
"In addition to being financially and commercially compelling, this transaction fundamentally transforms Actavis, positioning it for a new and even more exciting future. In five short years, my management team has transformed Watson, and now Actavis, from a U.S. generics company to a leader on the global specialty pharmaceutical stage. Brent and his team, in a short period, have made dramatic progress in rejuvenating Forest into a leader in North American brands.”9
The acquisition enhanced Actavis’ size and scale in addition to being less focused on generics going forward with specialty brand revenues contributing roughly half to the combined company's revenue. It also brought Forest’s brand portfolio and pipeline to additional markets while creating stronger and new therapeutic categories.
New leader, new model
As part of the combination, CEO Bisaro became executive Chairman while Brent Saunders, former CEO of Forest Laboratories, took place as new CEO. Saunders had successful experience with integrating and turning-around companies while being involved as CEO in two big acquisitions with a combined value of $33,5 billion before. According to Bisaro the appointment reflected the increased size and complexity of the combined business and the exceptional and complementary expertise of both company’s management teams. It was Saunders’ job going forward
7
Actavis Lowers Tax Rate to 17% After Warner Chilcott Deal, accessed May 2016, Armstrong (2013) 8
Actavis to buy Warner Chilcott in $5 billion stock deal, accessed may 2016, Humer & Pierson (2013)
9
Actavis to Acquire Forest Laboratories for $25 in an Equity and Cash Transaction, accessed May 2016, Forest Laboratories (2014)
19
to integrate Actavis’ generics business with Forest Laboratories’ more specialized prescription-drugs operation while also eying for brand drug acquisitions. Saunders saw an innovative new model for the global specialty pharmaceutical:
"Our business model is driven by a broad portfolio of strong brand, generic and OTC products, a commitment to development-focused, results oriented research and development and the size and scale needed to efficiently and cost-effectively meet the needs of our global customer base. The new Actavis is uniquely positioned to deliver exceptional long-term financial performance and expand access to pharmaceutical products for patients around the world.”
However, Canaccord Genuity analyst Corey Davis noted that marketing both brand and generics on such a balanced scale was not common:
"Generics are all about being savvy with patent litigation and settlements, [while] branded drugs are something else altogether. Generic drugs don't need much marketing; price does that, as do relationships with distributors and pharmacies. Brands require expensive sales support, focused on physicians and payers--not to mention DTC advertising. They are almost polar opposite business models." 10
Saunders started just three months after again with a relatively small $675 million bolt-on acquisition of Durata Therapeutics for its DALVANCE product, a targeted investment that strengthened Actavis’ emerging infectious disease therapeutic
category. Saunders commented: “DALVANCE is a novel antibiotic that can be used
in multiple sites of care. It complements our Teflaro product and ceftazidine-avibactam, currently in late-stage development, which are intended for use in the inpatient setting. DALVANCE is also a highly differentiated product with documented efficacy, safety and tolerability, and its acceptance by healthcare providers will be enhanced by Actavis' best-in-class commercial infrastructure and complementary product line. With the addition of DALVANCE, we deliver on our commitment to build an anti-infective franchise with true scale.”11
The acquisition fitted perfectly in the new business model as the investment could be developed to its ultimate potential within Actavis’ infrastructure. With Actavis’
10
Not for sale, says new Actavis CEO. We're buying instead, accessed May 2016, Staton (2014)
11
20
resources, commercial reach and scale DALVANCE gained maximum access to patients worldwide. by may 2015, he also expanded the company’s presence in the UK generics market in a similar fashion by buying niche generics company Auden Mckenzie for $495.9 million. The acquisition gained Actavis the top generic supplier spot in the UK and number three place for pharmaceuticals in the UK in general.
The beginning of Growth Pharma
In 2015, Saunders played white knight in a heated takeover-battle by preventing hostile suitor Valeant Pharmaceuticals from taking over Allergan (Exhibit 6: Actavis acquisition of Allergan timeline). By acquiring Allergan for $65.6 billion Saunders saw
“a once-in-a-lifetime, unique opportunity to transform our industry.”12
At the time, transaction was the largest recorded transaction ever in the pharmaceutical sector. “This acquisition creates the fastest growing and most dynamic growth pharmaceutical company in global healthcare, making us one of the world's top 10 pharmaceutical companies. We will establish an unrivaled foundation for long-term growth, anchored by leading, world-class blockbuster franchises and a premier late-stage pipeline that will accelerate our commitment to build an exceptional,
sustainable portfolio.”13
said Saunders. The combination doubled the brand segment
and international revenue and would transform the growth profile to a minimum of 10% for the foreseeable future. Allergan would add blockbuster franchises in
Ophthalmology, Neurosciences, and Medical Aesthetics/Dermatology/Plastic
Surgery which could now be extended to a total of 100 markets. The addition
strengthened presence notably in Canada, Europe, Southeast Asia and Latin America while also adding to China and India. The combination created a pharmaceutical giant with an unparalleled growth profile in comparison with other big pharmaceutical companies.
12
Actavis Agrees to Buy Botox Maker Allergan, accessed May 2016, Rockoff (2014)
13
21
Figure 3: Impact Actavis & Allergan combination
22
To reflect the evolution of the company, Saunders decided to adopt Allergan’s name for the dynamic new breed of pharmaceutical he had created: "growth pharma". Growth pharma was to rival big pharma in size but have considerably higher growth margins and Allergan was going to be a leader in this. It was going to achieve this by a bigger contribution of branded drugs sales, strong pipeline, highly efficient salesforce, sustainable therapeutic brand categories and strong worldwide commercial presence.
Saunders wanted Allergan to be Number 1 or number 2 in each core therapeutic area. Allergan’s R&D organization focused on late-stage development in its therapeutic areas to market durable products that deliver long-term growth. To achieve this, it formed an “ecosystem where everybody wants to bring us their ideas, their innovations, so that we can continually source new things," Saunders said (see figure 4 below). This was part of his newly introduced Open Science model for research & development (R&D) wherein innovation would flow into Allergan from the healthcare ecosystem (Exhibit 10B: Shift of Pharma innovation ecosystem). "Over
the past 15 years, the pharmaceutical innovation ecosystem has shifted. Where global pharma companies had previously driven the lion's share of new product revenue, now the driving source of innovation is coming from smaller biotechnology and specialty pharma companies, as well as academia. Open Science defines our position in this new ecosystem – as a magnet for game-changing ideas and innovation. We bring these programs into our best-in-class product development and commercialization platform to build a sustainable R&D portfolio that enables Allergan to continue to be a leader in Growth Pharma. Through our Open Science model, we seek to continue to drive strong R&D productivity by delivering innovative therapies that create long-term shared value for Allergan, for customers and for patients."14
14
Allergan Outlines Open Science Model and Highlights Key Development Programs at R&D Day, accessed May 2016, Allergan (2015)
23
Figure 4: Allergan’s Open Science model
Source: Allergan presentation at OIS (Saunders, 2015)
Saunders stressed that his “Open Science” model did not mean he was an opponent
of R&D in big pharma: “I’m pro-R&D, but I don’t believe that any single company can
corner the market on innovation in even one therapeutic area. It doesn’t mean they shouldn’t do basic research where they have special insights, but even then they need to be open to the ideas of others. Innovation in healthcare is more important than ever. Other companies have had success with different models based on different capabilities, and we applaud every new drug approval.” 15
By recognizing and welcoming great innovations from outside Allergan, he believed the company could strategically invest in innovation from outside to increase R&D efficiency and fulfill unmet needs for patients (Exhibit 8D: R&D productivity). It wanted to be the preferred partner in current and new development collaborations.
As part of Allergan’s “Open Science” model and value creation strategy it acquired Kythera Biopharmaceuticals, Naurex and Aquisis in the latter half of 2015 for a combined $2.96 billion. The Kythera acquisition added a list of differentiated products such as the non-surgical KYBELLA injection (treating double chin) and development programs to Allergan’s aesthetics business. Keith Leonard, CEO of Kythera saw value joining forces:
15
24
"Allergan's world-class medical aesthetics, global footprint, history and commitment to developing leading aesthetic products makes them ideally suited to realize the maximum commercial potential of KYBELLA™."16
Naurex would build on the company’s leadership position in their mental health portfolio. Saunders saw to strengthen Allergan’s development pipeline and growth while progressing Naurex’s pipeline to commercialization: "Naurex's unique pipeline
comprises compounds that utilize a new mechanism to target areas of significant unmet medical need in Major Depressive Disorder (MDD), including severe and/or treatment-resistant depression. These highly differentiated compounds will immediately bolster our exceptional mental health pipeline."17
Finally, the AqueSys acquisition added to Allergan’s eye care category. David Nicholson, president of Global Brand R&D saw AqueSys’ potential: "The XEN45
program has been shown to provide a robust efficacy profile with minimal side effects, and if approved in the U.S., would provide an exciting new treatment option for patients, and one that is highly complementary to our ongoing portfolio and development programs in this critical treatment area."18
Transformation to branded growth pharma
While the deals to extend Allergan’s branded drugs portfolio and development pipeline were being made and pending in the latter of 2015, it took another bold action: the divestiture of Allergan’s global generics business. By selling its generic pharmaceuticals business to Teva for $40.5 billion, it would remain as a more focused branded growth pharma. The branded business that would remain was focused on their seven key therapeutic categories with strong double-digit growth prospects (Exhibit 4C: Allergan 2015 core therapeutic areas & new product sales estimates) and a solid development pipeline. The brand-focused company would reduce operational complexity by going from 40 to 12 plants worldwide and magnified its “Open Science” R&D strategy. Saunders’ reasoning was the following:
16
Allergan to Acquire KYTHERA Biopharmaceuticals, accessed May 2016, Allergan (2015)
17
Allergan to Acquire Naurex, accessed May 2016, Allergan (2015)
18
25
“While we were not actively seeking a buyer for our generics business, Teva presented an offer at a very compelling valuation that reflects and recognizes the significant value that our global generics team has generated in creating and managing a world-class generics business. As a result of the transaction, we will also obtain a minority equity interest in Teva, to share in the upside of the generic R&D pipeline we are transferring in this combination."19
The pending transaction was expected to be closed by the first quarter of 2016. However, antitrust clearance from mostly EU and US regulatory bodies had delayed the progress as Teva had to divest $1 billion in assets in order to proceed. Teva now expected it to take until June 2016 as required divestitures in the US were more extensive and thus required more time and negotiations with the Federal Trade Commission (FTC) than expected.
Industry overview
The global pharmaceutical industry can be split up in generic drugs and branded drugs manufacturers (Exhibit 7: Top 30 global pharma firms in 2014 and 11B: global spending on drug classifications). In general, generics have spent less on R&D than branded drugs manufacturers due to their targeting of off-patented drugs. Generics accounts for 80% of the prescriptions written in the US drug market and the global
top 5 generic manufacturers generate 47.4% of global generics sales in 201420.
The global pharmaceutical industry has undergone significant changes during the period of Watson’s transformation.The industry, the branded manufacturers faced a “patent cliff” from roughly 2010 to 2015 (see Exhibit 8A and 8B) wherein a notable amount of successful patented drugs from the 90’s lost their exclusivity, while there had been relatively low R&D output (see Exhibit 8E and 8F) and costs per output increased. As a result, the bloated cost-structure of most big (branded) pharma companies became visible as sales declined (see Exhibit 9: margins of comparables). The new stream of patent-expired drugs to come on the market was a boon for generic manufacturers (see Exhibit 11A), who depended much more on their ability to reach customers through distribution to increase revenues. To capture
19
Allergan Accelerates Transformation to Branded Growth Pharma Leader, accessed May 2016, Allergan (2015)
20
26
future growth, pharmaceutical companies had undertaken several measures in the last decade to stay relevant in the changing business environment. This was mostly accomplished through internal cost-cutting or via M&A. Savings on every expense were targeted: sales & marketing, costs of goods sold and even R&D.
The industry increasingly focused on running efficient internal operations to reduce costs in anticipation of the patent cliff and increase scale. While the focus was initially on internal cost-cutting, towards 2009 it became clear that more extreme measures were necessary: in 2003 Schering-Plough lost its patent on the blockbuster Caritin and Pfizer failed the product approval of Torcetrapib and launch of Exubera in 2006-2007. As a result the firms orchestrated mergers targeting synergies of roughly 30% of target expense and 25% in target sales while reducing
workforce21.
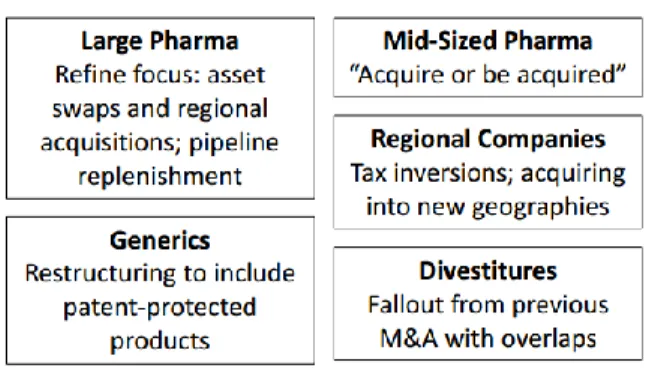
M&A became increasingly important to achieve the company’s goals by expanding reach of the current portfolios, grow internationally, deepen or broaden the product portfolios and enhance buying power of inputs while simultaneously eliminating redundancies in the workforce (see Figure 5 below). In addition, relocating headquarters to lower tax-rate countries fueled M&A as it allows enhances net profits and future deals. However, valuations were rising as companies were competing for targets making it less sustainable (Exhibit 2C: Top pharma M&A deals in 2015 and 2014). Companies also became increasingly focused, divesting or reducing insignificant side operations.
Figure 5: M&A rationale
source: (Wang, 2014)
21
27
As a result of the decrease in R&D productivity (Exhibit 8C: Declining R&D productivity), pharmaceutical companies also started to focus more on certain therapeutic categories that fit the company’s legacy business and strength to gain leadership in the therapeutic area. By focusing, big pharma could uphold innovation leadership in the category and increase the effectiveness of its marketing and salesforce. The increased focus on certain categories also contributed to the uptick in M&A as big pharma started to pool resources through M&A, licensing and asset swaps to create leadership areas.
Specialty pharma companies followed a similar strategy targeting several therapeutic areas with a lesser focus given the limited amount of products in the specialty pharma industry. Instead of focusing on a few blockbuster products, its salesforce offers several (e.g. 5) medium market-size products in a therapeutic area that combined give a similar sales potential. Just like big pharma this increased the effectiveness and relevance of the marketing and salesforce to customers, although less impact of patent expiration.
The source of innovation within the pharmaceutical world had also changed since more venture capital firms started to fund biotech startups with innovative R&D projects (see Exhibit 10A). While in 1998 big pharma contributed 62% of all New Molecular Entities (NME’s) by 2013 this had decreased to 22% (see exhibit 10B). As a result of this trend and the hope to acquire innovation at a better cost, several big pharma companies started to change their R&D methods from a closed in-house model to an open-source or networked model (see Exhibit 8G and 8H). Within this model, big pharma taps into external sources for research and development of its pipeline. This model gives potential access to more innovations early in the process while spreading the accompanied risks and costs of the R&D (see figure 6 below).
28
Figure 6: Overview of R&D model on R&D/sales ratio and % pipeline externally sourced
Source: Allergan R&D presentation (Schaison, 2015)
To conclude the industry overview, during the period and even more so in the future, the share of prescription drug sales coming from international markets is growing. Global prescriptions sales in general are expected to grow by 4,8% per year from 2014 to make it a $987 billion market by 2020 according to EvaluatePharma (see Exhibit 11C). Generics will also continue to grow at a faster pace than branded pharmaceutical products. The share of sales coming from biotechnology products (bioengineered vaccines and biologics) had also tremendously increased and will continue to do so, making up 27% in 2020 according to EvaluatePharma (see Exhibit 11D).
Looking ahead
While the $160 billion merger was cancelled, shareholders were wondering what Saunders was going to do next. As the supposedly largest deal of 2015, it was heavily followed and commented on in the media. By some seen as a deal to redomicile Pfizer to Ireland to lower taxes, it sounded the warning bells with suggestions similar to this:
“companies are increasingly pursuing financial engineering to fix troubled core businesses, a trend that in previous booms has ended poorly for investors”.22
22
29
The merger would have brought Pfizer roughly $1.7 billion in tax savings by 2018
based on analysts’ estimates23. In addition, the media highlighted Allergan’s record
of employee layoffs in past M&A transactions and was wary that it was not always productive for R&D. Firing staff could demotivate the remaining workers and cause key researchers to leave. Also, lab productivity didn’t always scale, resulting in a lackluster development pipeline.
Shareholders also started to worry about the sustainability of Allergan’s business model, as its competitor Valeant Pharmaceutical who from a distance appeared to follow a similar playbook, had faltered. Both firms had grown through an acquisitive style with less focus on R&D, done tax inversions and increased the prices of drugs. Valeant had come in the spotlight after it was accused of fraud at one of its distributors, aggressive sales techniques (e.g. channel stuffing) and ludicrous drug
price hikes. Democrats’ presidential contender Hillary Clinton addressed Valeant
Pharmaceuticals in her campaign, saying: "This is predatory pricing. It is unjustified. It is wrong." 2016 presidential candidates from both sides had addressed drug costs in their campaigns making shareholders worried about the future of some pharmaceutical companies.
Saunders had proposed the combination with Pfizer as another transformation: “This
bold action is the next chapter in the successful transformation of Allergan allowing us to operate with greater resources at a much bigger scale. Joining forces with Pfizer matches our leading products in seven high growth therapeutic areas and our robust R&D pipeline with Pfizer’s leading innovative and established businesses, vast global footprint and strength in discovery and development research to create a new biopharma leader.”24
23
Pfinancial Engineering, accessed May 2016, Cyran (2015)
24
30
Now that the deal was aborted by mutual agreement after new rules by the US treasury department prevented much of the tax benefits for Pfizer, shareholders grew more critical towards Allergan’s model of creating value.
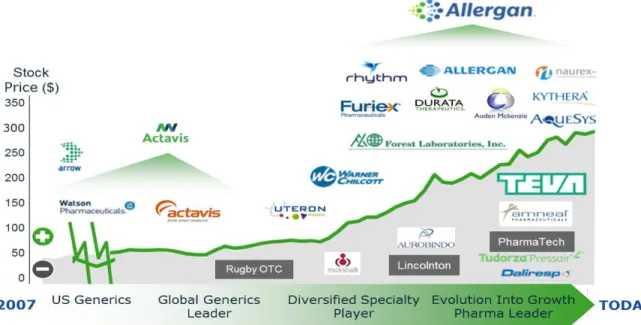
Figure 7: Allergan’s shareholder performance and M&A activity from 2007-HY2015
Source: Allergan website; Investor relations, May 2016
Shareholders were wondering how the future would look like. Could Saunders replicate the success he had created since 2007 (see figure 7 above)? Firstly, would the company still do large deals in the future now that the US treasury department had taken away some of its merits? Was Saunder’s “growth pharma" strategy still possible going forward now they were one of the biggest pharmaceutical companies based on revenues and market capitalization? Was Allergan’s R&D style sustainable going forward or would it shift to the more traditional style? Was the business model it had used in the past actually sustainable or would it halt like Valeant’s, especially now that Valeant’s supposedly similar practices had come to light in the US presidential elections and tax benefits had been barred by the US treasury department?
1 Year 2007 2008 2009 2010 2011 2012 2013 2014 2015 Generics segment (x1000 000) Net revenues 1.501,9 1.474,3 1.668,2 2.338,4 3.367,2 4.446,1 6355,9 6747,2 6375,3 cost of sales 917,9 883,8 947,1 1.198,9 1.817,8 2.430,9 3294 3198,6 3048,1 R&D generics 102,4 119,2 140,4 194,6 227,7 256,3 425,1 480,2 422,2 Selling and marketing 55,4 55,2 53,8 111,9 156,0 281,2 638,3 679,9 557,7 Generics contribution 426,2 416,1 526,9 833,0 1.165,7 1.477,7 1998,5 2388,5 2347,3
Brands segment
Net revenues 482,7 455,0 461,0 397,8 441,0 482,4 1124,8 4631,4 12835,5 cost of sales 99,9 107,1 89,3 88,4 94,4 116,8 372,2 1649 1607,3 R&D brands 42,4 50,9 56,9 101,5 67,7 146,2 191,8 605,7 2358,5 Selling and marketing 108,0 118,2 144,5 137,8 168,6 175,5 269,5 1057,5 2536,7 Brands contribution 178,4 178,8 170,3 70,1 110,3 43,9 291,3 1319,2 6333
Distribution segment
Net revenues 566,1 606,2 663,8 830,7 776,2 986,4 1196,9 1683,7 2225,4 cost of sales 487,0 511,9 560,4 711,2 652,7 846,6 1024,5 1456,2 1905,3
R&D - - -
-Selling and marketing 52,0 59,5 64,8 70,3 77,2 89,8 112,5 112,6 146,9 Distribution contribution 27,1 34,8 38,6 49,2 46,3 50,0 59,9 114,9 173,2
Total contribution 631,7 629,7 735,8 952,3 1.322,3 1.571,6 2349,7 3822,6 6506,2
General and administrative 205,7 190,5 257,1 436,1 353,1 625,3 1027,5 1743,2 3283,7 Amortization 176,4 80,7 92,6 180,0 354,3 481,1 842,7 2597,5 5453,4 asset sales/impairments (6,1) 0,3 2,2 30,8 78,7 149,5 902,7 749,6 783,6
Operating income 255,7 358,2 383,9 305,4 536,2 315,7 -423,2 -1267,7 -3014,5
Total other income (31,5) 0,1 (21,3) (54,8) (80,2) (70,6) -215,2 -444,4 -1415,7
Provision for income taxes 83,2 119,9 140,6 67,3 196,9 146,8 112,7 81,9 1561,9
Net income 141,0 238,4 222,0 184,4 260,9 97,3 -750,4 -1630,2 -2868,3
Net income from discontinued generics operations 6787.7*
Diluted weighted avg. shares outstanding 117,0 117,7 116,4 124,2 126,5 128,4 142,3 219,7 367,8
Financial position
Total assets 3.472,0 3.677,9 5.903,5 5.686,6 6.698,3 14.114,8 22725,9 52529,1 135840,7 Total debt 905,6 877,9 1.457,8 1.016,1 1.033,0 6.433,3 9052 15543,7 42726,2 Total stockholders' equity 1.849,5 2.108,6 3.023,1 3.282,6 3.562,5 3.856,4 9537,1 28335,5 76589,3
*5487.3 in tax benefit
Exhibits
1
Exhibit 1B: Key metrics of Allergan 2007-2015 source: company annual reports, presentations & SEC 10-K files
*globally: 126 in 2009, 126 in 2010, 392 in 2011, 2000 in 2012 and 3500 in 2013 **global applications: 145 in 2010 and 175 in 2011*** launched globally: 1000 in 2012, 700 in 2013 and 550 in 2014 **** based on year-end average amount of shares outstanding and average share price of year high and low price
Key metrics: 2007 2008 2009 2010 2011 2012 2013 2014 2015
Generics:
# US generic product families 150 150 170 160 160 250 250 250 n.a
# US sales & marketing professionals generic 25 27 21* 21* 22* n.a* n.a* n.a n.a
# new generic product launches 16 11 8 7 16 13*** 6*** n.a*** n.a
# pending approval (ANDA's) 60 60 100 120 130 185 195 200 200
# new filed ANDA's 21 0 36 30** 30** 0
Branded:
# branded product families 27 27 30 30 30 40 45 80 n.a
# US sales & marketing professionals branded 330 380 350 350 400 430 n.a n.a n.a
# new brand product launches 0 1 2 4 3 1 n.a n.a n.a
# pending approval (NDA's) 0 4 7 3 4 7 14 4 9
# new filed NDA's 0 2 2 0 0 0 4 1
Other: # SKU 8000 8000 8000 8500 9960 11450 12725 12650 13200 # suppliers 200 200 200 200 360 260 400 340 340 # of employees 5640 5070 5830 6030 6686 17700 19200 21600 31200 # R&D employees 640 670 850 830 990 2000 1775 2070 3700 # countries active 2 2 20 20 20 60 60 60 100 market cap (x1000)**** $ 3.039,04 $ 2.561,27 $ 3.891,83 $ 5.775,44 $ 8.189,61 $ 10.894,28 $ 21.845,18 $ 52.880,69 $ 103.017,10 enterprise value (x1000)**** $ 3.740,09 $ 2.931,59 $ 5.148,23 $ 6.508,74 $ 9.013,31 $ 17.008,58 $ 30.568,18 $ 68.174,39 $ 144.647,30
2
Exhibit 2A: Allergan M&A activity from 2009-2015
announced Completed company name value transaction details strategic intent
17-06-2009 12-02-2009 Arrow Group
$1.75 billion
$1.05 billion cash + $500 million Watson stock issued + $200 million preferreds
- expand commercial footprint - expanded portfolio of marketed products (minimal portfolio overlap) 25-05-2011
Specifar
Pharmaceuticals
$562
million €400 million cash
- expand commercial presence in Europe (notably in greece) - add pan-european generic development business 24-01-2012
Ascent Pharmahealth
$393
million AU$375 million cash
- expand commercial presence in Southeast Asia - Become #5 generics company in Australia
26-04-2012 02-11-2012 Actavis
$5.5
billion €4.15 billion in cash + €100 million in debt
- dramatically enhances international presence - expanded portfolio & pipeline
23-01-2013 Uteron Pharma
$150 million
$150 million cash + up to $155 in potential future
milestone payments -expands Women's health products
20-05-2013 01-10-2013 Warner Chilcott
$8.5 billion
0.16 shares of the combined company for each Warner Chilcott share.
- expands portfolio and pipeline in core areas of women's health and urology - adds gastroenterology and dermatology to portfolio -Tax savings
18-02-2014 01-07-2014 Forest Laboratories $27.7
billion $20.6 billion in stock + $7.1 billion in cash
- expands and adds to brand portfolio with blockbuster franchices and new therapeutic categories
06-10-2014 17-11-2014
Durata Therapeutics
$675
million $675 million cash + potential milestone payment
- expands emerging Infectious Disease portfolio - Leverages Actavis' sales and marketing capabilities
17-11-2014 17-03-2015 Allergan $66 billion
$129.22 in cash + 0.3683 Actavis share per Allergan share
- Addition and strengthening of branded therapeutic categories - expand commercial presence
26-01-2015 29-05-2015 Auden Mckenzie
$ 495.9 million
$495.9 million in cash and a two year royalty on a % of gross profits for a product
- #1 supplier of generics in the UK and #3 in overall UK pharmaceutical market 17-06-2015 01-10-2015 Kythera Biopharmaceutical s $2.1
billion $2.1 billion cash
- addition to Facial Aesthetics brand portfolio - enhances long-term growth profile
26-07-2015 31-08-2015 Naurex Inc.
$560 million
$460 million cash + $100 million potential milestone payments
- Enhances mental health category development and pipeline 27-07-2015 Pending Divesture of Allergan Generics to Teva Pharma $40.5
billion $33.75 billion cash + $6.75 in Teva shares
- focus on branded therapeutic areas - Divesture of Allergan generics business - raise cash
03-09-2015 19-10-2015 AqueSys Inc.
$300
million $300 million cash + potential milestone payments - Addition to eye care portfolio
23-11-2015 Failed Pfizer
$160
billion 11.3 shares of new co per Allergan share - enhanced growth profile - broadens R&D pipeline
1
Exhibit 2B: Pharma annual M&A deal count & value
Exhibit 2C: Top pharma M&A deals 2015 & 2014
Top Pharma M&A Deals in 2015
Rank Target Acquirer
Completion date Deal value ($bn) 1 Pharmacyclics AbbVie 26-05-2015 20,8 2 Hospira Pfizer 03-09-2015 16 3 Salix Pharmaceuticals Valeant Pharmaceuticals International 01-04-2015 16 4 Pall Danaher 31-08-2015 13,6 5 Synageva Alexion Pharmaceuticals 22-06-2015 8,9 6 Par Pharmaceuticals Endo International 25-09-2015 8,1 7 Receptos Celgene 27-08-2015 7,6 8 NPS Pharmaceuticals Shire 21-02-2015 5,2 9 Auspex Pharmaceuticals Teva Pharmaceutical Industries 05-05-2015 3,5 10 ZS Pharma AstraZeneca 17-12-2015 2,7 Total: 102,4
Top Pharma M&A Deals in 2014
Rank Target Acquirer
Completion date
Deal value ($bn)
1 Forest Laboratories Actavis 01-07-2014 28 2 Intermune Roche 29-09-2014 8,3 3
Questcor
Pharmaceuticals Malinckrodt 14-08-2014 5,6 4 BMS Diabetes Business AstraZeneca 01-02-2014 4,3 5 ViroPharma Shire 24-01-2014 4,2 6 Idenix Pharmaceuticals Merck& Co 05-08-2014 3,9 7 Galderma Nestlé 08-07-2014 3,6 8 Rottapharm Meda 10-10-2014 3,1 9 Algeta Bayer 06-03-2014 2,9 10 Aptalis Holdings Forest Laboratories 03-02-2014 2,9
Total: 66,8
2
Exhibit 3: Evolution of countries active
After Arrow combination
3 After Allergan combination
Sources: Watson Pharmaceuticals annual report and Actavis/Allergan investor presentations
Exhibit 4A: Therapeutic categories evolution
4 Product portfolio per Therapeutic Franchise with Forest Laboratories addition:
Product portfolio per Therapeutic Franchise with Allergan addition:
5
Exhibit 4B: Branded products pipeline evolution
Branded pipeline addition by Warner Chilcott: