Ana Cláudia Monteiro Marques
Licenciada em Biologia- Ramo de Biologia Molecular e Genética
The impact of Bridging Integrator 1 (BIN1)
rare coding mutations on the development
of Late-Onset Alzheimer’s Disease
Dissertação para obtenção do Grau de Mestre emGenética Molecular e Biomedicina
Orientador: Cláudia Guimas de Almeida Gomes
Investigadora Principal no Centro de Estudos de Doenças
Crónicas (CEDOC)
Júri:
Presidente: Doutora Margarida Castro Caldas Braga Arguente: Doutora Ana Sofia Falcão
Vogal: Doutora Cláudia Guimas de Almeida Gomes
Setembro de 2018
Universidade Nova de Lisboa
Faculdade de Ciências e Tecnologia
Departamento de Ciências da Vida
Ana Cláudia Monteiro Marques
Licenciada em Biologia- Ramo de Biologia Molecular e Genética
The impact of Bridging Integrator 1 (BIN1)
rare coding mutations on the development
of Late-Onset Alzheimer’s Disease
Dissertação para obtenção do Grau de Mestre emGenética Molecular e Biomedicina
Orientador: Cláudia Guimas de Almeida Gomes
Investigadora Principal no Centro de Estudos de Doenças
Crónicas (CEDOC)
Setembro 2018
i
The impact of Bridging Integrator 1 (BIN1) rare coding mutations on the development of Late-Onset Alzheimer’s Disease
Copyright © Ana Cláudia Monteiro Marques, Faculdade de Ciências e Tecnologia, Universidade Nova de Lisboa.
A Faculdade de Ciências e Tecnologia e a Universidade Nova de Lisboa têm o direito, perpétuo e sem limites geográficos, de arquivar e publicar esta dissertação através de exemplares impressos reproduzidos em papel ou de forma digital, ou por qualquer outro meio conhecido ou que venha a ser inventado, e de a divulgar através de repositórios científicos e de admitir a sua cópia e distribuição com objectivos educacionais ou de investigação, não comerciais, desde que seja dado crédito ao autor e editor.
iii
v
Acknowledgments
Para começar gostaria de agradecer à minha orientadora Cláudia Almeida por ter reconhecido o meu fascínio pelas neurociências e me ter aceite no grupo dela. No teu grupo senti que podia procurar a resposta para qualquer questão que me despertasse a curiosidade, dentro do racional é claro. Senti realmente que o único limite era aquele ao qual a nossa imaginação nos levava e que desde que sejamos empreendedores as barreiras são apenas meras oportunidades para nos ultrapassarmos. Obrigada por me teres integrado como um verdadeiro membro do laboratório e me teres mostrado sem reservas como tudo funciona. Agradeço ainda por me mostrares que com transparência e humildade todo o caminho é mais fácil.
Quero também agradecer às minhas colegas e mentoras Tatiana Burrinha, Farzané Mirfakhar, Catarina Perdigão e Inês Figueira.
Tatiana muito obrigada por toda a paciência que tiveste ao me ensinar todas as técnicas, mesmo nas alturas em que o trabalho era mais do que as horas do dia. Obrigada também por me apoiares sempre, pelos conselhos, e acima de tudo por me fazeres ver que o que eu muitas vezes achava que eram montanhas eram na realidade apenas lombas.
Catarina minha professora das “molecularices” muito obrigada por toda a ajuda e por coordenares o teu calendário preenchido com o meu de modo a eu poder aprender o máximo possível.
Inês, apesar de termos passado pouco tempo juntas a tua ajuda foi imprescindível. Obrigada por toda a alegria e cor que trouxeste contigo.
And last but not least, Farzané thank you very much for all your support and for teaching me not to stress about mistakes already made and things I cannot control. Thank you for all our talks and for sharing your knowledge and different perspectives on life, thanks to you I felt more understood and less alone.
To all four girls I know that karma will repay all your kindness and the patience you had with me, for which I am truly beyond grateful.
Um obrigada grande também às minhas colegas de trabalho. Apesar de não compreenderem bem este lado da minha vida sempre se esforçaram para o perceber e sempre me apoiaram com um inegável carinho. Conjugar o trabalho com a tese não foi nada fácil, mas convosco foi sem dúvida mais feliz. Por todos os “fechos” repletos de tolices e risos, 313 sempre.
Mónica Lopes, minha companheira do dia 1, obrigada por me inspirares a tentar ser uma versão melhor de mim. O teu sorriso permanente foi uma fonte de força constante.
Vanessa Correia obrigada por me ouvires, compreenderes e apoiares. Ouvir a tua perspectiva ajudou-me a manter a sanidade nas alturas mais difíceis.
Anaísa Sena a ti tenho de agradecer o desencaminhamento. Antes de começarmos a falar eu era uma pessoa que estava a rodar 6 pratos ao mesmo tempo. Graças a ti fui introduzida a uma nova cultura e os pratos caíram ao chão. Estou grata por isso, pois não sou sobre-humana e precisava de me re-focar de modo a terminar a maratona. Obrigada ainda por te revoltares comigo, e por tanta felicidade, foi mais do que essencial.
vi
À minha família do Teatro Contra-Senso muito obrigada. Ter feito uma peça no meio de tudo o resto foi sem dúvida um desafio, mas como sempre um que me encheu o coração e a alma. O vosso apoio foi imprescindível e como sempre foi um prazer ter partilhado o palco convosco.
André Santos não podia deixar de te agradecer em particular. A tua fé inabalável em mim e nas minhas capacidades inspiraram-me a nunca desistir e a enfrentar cada desafio com a crença de que a vitória era mais do que possível. Obrigada por todo o carinho.
Ao André Amorim, obrigada por estares comigo desde o dia 1 de tantas aventuras. Ouvir as tuas histórias, tão excepcionalmente bem contadas, garantiram-me momentos de gargalhadas incontroláveis. Continuas a ser bem descrito pela palavra “especial”.
À Joana Silva, minha companheira trans-Tejo, muito obrigada por estares lá durante todo o percurso. Obrigada por me compreenderes a 100% e eu só espero que tenhamos muitos mais momentos de partilha das peripécias, seguidas de risos. Que todas as pedras sirvam para construir um caminho melhor.
Ao João Silva obrigada por estares sempre lá sem qualquer hesitação e a qualquer momento. Provavelmente devo-te uns óculos por todos os longos textos que te fiz ler, mas tu sempre foste capaz de me ouvir e de me pôr um sorriso nos lábios. A vida contigo é mais fácil. Muito obrigada
À madrinha que a Faculdade de Ciências me deu, Sofia Silva, devo um enorme agradecimento. Obrigada por ouvires todos os meus desabafos e por me fazeres sempre sentir compreendida e apoiada. Estes desafios não foram fáceis, mas contigo ao meu lado foram certamente mais leves. Mil vidas não chegavam para te agradecer por tudo.
À minha família, obrigada não apenas pelo vosso amor e apoio durante esta fase, mas durante todos os momentos da minha existência. Se pudesse escolher não escolheria uma diferente, porque pessoas com corações maiores do que vocês, não encontraria. Amo-vos mais do que tudo.
Em último deixo o agradecimento mais importante. À minha mãe. Palavras nunca seriam suficientes para agradecer tudo o que fizeste por mim toda a minha vida. O mais importante neste momento é agradecer-te por nunca me deixares desistir e por apoiares todos os meus sonhos incondicionalmente. Sem ti mãe, eu não era nada.
vii
Abstract
Late-onset Alzheimer’s Disease (LOAD) is the most common cause of dementia. AD is characterized by the presence of neurofibrillary tangles and of amyloid plaques, mainly composed of β-amyloid peptides (Aβ). Aβ is generated intracellularly at early endosomes through the sequential cleavage of the amyloid precursor protein (APP) by two proteases, β-secretase (BACE1) and γ-secretase. This process is dependent on both APP and BACE1 endocytic trafficking. The Aβ peptide especially its longer form (Aβ42), is synaptotoxic.
Bridging integrator 1 (BIN1), an endocytic trafficking regulator, was identified through large genome-wide association studies to be the second-most prevalent genetic risk factor for LOAD, with the P318L and K358R mutations in BIN1 having been found in increased frequency amongst AD patients. Moreover, BIN1 knockdown was found to increase Aβ42 generation by accumulating BACE1 at early endosomes. However, how two BIN1 coding mutations lead to AD remains unknown. We hypothesized that these BIN1 mutations alter Aβ homeostasis, thus contributing to the development of LOAD.
Expression of BIN1 P318L, but not of BIN1 K358R, led to an increase in total BIN1, suggesting that the first mutation increases BIN1 gene expression. Moreover, over-expression of mutant BIN1 not only increased Aβ42 accumulation but also altered the site of Aβ42 accumulation. We started investigating the mechanisms involved and found early endosomes with reduced levels of EEA1, a marker of early endosomes, in cells overexpressing BIN1 mutants. Finally, we found increased levels of BACE1 in cells overexpressing P318L, but decreased in cells overexpressing K358R, which suggests that they contribute to the development of AD through different pathways.
In conclusion, our research demonstrates that these SNPs do alter BIN1’s normal functioning and lead to Aβ dyshomeostasis, the predominant model of AD pathogenesis. Nonetheless, the specific pathways whereby these mutations impact the production and/or clearance of Aβ42 still require further investigating.
Keywords: Alzheimer’s disease, Bridging Integrator 1 (BIN1), Amyloid β (Aβ), amyloid precursor protein (APP), BACE1, intracellular trafficking.
ix
Resumo
A doença de Alzheimer esporádica (DAE) é a causa mais comum de demência, sendo caracterizada pela presença de tranças neurofibrilares e de placas senis, compostas principalmente por β-amilóide (Aβ).
A Aβ é gerada intracelularmente nos endossomas iniciais pela clivagem da
proteína percursora amilóide (APP) por duas protéases: β-secretase (BACE1) e γ-secretase.
Este processo depende do tráfego intracelular destas proteínas. A Aβ, especialmente a sua maior
forma (Aβ42), é sinaptotóxica.
O Bridging Integrator 1 (BIN1) é um regulador do tráfego endocítico, identificado por
estudos de associação genómicos como o segundo principal fator de risco genético para DAE.
O silenciamento do BIN1 aumenta a geração de Aβ42 devido à acumulação de BACE1 nos
endossomas iniciais. As mutações P318L e K358R no BIN1 foram encontradas em elevada
frequência entre pacientes com DAE, no entanto, o modo como estas mutações provocam esta
doença é desconhecido. A nossa hipótese é que estas alteram a homeostase da Aβ, levando
assim ao desenvolvimento da doença.
A expressão da P318L aumentou o BIN1 total, sugerindo que esta mutação aumenta a
expressão do gene. A sobreexpressão dos mutantes aumentou a acumulação de Aβ42 e alterou
a localização desta acumulação. Uma investigação inicial dos mecanismos envolvidos
demonstrou níveis reduzidos de EEA1 nos endossomas iniciais das células a sobreexpressar os
mutantes. Por fim, vimos um aumento dos níveis da BACE1 nas células a sobreexpressar
P318L, mas um nível diminuído nas que sobreexpressavam K358R, o que pode significar que
estas mutações contribuem para o desenvolvimento de DA através de vias diferentes.
Concluindo, a nossa pesquisa demonstra que estas mutações alteram o funcionamento
normal do BIN1, levando à dishomeostase da Aβ. Esta dishomeostase é o modelo predominante
da patogénese da DA. Ainda assim, as vias especificas através das quais a produção e/ou
eliminação da Aβ42 está a ser afetada necessita de investigação adicional.
Palavras-chave: Doença de Alzheimer, Bridging Integrator 1 (BIN1), β-amilóide (Aβ),
xi
Index
Acknowledgments ... v Abstract ... vii Resumo ... ix Abbreviations ... xv I. Introduction ... 1 1. The discovery of AD ... 1 2. AD pathology ... 2 3. APP processing... 3 4. Endosomes ... 4 5. Amyloid hypothesis ... 5 6. Genetics of AD ... 67. Bridging integrator 1 (BIN1) ... 7
8. Stepping stones for this thesis ... 8
9. Objective of this study ... 9
II. Materials and methods ... 11
1. Cell Culture ... 11
2. DNA amplification ... 11
3. Plasmid DNA preparation ... 12
4. Transient plasmid transfection ... 12
5. Fluorescence microscopy ... 14
6. Single cell quantitative analysis ... 15
7. Immunobloting ... 16
III. Results ... 19
1. The impact of AD variants on BIN1 expression ... 19
2. Impact of BIN1 mutant overexpression on Aβ42 levels ... 21
3. BIN1 mutants do not rescue the increase in Aβ42 levels caused by knockdown of BIN1 ... 23
4. Impact of BIN1 mutants on Aβ42 perinuclear accumulation ... 26
5. Impact of BIN1 mutants on perinuclear actin ... 26
6. BIN1 mutant’s effect in endosomes ... 28
7. BACE1 levels in cells overexpressing BIN1 mutants ... 30
8. Alterations in APP processing ... 32
xii
V. Conclusion and Future perspectives ... 41 VI. References ... 43
xiii
Index of Figures
I. Introduction ... 1
Figure I.1- Neuropathological features of the AD brain ... 3
Figure I.2- APP processing through the non-amyloidogenic and the amyloidogenic pathways. ... 4
Figure I.3- Model for the role of BIN1 in Aβ endocytic generation in early endosomes ... 9
III. Results ... 19
Figure III.1- BIN1 expression levels in cells overexpressing BIN1 wt and BIN1 mutants P318L and K358R. ... 21
Figure III.2- Overexpression of BIN1 mutants P318L and K358R increases Aβ42 levels ... 23
Figure III.3- BIN1 mutants do not rescue Aβ42 levels caused by BIN1 knockdown. ... 25
Figure III.4- Perinuclear actin and Aβ42 levels in N2a cells overexpressing BIN1 wt, BIN1 P318L and BIN1 K358R... 28
Figure III.5- Effect of BIN1 wt and BIN1 mutants in early endosome number, size and intensity. ... 30
Figure III.6- BACE1 levels in cells overexpressing BIN1 wt, BIN1 P318L and BIN1 K358R. ... 31
xiv
Index of Tables
II. Materials and methods………..…….………...11
Table II.1- Plasmids. ... 13
Table II.2- Oligonucleotides... 14
Table II.3- Primary antibodies. ... 15
Table II.4- Secondary antibodies and probes. ... 15
xv
Abbreviations
AD Alzheimer’s Disease
AICD APP intracellular domain
ANOVA Analysis of Variance
AP-2 Adaptor Protein-2
APP Amyloid precursor protein
APPsα Soluble APP cleaved by α-secretase
APPsβ Soluble APP cleaved by β-secretase
Aβ Amyloid β
Aβ40 Amyloid β (40 amino acids)
Aβ42 Amyloid β (42 amino acids)
BACE1 β-site APP-cleaving enzyme 1
BAR BIN-Amphiphysin-Rvs
BIN1 Bridging Integrator 1
cDNA complementary DNA
CLAP Clathrin-Adaptor Protein
CO2 Carbon dioxide
CTF Carboxyl-terminal fragment
EEA1 Early endosomal antigen 1
ELISA Enzyme-Linked Immunosorbent Assay
EOAD Early-onset AD
FBS Fetal bovine serum
GFP Green Fluorescence Protein
GTP Guanosine triphosphate
GWAS Genome Wide Association Studies
HRP Horseradish peroxidase
IF Immunofluorescence
LAMP1 Lysosomal-associated membrane protein 1
LB Luria Bertani (medium)
LOAD Late-onset AD
mRNA Messenger ribonucleic acid
N2a Neuro 2a
PBS Phosphate buffered saline
xvi
RNAi RNA-mediated interference
SDS Sodium dodecyl sulfate
SEM Standard Error of the Mean
SH3 Src homology 3
siRNA Small interference RNA
SNP Single nucleotide polymorphism
WB Western Blot
α-CTF α-carboxyl-terminal fragment
1
I.
Introduction
1. The discovery of AD
In November 1901 Alois Alzheimer described the symptoms he had observed in a patient committed at the time to the Frankfurt Psychiatric Hospital, Auguste Deter (Hippius, 1998). This 51 year-old-woman displayed paranoid characteristics, with auditory hallucinations and aggressiveness, as well as disorientation not only in space but also in time. Soon after her internment to the hospital she started developing rapid memory loss until this symptom was so severe that it impeded her speaking ability and her recollection of how to use certain objects. Despite all these symptoms most of her motor skills, like her walk and the use of her hands, remained unaffected (Stelzma et al., 1995; Hippius, 1998).
This patient passed away four and a half years after her arrival at the psychiatric hospital. At the time of her passing she was completely bedridden. At this point Alzheimer was able to perform an autopsy with the objective of trying to find the cause for the symptomatology exhibited. He examined the brain both morphologically as well as histologically (Stelzma et al., 1995).
Macroscopically the first thing he observed was that the brain was evenly atrophied, meaning that there were no specific focal areas of degeneration. Alzheimer’s histological observation was made utilizing Bielschosky’s silver method which had been improved from the previous method developed by Ramon Y Cajal (Uchihara, 2007). Through this method he saw that approximately 1/3 of all the cortex neurons presented specific changes in the form of one or more fibrils. These neurofibrils were easily identified due to their thickness and capacity for impregnating the dye (Stelzma et al., 1995). Alzheimer’s descriptions of his observations correspond to what is now known as neurofibrillary tangles and amyloid plaques.
Even though the connection that this doctor made between the clinical symptoms and the histological observations were something never before seen, there was a huge lack of response as it was still a very rare disease (Hippius, 1998). In the end of his publication, Alzheimer noted that there was an increasing number of similar cases emerging and that this fact should encourage psychiatrists to try and discover new psychiatric illnesses instead of only noting the ones already in textbooks. Additionally, he also mentions the importance of histological examinations, as a way to further characterize these diseases (Stelzma et al., 1995).
In 1911 Alzheimer published about another patient, Josef F., diagnosed as having the condition already named Alzheimer’s disease (AD). This patient further expanded the knowledge of this condition because the histological examination showed only the presence of plaques but not of neurofibrillary tangles. This finding was very contradictory at the time since two different observations were being
2
classed as belonging to the same disease (Hippius, 1998). In 1995 the brain slide preparations of Auguste D. and Josef F. were re-examined with more modern techniques and it was concluded that cases presenting only plaques and cases with both plaques and tangles corresponded to different stages in the disease progression (Graeber et al., 1997). This means that not only did Alois Alzheimer first discover the disease, but that he also noted that there were different development stages with the deposition of plaques occurring in an earlier stage than the emergence of neurofibrillary tangles.
2. AD pathology
Affecting over 40 million patients worldwide, AD which was virtually unknown to the general population, is now recognized as the most common dementia in the elderly (Selkoe and Hardy, 2016). Dementia is the clinical term used when referring to progressive cognitive decline which leads to an inability to perform normal day-to-day activities (O’Brien and Wong, 2011).
The true number of people affected by this condition isn’t known, not only due to the fact that the disease actually begins in the brain nearly three decades before diagnosis is even possible (Selkoe and Hardy, 2016), but also due to the challenge of diagnosis itself since differentiating between AD and cognitive decline related with normal aging may be difficult. In fact dementia affects 1 out of 3 elderly individuals (O’Brien and Wong, 2011). Nonetheless, it is estimated that by 2050 the number of AD patients worldwide may reach approximately 144 million (Gomez-Ramirez and Wu, 2014).
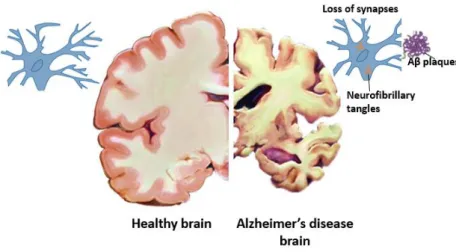
Like Alois Alzheimer had firstly identified, this complex multifactorial syndrome is characterized by the presence of two distinct brain pathologies: neuritic plaques, composed mostly of amyloid β (Aβ) peptides, which are a chain of most commonly 40-42 amino acids (Masters et al., 1985), surrounded by dystrophic neuronal processes (O’Brien and Wong, 2011) and neurofibrillary tangles which consist of intracellular, hyperphosphorylated and cleaved forms of tau (Iqbal and Grundke-Iqbal, 2008) (Figure I.1). Tau is a heat stable protein essential for microtubule assembly and stabilization (Weingarten et al., 1975). When tau protein is misfolded due to these abnormal modifications, it dissociates from microtubules and aggregates in bundles of filaments (Iqbal et al., 2010).
3
Figure I.1- Neuropathological features of the AD brain. Comparison between the normal brain (left side) and neurons to the pathological alterations that occur due to AD (right side: neurofibrillary tangles, neuritic plaques and general brain atrophy). Image adapted from Congdon and Sigurdsson, 2018.
The progressive buildup of protein aggregates in various systemic organs has been named as the cause for numerous other neurodegenerative diseases like Parkinson’s disease and Creutzfeldt–Jakob disease (Lee et al., 2011). The predominant model of AD pathogenesis is the amyloid (or Aβ) hypothesis in which it is proposed that this illness is initiated by Aβ dyshomeostasis (Hardy et al., 1992), whether due to an excess in its production or a defect in its clearance. One aspect that supports this hypothesis is the observation that Aβ generation and deposition in humans precedes the accumulation of neurofibrillary tangles (Bateman et al., 2012), whereas mutations in the tau gene were not seen to lead to Aβ accumulation (Lewis et al., 2001). This implies that while the increase of Aβ possibly leads to progressive tau deposition, the opposite does not occur, thus further supporting the amyloid hypothesis.
3. APP processing
Amyloid precursor protein (APP) is a ubiquitous membrane protein synthesized in the endoplasmic reticulum (ER). Similarly to other membrane proteins, a fraction of the APP produced is transported to the cell surface via the secretory pathway, while some is directed to an endosomal compartment (O’Brien and Wong, 2011; Rajendran and Annaert, 2012).
APP’s physiological function is not fully known, however, when transiently transfecting cell lines with APP, it was seen that this protein is able to modulate cell motility and growth, as well as neurite growth and cell survival (Thinakaran and Koo, 2008).
This ubiquitous protein is abundantly produced in neurons and as such it is metabolized rapidly through several proteolysis pathways (O’Brien and Wong, 2011). One of these metabolization pathways is the sequential cleavage by two amyloidogenic proteases: β-secretase and γ-secretase. This process leads to the generation of Aβ and is known as the amyloidogenic pathway. Cleavage by these secretases occurs not only in people with AD but also, in reduced amounts, in the physiological state. However, the main processing pathway of APP involves a different protease: α-secretase. Cleavage by α-secretase
4
followed by processing by γ-secretase does not lead to the formation of Aβ peptides and is thus known as the non-amyloidogenic pathway. This occurs because the cleaving location of α-secretase is within the normal sequence of Aβ, therefore not allowing its production (O’Brien and Wong, 2011) (Figure I.2). Aβ peptide size varies from 38 to 43 amino acids, depending on γ-secretase cleavage site, with the 40 and 42 amino acids types being the most common and reported (Rajendran and Annaert, 2012).
One of the factors that dictates which pathway is taken has to do with the location of APP. Proteolysis by α-secretase occurs mainly on the cell surface, while the neuronal β-secretase (BACE1) is primarily localized to endosomal compartments and therefore this is where the formation of most of the Aβ protein happens (O’Brien and Wong, 2011). This means that any factor that disrupts the normal trafficking of APP, increasing the time it spends in either of these cellular locations, or the amount of protein being sent there, benefits either the amyloidogenic of the non-amyloidogenic pathway.
Figure I.2- APP processing through the non-amyloidogenic and the amyloidogenic pathways.
Metabolization of the APP protein in the physiological state mainly involves its cleavage by α-secretase in the cellular membrane leading to the formation of α-CTFs, which will be further cleaved by γ-secretase in early endosomes resulting in the production of the AICD fragment. This is known as the non-amyloidogenic pathway, however, in smaller portions, APP can be firstly cleaved by β-secretase (BACE1) in the cell membrane, resulting in β-CTFs, and then by γ-secretase. This last cleavage step is the one which results in the production of Aβ.
4. Endosomes
Endosomes are cellular organelles responsible for the sorting of membrane-associated proteins (Weering and Cullen, 2014). Even though both BACE1 and APP are transported from the cell membrane to early endosomes, they use different routes, with APP being internalized in a clathrin-dependent way while BACE1’s internalization involves GTPases (Chia et al., 2013). This segregation between APP and BACE1 is partly responsible for limiting the amount of Aβ that is normally produced. Another
5
factor that might limit BACE1 cleaving activity to endosomes is that its proteolytic activity is optimal at a slightly acidic pH, making the endosomal environment optimal for this process (Morel et al., 2014).
Early endosomes, as the name suggests, are the first endocytic compartment to accept cargo derived from the plasma membrane, beginning process known as early-to-late endosome maturation (Scott et al., 2014). This is the process that ultimately results in the sorting of different proteins and lipids, through several different trafficking routes (Weering and Cullen, 2014). In some cases, like with APP, the endosomal maturation process proceeds until components are ultimately sent for degradation in the lysosome, while in others there can be a retrieval of cargoes, which are then sent to the biosynthetic pathway in the trans-Golgi network, or recycled back to the cellular membrane, as is the instance for BACE1 (Morel et al., 2014; Weering and Cullen, 2014).
5. Amyloid hypothesis
The hypothesis that the pathological processes that ultimately lead to AD starts by a dishomeostasis of the Aβ protein is known as the amyloid hypothesis. This theory is supported by the fact that mutations in presenilin 1 or 2, the catalytic subunits of γ-secretase, are the most common cause of early-onset AD (EOAD), also known as familiar AD, which affects people under the age of 65 (Selkoe and Hardy, 2016). This type of AD is also commonly correlated with mutations in the APP gene, most of which are located near the γ-secretase cleavage site (O’Brien and Wong, 2011; Selkoe and Hardy, 2016), however, the most well-known APP mutation is next to the BACE1 cleavage site (APP-swe) (O’Brien and Wong, 2011). Both presenilin and APP mutations lead to an increase in total Aβ or to an increase in the Aβ42/Aβ40 ratio. Increasing the ratio between Aβ42 and Aβ40 boosts plaque formation since the Aβ42 peptide is more synaptotoxic due to it being more hydrophobic and prone to aggregation, which ultimately results in more Aβ deposition (Peric and Annaert, 2015; Selkoe and Hardy, 2016).
One important factor to mention is the toxicity of the Aβ peptide. This toxicity was well demonstrated in neuronal cultures derived from the hippocampus to which medium containing Aβ was added. This increase in extracellular Aβ led to neuronal degeneration after 24 hours, with complete neuronal loss within 48 to 72 hours (Yankner et al., 1989). Regarding in vivo experiments, 4 to 6 month mice overexpressing mutant human APP showed a deposition of Aβ, and consequently presented with neuronal injuries (Shankar et al., 2008).
In the beginning of the study of AD, and still to this day, some investigators raise questions as to which is the most important and impactful protein: Aβ or tau? What is however important to note is that Aβ has been shown to control both cleavage (Chung et al., 2001) and phosphorylation (Hernández and Avila, 2008) of tau through its ability to activate some of the caspases and kinases involved in this process. As previously mentioned this is important because it is this form of the tau protein that
6
composes the neurofibrillary tangles. Reduction of Aβ levels through immunotherapy was shown to prevent tau pathology (Billings et al., 2005).
6. Genetics of AD
The most frequent type of AD is known as late-onset AD (LOAD), due to the fact that its onset occurs after 65 years of age. Unlike EOAD, LOAD is sporadic and not caused solely by genetic mutations that result in fully penetrant AD. Nonetheless, it is estimated that LOAD is 50% to 70% caused by some genetic factor or by a combination of genetic components (O’Brien and Wong, 2011).
LOAD is usually correlated with either an imbalance in the Aβ42/Aβ40 ratio or with a decrease in Aβ clearance. There are a few identified causal factors related with this disease including the best-known apolipoprotein E4 (ApoE4) allele, which was first discovered in 1993 (Corder et al., 1993). The APOE gene has three different variants which encode for the ApoE2, ApoE3 and ApoE4 proteins. ApoE protein has several physiological roles, including its ability to bind Aβ (Tiraboschi et al., 2004). Unlike the other two forms of the protein, ApoE4 is not able to tightly bind Aβ (Tokuda et al., 2000) and this is one of the reasons why heterozygous carriers of this allele (people who only carry one copy of it) have a threefold increase in their risk of developing AD. Homozygous carriers of this gene are 15 times more likely of developing this illness (O’Brien and Wong, 2011). Individuals who carry this allele have a decrease in the clearance of Aβ, which in turn promotes its aggregation leading to an increased risk for AD (Selkoe and Hardy, 2016). Other loci reported to increase the risk for LOAD are much weaker in effect (Lambert et al, 2013) or much rarer (Guerreiro et al, 2013; Jonsson et al, 2013).
Large genome-wide association studies (GWAS) (Feero et al., 2010) have identified nine other genes/loci associated with an increase in the genetic risk for LOAD (Tan et al., 2013). Some of these are involved in the regulation of endosomal recycling, as is the case for sortilin-related receptor 1 (SorL1), CD2-associated protein (CD2AP), phosphatidylinositol binding clathrin assembly protein (PICALM) and bridging integrator 1 (BIN1) (Cormont et al., 2003; Andersen et al., 2006; Pant et al., 2009; Kanatsu et al., 2014). SORL1 has been shown to be involved in the processing of APP (Andersen et al., 2006), preventing the interaction between this protein and BACE1 by promoting the transport of APP from endosomes, where this interaction occurs, to the Golgi (O’Brien and Wong, 2011). This means that a reduction of SorL1 potentiates Aβ production. PICALM seems to be involved directly in endosomal APP processing (Kanatsu et al., 2014) and has been implicated in the transport of brain Aβ across the blood-brain barrier (Zhao et al., 2016). This means that a decrease in PICALM levels should lead to a defect in Aβ clearance, thereby leading to a higher change of developing AD. However, it was also seen that due to PICALM’s role in the endocytosis of γ-secretase, its loss leads to a shift in the location of this protease, which then results in a decrease in production of Aβ42 (Kanatsu et al., 2014).
7
Bridging integrator 1 (BIN1) and CD2AP are two other proteins that present as possible risk factors for AD development, however their involvement in the pathways leading to AD isn’t as well-known as some of the other risk factors (Tan et al., 2013).
7. Bridging integrator 1 (BIN1)
BIN1 also known as amphiphysin 2 is encoded on chromosome 2q14.3 and its transcripts suffer differential splicing according to tissue distribution. There are ten different BIN1 isoforms, being that seven of them are brain specific, one expressed in the skeletal muscles and the final two are ubiquitous forms. The fact that there are numerous variants of this protein is suggestive of a likelihood of several different physiological functions (Tan et al., 2013). BIN1 was initially characterized for its function as a tumor suppressor, seeing as it is a crucial member of the pathways leading to a caspase-independent cell death similar to apoptosis (Elliott et al., 2000).
Despite the existence of different forms of this protein, most of them have in common an N-terminal BAR domain, a Myc-interacting domain and a C-Terminal SH3 domain. The brain variants also include a very interesting domain, the clathrin-AP2 binding domain (CLAP) which mediates the interaction between clathrin and AP2/α-adaptin (Tan et al., 2013). The BAR domain has the ability of binding lipid membranes and inducing membrane curvature, thus enabling this protein to intervene in cellular trafficking events. This domain is part not only of BIN1 but also of other different proteins (Ren et al., 2006). Besides its role in regulating the shape of membranes, the BAR domain also interacts directly with actin-binding proteins and with actin filaments themselves. Human BIN1, specifically, was seen to not only interact directly with actin filaments but to also be sufficient for F-actin binding, contributing to the stabilization of this protein, all of this mediated through the BAR domain of this protein (Dräger et al., 2017). Interaction with actin could grant BIN1 not only an involvement in cell morphogenesis, but also another pathway for its involvement in controlling trafficking events.
Evidence regarding BIN1’s involvement in AD includes a correlation between higher levels of BIN1 expression and a shorter disease duration, as well as a later age for its onset (Karch et al., 2012). A possible connection between a higher expression of this protein and tau pathology has also been suggested (Chapuis et al., 2013), due to the fact that BIN1 appears to have the ability of linking the microtubule cytoskeleton to the cellular membrane (Meunier et al., 2009; Tan et al., 2013).
Given that BIN1 has been implicated as having an involvement in endosome trafficking, due to the BAR-domain’s ability to not only sense membrane curvature but also to induce it (Ren et al., 2006), and in clathrin-mediated endocytosis (Pant et al., 2009), it is an appealing thought that this protein could be involved in one of the trafficking processes that lead to the production or clearance of Aβ.
8
The first time that the BIN1 gene was identified as possibly impacting the risk of an individual developing AD was through GWAS in the Genetic and Environment Risk in AD Consortium 1 study (Harold et al., 2009). This protein is in fact named as the second-most prevalent genetic risk factor for LOAD, with only APOE preceding it (Calafate et al., 2016). Several BIN1 SNPs have been associated to a higher risk of AD development, however the difficulty of these studies lies in the replication of the results amongst different ethnicities (Tan et al., 2013).
It is more likely that LOAD results from a combination of the effect of different gene variations, as well as environmental factors, and not just from the effect of a single polymorphism (SNP), however the study of individual SNPs is very important because it will grant us a larger understanding of the processes and pathways involved in the development of this disease.
There is also some suggestion that BIN1 could suffer epigenetic modifications, specifically in its CpG promoter island, which could affect its expression (Tan et al., 2013). This would create a disturbance in normal trafficking events, therefore would propitiating AD development. In fact methylation in this specific site was observed both in breast and in prostate cancer (Kuznetsova et al., 2007).
Epigenetic alterations refer to modifications that are, like the name suggests, “above genetics”. These are changes in the chromatin structure which do not result from alterations to the DNA sequence itself, and that can be transmitted to daughter cells. These modifications can include changes in DNA methylation or histone modifications, which can affect the transcription of genes (Berger et al., 2009). Since altered levels of BIN1 expression ,which could not be explained simply through sequence variation in the BIN1 locus, have been observed in normal aging as well as in AD brains, (Allen et al., 2012), epigenetic alterations could offer an explanation for this occurrence. It is also important to note that some SNPs, especially non-coding ones, could be responsible for altering DNA methylation patterns or histone marks (Zaina et al., 2010).
8. Stepping stones for this thesis
Recently, with the objective of better understanding the impact of BIN1 in Aβ production, a knockdown approach was used, resulting in novel mechanistic findings as to this protein’s function. This study not only saw that BIN1 depletion led to an increase in Aβ42 specifically in axons, but also that this increase was due to an impairment in BACE1’s recycling to the cell membrane (Ubelmann et al., 2017).
In order for recycling to occur, tubular structures are formed, which afterwards will be cleaved and separated from endosomes. These structures are continuously formed, with one endosome being
9
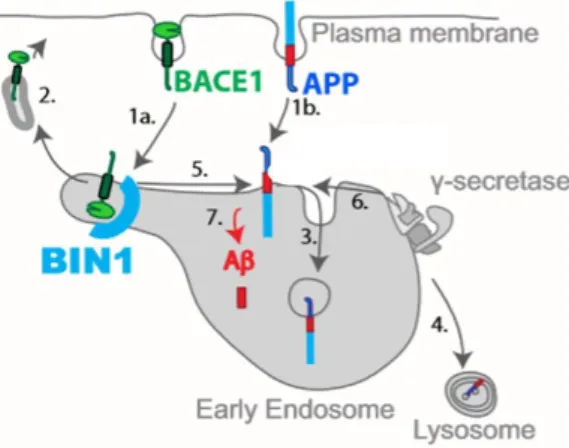
able to originate several distinct tubules, that are then responsible for transporting the cargo back to the membrane (Weering and Cullen, 2014). Upon BIN1 knockdown, the number and length of BACE1 tubules was seen to increase, however these carriers stayed stably attached to early endosomes instead of leading to the release of this protease (Ubelmann et al., 2017). Since BACE1 is staying in early endosomes for a longer period than what happens in the normal physiological state, it remains colocalized with APP thus leading to an increase in processing and to more Aβ generation (Figure I.3).
Figure I.3- Model for the role of BIN1 in Aβ endocytic generation in early endosomes. Normal APP and BACE1 endocytic trafficking diverge at early endosomes restricting Aβ generation. (1a) BACE1 endocytosis. (1b) APP endocytosis. (2) BACE1 recycling to the plasma membrane. (3) APP sorting to intraluminal vesicles. (4) APP delivery to the lysosome for degradation. (5) BACE1 cleavage of APP. (6) γ-secretase cleavage of APP-CTF. (7) Aβ generation. BIN1 is involved in BACE1 recycling to the plasma membrane, with its knockdown decreasing recycling and increasing Aβ production due to a longer co-localization time between APP and BACE1. Image adapted from Ubelmann et al., 2017.
9. Objective of this study
Although BIN1 is the second-most prevalent risk factor for the development of AD, the mechanisms whereby this occurs are not well established. Recently, BIN1 knockdown (Ubelmann et al., 2017) as well as its overexpression (Burrinha, 2014), were seen to lead to Aβ42 accumulation. BIN1’s involvement in BACE1’s recycling from early endosomes to the cellular membrane (Ubelmann et al., 2017) could be the mechanism involved in controlling the amount of Aβ42 produced, eventually leading to the development of AD.
P318L and K358R are two rare BIN1 coding mutations which have been found to be increased in frequency amongst AD patients (Tan et al., 2014; Vardarajan et al., 2015). P318L refers to the missense mutation in exon 11 found in Han Chinese individuals, which results in a proline to a leucine change. The change of this one deoxynucleoside (T/C) was predicted to alter BIN1’s structure, affecting its function in a harmful manner (Tan et al., 2014). K358R is another nonsynonymous mutation which was found to be in high frequency in LOAD cases in the Caribbean Hispanic population. This BIN1
10
mutation leads to a change from the amino-acid lysine to arginine and is predicted to be possibly deleterious (Vardarajan et al., 2015).
With the objective of better understanding the impact that variants discovered in AD patients have, and through which processes they can lead to this disease, we decided to investigate the effects of these two coding mutations, P318L and K358R. We looked at BIN1 expression, Aβ accumulation, APP processing and searched for effects on early endosomes, to try and determine by which mechanisms these mutations are able to affect BIN1’s normal functioning.
As such, the goal of this thesis is to assess the ability of SNPs in altering normal cell functioning and in ultimately leading to changes that could cumulate in the pathologies observed in patients with AD. In order to do so, we used both overexpression and knockdown followed by rescuing techniques in the Neuro2A (N2a) cell line which is derived from mouse neuroblastoma cells. This is a highly relevant neuronal like model and the most practical cellular system to study AD and its fundamental molecular mechanisms (Provost, 2010).
Throughout this research we will try to unveil the effects of the BIN1 mutants P318L and K358R by trying to answer some questions regarding the effect of their expression in N2a cells:
1. Do these mutations alter Aβ homeostasis? 2. If so, is there an effect in APP processing?
3. Does the expression of the mutant proteins affect actin distribution? 4. Are there any observable alterations in early endosomes?
In addition to determining whether variants of BIN1 can alone lead to AD, the ultimate goal and purpose of this work is to better understand the trafficking mechanisms through which this protein contributes to the development of this neurodegenerative disease.
11
II.
Materials and methods
1. Cell Culture
The Neuro2A (N2a) cell line is derived from the mouse neural-crest and has been vastly used in Alzheimer’s disease studies due to characteristics like its ability to differentiate into neurons and to proliferate limitlessly in vitro (Tremblay et al., 2010). These mouse neuroblastoma cells were cultured in a T25 flask with Dulbecco’s Modified Eagle Medium (DMEM) (DMEM+GlutaMAX supplement, GibcoTM, Life Tecnhologies) supplemented with 10% fetal bovine serum (FBS) (Sigma-AldrichTM) and
maintained in a humidified incubator at 37°C with 5% CO2. Once the cells reached 90% confluency the
medium was removed, and the flask was washed once with phosphate buffered saline (PBS pH 7.4) (Gibco TM, Life technologies). This washing step is crucial so that dissociation of these adherent cells with trypsin (Life technologies) is made possible, since FBS inactivates this enzyme. To improve cell detachment, cells were incubated 5 minutes at 37°C with 5% CO2. Trypsin activity was inhibited by
addition of 4 mL of complete medium. Suspended cells had a round shape and were then split 1:5 to another flask to maintain culture.
Cell counting
After trypsinization and dilution in complete medium, cells were counted in a Neubauer Chamber using the trypan blue (Amresco) exclusion test to assess cell viability. Trypan blue is an impermeable dye and thus can only be taken up by cells with a compromised membrane (non-viable cells). The average of cells per square was determined and multiplied by the dilution factor and by the conversion factor for Neubauer, 104.
2. DNA amplification
DNA amplification was performed by transforming E.coli DH5α (Life technologiesTM) with the
intended plasmids. Firstly, a batch of 50 µL of these competent bacteria was thawed, to which 0,5 µg of DNA was added. After 30 min of incubation on ice, the bacteria were subject to a heat shock (42°C for 45 seconds) so as to denature some of the lipids in its membrane, thus inducing the formation of pores through which DNA can enter. In order to close the pores and therefore not compromise cell viability, the bacteria were put on ice for a further 2 min.
Next, 900µL of Luria Bertani (LB medium) (Sigma-AldrichTM) was added to the bacteria and
they were left to grow in a centrifuge at 200 rpm for 1 hour at 37°C. This was followed by another centrifugation, this time at 5000 rpm for 1 min, to remove most of the supernatant and obtain a concentrated batch of transformed bacteria. Re-suspended cells were then plated onto LB agar plates
12
with 100 μg/ mL of the antibiotic to which the construct used for transformation presented a resistance cassette. The plate was incubated overnight at 37°C.
3. Plasmid DNA preparation
To prepare the necessary plasmids to perform the experiments, a single colony of bacteria transformed with the desired plasmid and grown in a LB-agar plate, or derived from a glycerol stock, was picked with a sterile pipette tip. Said tip was then deposited in 50 mL of LB medium containing either ampicillin (100 μg/ mL) or kanamycin (100 μg/ mL), according to the plasmid’s specific resistance marker. So as to promote optimum bacteria growth, the flasks were incubated at 37°C in an orbital shaker (189 rpm) for 12-16 hours.
Plasmid DNA purification from the E.coli DH5α cells was achieved using the NZYTechTM
NZYMidiprep kit, following the protocol described in the NZYTech handbook.
Precipitated DNA was eluted in Buffer EB (Qiagen) and the DNA concentration was determined by absorbance at 260 nm, using NanoDrop 2000 UV-Vis spectrophotometer (Thermo ScientificTM).
DNA quality was also assessed by looking at the ratio between absorbance at 260 nm and 230 nm and between 260 nm and 280 nm.
Glycerol stocks
So as to maintain a long-term stock of the plasmid DNA, E.coli cells in exponential phase of growth (after transformation and grown in LB medium overnight at 37°C) were added to 50% glycerol in a cryovial (Thermo ScientificTM) and stored at -80°C.
4. Transient plasmid transfection
For simple immunofluorescence experiments, 70 000 N2a cells were plated per well in glass coverslips inside a 24-well plate and cultured in 500 μL of complete media in 5% CO2 at 37 °C. After
24h of culture, cells were transiently transfected with cDNA (Table II.1). The amounts and volumes are given on a per well basis. For each plasmid transfection, two separate mixes were prepared, one with 0,5 μg DNA in 12,5 μL of Opti-MEM medium and the other with 0,5 μL LipofectamineTM 2000 in 12,5
μL of Opti-MEM medium. Mixes were incubated for 5 min at room temperature, combined gently, and incubated for another 20 min at room temperature. Only 250 μL of media was left in each well and the mixture containing Opti-MEM, LipofectamineTM 2000 and DNA was then added. Posteriorly, cells were
once again incubated for 24 h at 37 °C and 5% CO2.
For immunoblotting experiments 200 000 N2a cells were plated per well in a 6-well plate and cultured with 1,5 mL of complete media. The protocol was similar to the previously mentioned with the
13
only difference being the quantities of each reagent in the two mixes. In this case one mix had 2,5 μg DNA in 25 μL of Opti-MEM medium and the other has 2,5 μL LipofectamineTM 2000 in 25 μL of
Opti-MEM medium. siRNA transfection
For immunofluorescence experiments with BIN1 knockdown 30 000 cells were seeded for siControl coverslips and 40 000 for siBIN1 coverslips. After 24 hours of proliferation, N2a cells were transfected with 10nM of siRNA specific for BIN1 (10µM) (GGA UCU UCG GAC CCU AUC UGT T) and non-targeting control siRNA (10µM) (UUC UCC GAA CGU GUC ACG UTT ACG UGA CAC GUU CGG AGA ATT) (Life Technologies) (Table II.2). The amounts and volumes are given on a per well basis. For each siRNA transfection, two separate mixes were prepared, one with 5 ƿmole of siRNA in 25 μL of Opti-MEM medium and the other with 0,8 μL of LipofectamineTM RNAiMax transfection
reagent (InvitrogenTM, Life technologies) also in 25 uL Opti-MEM. Mixes were incubated for 5 min at
room temperature before being combined and incubated for an additional 20 min at room temperature. The mixture containing Opti-MEM, LipofectamineTM 2000 and siRNA was then added to each well and
the cells were incubated at 37 °C and 5% CO2 for 72 h. Rescue experiments were performed with
plasmids containing 3 silent mutations that made them siRNA resistant, following the same protocol as previously mentioned, after 48h of incubation with siRNA.
For immunoblotting experiments 120 000 N2a cells were plated for siControl wells and 135 000 for siBIN1 wells. For each siRNA transfection, two separate mixes were once again prepared, one with 15 ƿmole of siRNA in 75 μL of Opti-MEM medium and the other with 2,4 μL of LipofectamineTM
RNAiMax transfection reagent (InvitrogenTM, Life technologies) also in 75 uL Opti-MEM.
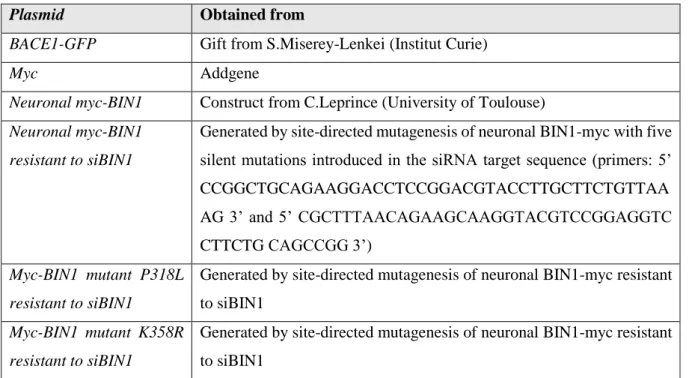
Table II.1- Plasmids.
Plasmid Obtained from
BACE1-GFP Gift from S.Miserey-Lenkei (Institut Curie)
Myc Addgene
Neuronal myc-BIN1 Construct from C.Leprince (University of Toulouse) Neuronal myc-BIN1
resistant to siBIN1
Generated by site-directed mutagenesis of neuronal BIN1-myc with five silent mutations introduced in the siRNA target sequence (primers: 5’ CCGGCTGCAGAAGGACCTCCGGACGTACCTTGCTTCTGTTAA AG 3’ and 5’ CGCTTTAACAGAAGCAAGGTACGTCCGGAGGTC CTTCTG CAGCCGG 3’)
Myc-BIN1 mutant P318L resistant to siBIN1
Generated by site-directed mutagenesis of neuronal BIN1-myc resistant to siBIN1
Myc-BIN1 mutant K358R resistant to siBIN1
Generated by site-directed mutagenesis of neuronal BIN1-myc resistant to siBIN1
14
Site-directed mutagenesis of neuronal myc-BIN1 resistant to siBIN1 and the P318L mutant had already been performed and these plasmids were being maintained in the lab stock.
Myc-BIN1 K358R mutant was obtained using the NZYMutagenesis kit by nzytechTM and this
process was performed with the help of Catarina Perdigão. Table II.2- Oligonucleotides.
Oligonucleotides Obtained from
siControl GeneCust
siBIN1 Life Technologies
5. Fluorescence microscopy
Standard Immunofluorescence
After 24 hours of transfection with the chosen plasmids, N2a cells were washed in Phosphate-Buffered Saline (PBS 1X) and fixed in 4% (v/v) paraformaldehyde (Sigma-AldrichTM) in PBS for 20
minutes at room temperature. Afterwards cells were washed 3 times in PBS 1X and permeabilized in 0.1% saponin (Sigma-AldrichTM) in PBS 1X for 1 hour at room temperature. Cells were then blocked in
3% FBS in PBS 1X for 1 hour at room temperature.
Incubation time with the primary antibodies (Table II.3) diluted in blocking buffer depended on the objective of each experiment. Staining for Aβ42 was performed with overnight incubation at 4°C, otherwise coverslips were incubated with the primary antibody solution for 1 hour at room temperature. Washes were performed between each incubation following the same protocol as previously mentioned. Incubation with the appropriate secondary antibodies (Table II.4) diluted in blocking solution were done for 1 hour at room temperature. After washing, coverslips were mounted on slides with Fluoromount-G (SouthernBiotech).
Images were acquired on a Zeiss Z2 (Carl Zeiss) upright microscope, equipped with a 60× NA-1.4 oil immersion objective and an AxioCam MRm CCD camera (Carl Zeiss), using the 63x NA-1.4NA Oil immersion objetive, FITC (519 nm) + CY5 (665 nm) + TRITC (576 nm) fluorescence filtersets and DIC optics, controlled with the MetaMorph V7.5.1/software. In order for the comparisons between conditions in each experiment to be valid, all samples from each experiment were imaged on the same day and with the same acquisition settings.
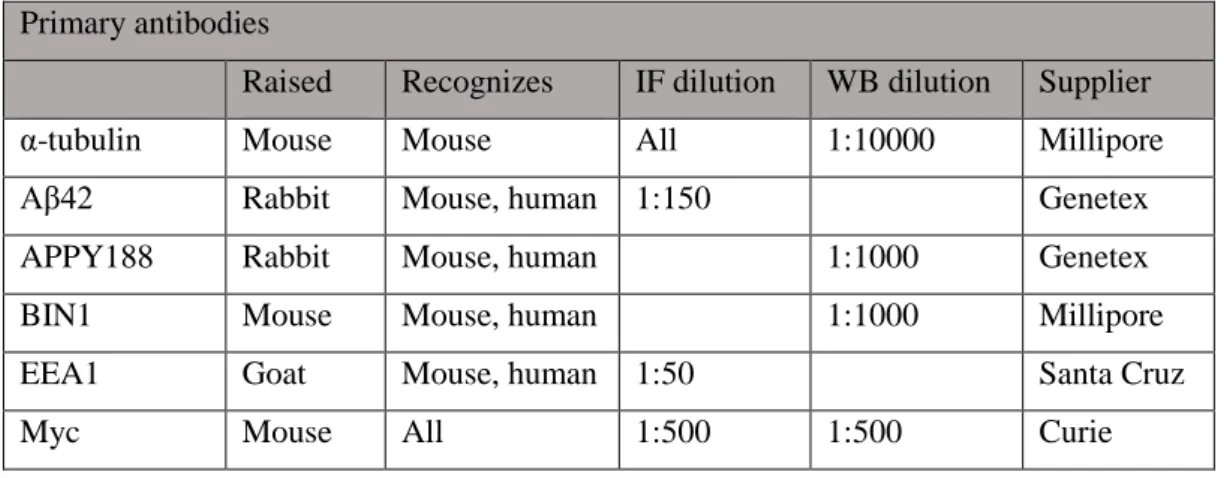
15 Table II.3- Primary antibodies.
Primary antibodies
Raised Recognizes IF dilution WB dilution Supplier
α-tubulin Mouse Mouse All 1:10000 Millipore
Aβ42 Rabbit Mouse, human 1:150 Genetex
APPY188 Rabbit Mouse, human 1:1000 Genetex
BIN1 Mouse Mouse, human 1:1000 Millipore
EEA1 Goat Mouse, human 1:50 Santa Cruz
Myc Mouse All 1:500 1:500 Curie
Table II.4- Secondary antibodies and probes. Secondary antibodies
Raised in IF dilution WB dilution Supplier
Alexa-647 anti-Rabbit Chicken 1:250 Molecular probes/Invitrogen
Alexa-555 anti-Goat Donkey 1:250 Molecular probes/Invitrogen
Alexa-555 anti-Mouse Goat 1:250 Molecular probes/Invitrogen
DAPI 1:100 Molecular probes/Invitrogen
Phalloidin-488 1:200 Molecular probes/Invitrogen
HRP anti-Mouse 1:5000 Bio-Rad
HRP anti-Rabbit 1:5000 Bio-Rad
6. Single cell quantitative analysis
Images were analyzed with Icy software (Institut Pasteur) and figures prepared in Fiji (ImageJ). To assess average fluorescence, cells were outlined using the “polygon” tool in “region of interest” and a portion of the background was also selected using the “rectangle”. After exporting to excel, the average fluorescence of the background was subtracted to the average cellular fluorescence. The results were presented as percentage of the average fluorescence of cells transfected with only a Myc containing plasmid or of cells transfected with siRNA Control (100%, control).
Endosome analysis was performed using the “Spot Detector” feature under the “Detection & Tracking” tab, and the same scale and sensitivity was used throughout all images and conditions. These values were decided based on what scale and pixel number detected the largest number of obvious endosomes in all conditions.
16
In experiments contemplating the perinuclear area the size of the “ellipse” used for this portion of the cell was maintained in all experiments and conditions.
All graphs and statistical analysis was done using GraphPad Prism version 6 (Windows, GraphPad
Software, La Jolla California USA, www.graphpad.com). Outliers were eliminated using the ROUT
method. All statistical analysis for conditions that did not pass the normality tests were performed using
the Kruskal-Wallis test.
7. Immunobloting
Preparation of cell lysates
72 hours after knockdown of BIN1 and 24h after rescue with BIN1 wt and BIN1 mutants P318L and K358R, N2a cells were placed on ice and washed with ice-cold PBS Ca2+Mg+. Lysis buffer
composed of 95% protein extraction solution (RadioImmunoprecipitation Assay (RIPA)), 4% Protease Inhibitor Cocktail (Roche Diagnostics) 25X and 1% SDS 10%, was added to cells to enable a rapid and efficient cell lysis (100 µl). RIPA solution was composed of 50mM Tris-HCl pH 7.4 (Sigma-AldrichTM), 1% NP-40 (Sigma-(Sigma-AldrichTM), 0.25% Deoxycholate (Sigma-(Sigma-AldrichTM), 150mM NaCl (NZYTechTM) and 1mM EGTA (Sigma-AldrichTM). Afterwards, cells were scrapped to ensure the complete rupture of their membranes. Protein lysates were then placed on ice for 15 min before being centrifuged at 12 000 xg for 10 min at 4°C. Supernatants were posteriorly used on Western blot assays or stored at – 80°C.
Western Blot
Protein amount from cell lysates was quantified using the Pierce™ BCA Protein Assay Kit, Thermo Scientific™.
Protein denaturation was achieved with the addition of sample buffer (Tris 0.25M pH 6.8, 40% glycerol (Sigma-AldrichTM), 8% sodium dodecyl sulfate (SDS) (Sigma-AldrichTM), Bromophenol blue
0.015% (w/v) (GE Healthcare) and 10% β-mercaptoethanol (Sigma-AldrichTM)) followed by incubation
at 95°C for 5 min. Cells were separated by Tris-Glycine SDS-PAGE (running buffer: 25 mM Tris, 192 mM glycine (NZYTechTM) and 0.1% (w/v) SDS), using BioRad Mini-PROTEANTM at 90 V until the
protein went past the stacking gel at which point the voltage was increased to 120 V.
Electrophoretic transfer (transfer buffer: 150mM glycine, 20mM Tris, 0.037% SDS, 20% (v/v) ethanol 96% (VWR)) to nitrocellulose membranes (0.1mm) (GE Healthcare Life Sciences) was performed at 10 V for 1h, using BoltTM Mini Blot Module. Percentage of acrylamide (NZYTechTM) gels
varied between 7,5 and 15% according to the molecular weight of the proteins being analysed.
After transfer, membranes were blocked in PBS with 0.1% (v/v) Tween 20 (PBST) (SigmaAldrichTM) and 5% (w/v) non-fat dry milk for 30 min at room temperature. This step is crucial
17
to improve result reliability as the proteins in the milk will cover the membrane surface and bind to the places where the sample proteins have not bound, thus preventing antibodies from displaying non-specific signals derived from non-non-specific binding.
Primary antibodies were diluted in 1% (w/v) non-fat dry milk in PBST for 1h at room temperature or overnight at 4ºC with constant agitation. After this step, and with the objective of removing any primary antibody left unbound, the membranes were washed with PBST four times for five minutes each wash. Membranes were then incubated with secondary antibody conjugated with the reporter enzyme Horseradish peroxidase (HRP), in 1% (w/v) non-fat dry milk diluted in PBST, for 1h at room temperature and with constant agitation. Membranes were once again washed following the previous protocol.
Detection of the target proteins was achieved by incubating the membranes with a mixture of equal amounts of luminol and peroxide solution, for 1 min, in a process called enhanced chemiluminescent (AmershamTM ECLTM Prime Western Blotting Detection Reagent, GE Healthcare).
Luminol is oxidized to 3-aminophtalate with HRP as the catalyst, in a reaction that emits light, which is enhanced by the peroxide solution, thus allowing for the detection of the antibody-recognized proteins. The protein bands were visualized by ChemiDoc XRS+ system with exposure times varying depending on the amount of the target protein.
Analysis of protein band intensities was performed using Fiji (ImageJ) software and all graphs and statistical analysis was performed with GraphPad Prism version 6 (Windows, GraphPad Software, La Jolla California USA, www.graphpad.com").
19
III.
Results
1. The impact of AD variants on BIN1 expression
With the intention of understanding the effect that SNPs have, in specific the ones that lead to the BIN1 mutations P318L and K358R, and to pinpoint whether they are able to impact the development of LOAD, we decided to assess their influence on Aβ accumulation as well as try to understand what cellular alterations they provoke that cause them to be found in association with sporadic AD.
In AD patients, BIN1 gene expression was found increased, but the expression of BIN1 isoforms was differentially altered, with the neuronal isoform reduced and the ubiquitous increased (Calafate et al., 2016). However, since it had been observed that only the neuronal isoform rescued the increase in Aβ due to BIN1 knockdown (Ubelmann et al., 2017), we decided to mutagenize the neuronal isoform in order to use it for our experiments.
With the objective of analyzing the impact of the BIN1 mutations P318L and K358R on the gene’s total expression levels, we transiently transfected mouse neuroblastoma cells with myc-tagged plasmids encoding BIN1 wild-type (BIN1 wt); BIN1 wt siRNA-resistant, obtained by site-directed mutagenesis of the wt gene (BIN1 wt + 3sm); BIN1 with the P318L mutation (BIN1 P318L); BIN1 with the K358R mutation (BIN1 K358R). An empty myc plasmid (myc) was additionally used as a transfection control.
To measure the amount of BIN1 protein being expressed in transfected N2a cells, we performed a western blot analysis using an antibody against BIN1. The immunoblots of the two independent experiments performed are shown in Figure III.1.A.
In the western-blot it is possible to observe two bands for all conditions except for the lane where the lysates of cells transfected with the empty myc plasmid were run. In this lane there was an absence of bands, indicating that all bands correspond to overexpressed BIN1 and that endogenous BIN1 was not able to be detected (Figure III.1.A). Both bands correspond to a detection of a similar weighted protein, with the heavier band slightly above the 75 kDa and the lower-weight one slightly below this mark. We expected the detection of a single band of approximately 80 kDa, correspondent to the neuronal isoform 1 of BIN1, as the cDNA transfected encodes only for this isoform. It is therefore highly unlikely that the second band corresponds to either another BIN1 isoform or to endogenous BIN1 since, as previously mentioned, the amount of this protein was bellow detection limit in these experimental conditions.
There are several other possible explanations for the emergence of a second band. One possibility for why this occurred would be a cleavage of the target protein due to incomplete inhibition of cellular proteases. Another factor that could be influencing the molecular weight of the protein is the
20
existence of an interaction between our target protein and other unknown proteins or a dimerization of BIN1, however this interaction would lead to a higher increase in total molecular weight than the one observed. A third hypothesis is that some post-translational modification of the protein could be occurring, which results in a slight shift in gel migration.
Using cells expressing BIN1 wt as control, we can observe that in both individual experiments performed, an increase of 32% was observed with the expression of BIN1 P318L mutant when compared to BIN1 wt. The results from cells expressing BIN1 K358R and BIN1 wt with the 3 silent mutations varied in between experiments precluding the identification of a trend for change in expression. This lack of experimental replication was specifically denoted with the BIN1 K358R mutant, as it had an 80% difference in expression between experiments, raising the possibility of problems during the protein transfer step in the western blot (Figure III.1.B). More experiments are necessary to conclude on the impact of these AD mutations on BIN1 expression. Even so, the fact that both experiments showed the same pattern with the BIN1 P318L mutant, suggests that this specific mutation does lead to an increase in BIN1 total expression.
The densitometric analysis of the percentage of the higher band relative to the lower band in both experiments resulted in similar results. This analysis revealed that, while for cells transfected with the BIN1 wt plasmid we can observe that most of the BIN1 protein is detected in the upper range (63,5%), for cells expressing BIN1 wt with the three silent mutations there was a 50/50 split between both molecular weights. BIN1 mutation P318L seems to have led to a similar result to cells expressing BIN1 wt with the three silent mutations, with 47,7 % of the BIN1 protein being detected above the 75 kDa mark. Regarding the second mutant, BIN1 K358R, most of the protein was detected above 75 kDa, however, the difference between both molecular weights was of only 9,0% (Figure III.1.C). The difference in ratio obtained between cells overexpressing BIN1 wt and BIN1 wt with the three silent mutations is surprising since the silent mutations are not supposed to alter the protein sequence, structure, interactions or post-translational modifications.
21 A. B. C. B in 1 /T u b u li n ( % o f B in 1 w t) Bin 1 w t Bin 1 w t + 3s m Bin 1 P 31 8L Bin 1 K 35 8R 0 5 0 1 0 0 1 5 0 2 0 0 % o f to ta l p r o te in Bin 1 w t Bin 1 w t + 3 s m Bin 1 P 31 8L Bin 1 K 35 8R 0 2 0 4 0 6 0 8 0 U p p e r b a n d L o w e r b a n d Figure III.1- BIN1 expression levels in cells overexpressing BIN1 wt and BIN1 mutants P318L and
K358R. N2a cells transiently transfected with myc-BIN1 wt (BIN1 wt), myc-BIN1 wt with 3 silent mutations (BIN1 wt + 3sm), myc-BIN1 P318L (BIN1 P318L) and myc-BIN1 K358R (BIN1 K358R) for 24h were analysed by western blot with anti-BIN1. Anti-α-tubulin detection was used as a loading control A. Western blots of lysates from two independent experiments B. Quantification of band densities of BIN1 expression levels (n=2) of the western blots shown in A, using Fiji ImageJ software. Results were normalized by α-Tubulin and are shown as percentage of BIN1 wt (100%). BIN1 levels are increased in BIN1 wt + 3sm (114.2 ± 34.41%) and in BIN1 P318L (132.1 ± 24.86%) and decreased in BIN1 K358R (91.32 ± 56.77%). Error bars indicate SEM (Standard Error of the Mean). C. Ratio between the upper and the lower band observed in the western blots in A. Upper bands: BIN1 wt (63.64 ± 0.64%), BIN1 wt + 3sm (50.00 ± 0.41%), BIN1 P318L (47.68 ± 0.20%), BIN1 K358R (54.50 ± 0.17%); Lower bands: BIN1 wt (36.36 ± 0.64%), BIN1 wt + 3sm (50.00 ± 0.41%), BIN1 P318L (52.32 ± 0.20%), BIN1 K358R (45.50 ± 0.17%). Error bars indicate SEM.
2. Impact of BIN1 mutant overexpression on Aβ42 levels
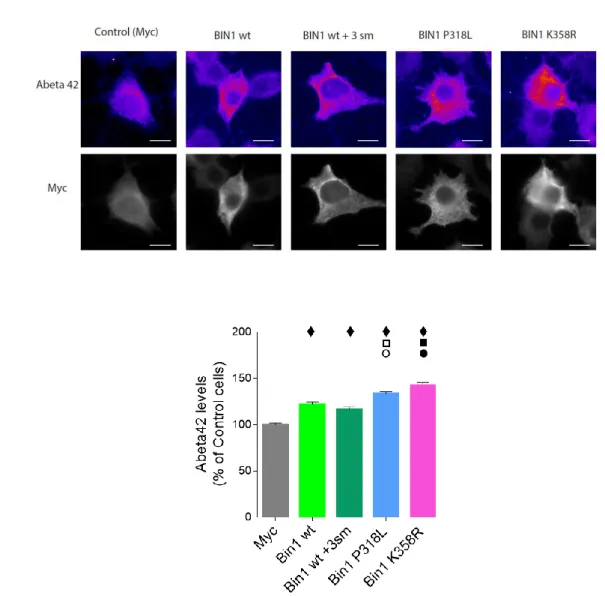
To determine if overexpressing P318L and K358R BIN1 mutants leads to a similar result to the overexpression of the wt form of the protein, or whether these mutations have a greater impact in Aβ42 levels, we transiently expressed BIN1 wt, BIN1 +3sm, BIN1 P318L, BIN1 K358R, as well as a plasmid containing only myc as control, in N2a cells. After 24h of expression, we fixed the cells and stained them using antibodies against myc and Aβ42. This immunostaining allowed for observation of the
22
amyloid peptide distributed in puncta throughout the cells instead of in an all-over homogeneous distribution (Figure III.2.A). Neither overexpression of BIN1 wt nor overexpression of BIN1 mutants seem to affect Aβ42 distribution in the subcellular compartments (Figure III.2.A).
Quantification of the Aβ42 immunofluorescence mean intensity per single cell revealed that, as expected, there were no significant differences in Aβ42 levels between BIN1 wt and BIN1 wt with the three silent mutations (Figure III.2.B). However, it was still necessary to confirm these results to ensure that the silent mutations have absolutely no impact, since both mutants also carry them. Expression of the P318L and K358R mutants gave rise to a 33,6% and a 42,8% increase in Aβ42, respectively, in comparison to myc control cells. This result is significantly more than the 16,6% and 22,0% increase in Aβ42 observed upon expression of BIN1 wt and BIN1wt + 3sm, respectively (Figure III.2.B).
This shows that these mutations cause a larger accumulation of Aβ42 than what can be explained due to the overexpression of the BIN1 protein, with the K3558R mutant leading to almost double the increase of this peptide’s levels.