Universidade de Aveiro 2016 Universidade de Lisboa 2016 Departamento de Biologia Faculdade de Ciências
Victor José Bandeira
Bio-ecologia do sacarrabos (Herpestes ichneumon)
em Portugal
Bio-ecology of the Egyptian mongoose (Herpestes
ichneumon) in Portugal
Universidade de Aveiro 2016 Universidade de Lisboa 2016 Departamento de Biologia Faculdade de Ciências
Victor José Bandeira
Bio-ecologia do sacarrabos (Herpestes ichneumon)
em Portugal
Bio-ecology of the Egyptian mongoose (Herpestes
ichneumon) in Portugal
Tese apresentada à Universidade de Aveiro para cumprimento dos requisitos necessários à obtenção do grau de Doutor em Biologia e Ecologia das Alterações Globais, realizada sob a orientação científica do Professor Doutor Carlos Manuel Martins dos Santos Fonseca, Professor Associado com Agregação do Departamento de Biologia da Universidade de Aveiro e coorientação científica do Professor Doutor Emílio Javier Virgós Cantalapiedra, Professor Titular da Universidad Rey Juan Carlos (Madrid, Espanha), e da Professora Doutora Mónica Sofia Vieira da Cunha, Professora Auxiliar Convidada da Faculdade de Ciências da Universidade de Lisboa.
Apoio financeiro da FCT,
FEDER/COMPETE e do FSE no âmbito do III Quadro Comunitário de Apoio através do Projecto: “Population genetics of the Egyptian mongoose (Herpestes ichneumon) in Portugal” (PTDC/BIA-BEC/104401/2008) e da
Apoio financeiro da Universidade de Aveiro (Departamento de Biologia) e FCT/MEC, ao CESAM RU
(UID/AMB/50017) através de fundos nacionais e co-financiamento pelo FEDER, within the PT2020 Partnership Agreements e no âmbito do projecto:
Dedico este trabalho à Biodiversidade, Aos que procuram cuidar da ‘Casa Comum’,
Àqueles que tombaram quando protegiam a vida selvagem…
“… não basta pensar nas diferentes espécies apenas como eventuais «recursos» exploráveis, esquecendo que possuem um valor em si mesmas.”
o júri
presidente Prof. Doutor Luís Filipe Pinheiro de Castro
professor catedrático da Universidade de Aveiro
Prof. Doutor Emílio Javier Virgós Cantalapiedra
professor titular da Universidad Rey Juan Carlos, Madrid, Espanha coorientador
Prof. Doutora Margarida Santos Reis
professora associada com agregação da Faculdade de Ciências da Universidade de Lisboa
Prof. Doutor Paulo Célio Pereira Martins Alves
professor associado com agregação da Faculdade de Ciências da Universidade do Porto
Prof. Doutor Carlos Manuel Martins dos Santos Fonseca
professor associado com agregação do Departamento de Biologia da Universidade de Aveiro orientador
Prof. Doutor António Paulo Pereira Mira
professor auxiliar do Departamento de Biologia da Universidade de Évora
Doutor Luís Miguel do Carmo Rosalino
agradecimentos Ao meu orientador, Professor Doutor Carlos Fonseca, além da orientação ou da formação e aprendizagem, agradeço a oportunidade que me deu neste mundo da investigação, a porta escancarada que encontrei desde o primeiro dia, a extraordinária confiança em mim depositada, a autonomia, a amizade e todos os momentos que fomos ultrapassando sempre com bom humor! Ao meu coorientador Professor Doutor Emílio Virgós pela amizade, paciência que teve para comigo, pela disponibilidade e dedicação em acompanhar e supervisionar todos os meus trabalhos neste estudo, e por todas as aprendizagens que me proporcionou. À minha coorientadora Professora Doutora Mónica Cunha, que desde o início se disponibilizou, acompanhou e enriqueceu o meu trabalho com toda a dedicação e amizade!
À minha mãe por tudo o que fez por mim, pelo tempo que comigo despendeu, pela sua incomensurável prestação na minha educação, formação e percurso de vida… a toda a minha família que me abraça em todas as ocasiões, aos que vivem perto e aos que moram mais longe… Aos meus antepassados na linhagem genealógica, porque a combinação de toda a sua notável História e vivências, originou aquele que sou!
Ao Alexandre, um irmão, que mesmo distante, foi acompanhando todo o meu trabalho, concebeu ideias, auxiliou no desenrolar deste projeto, me chamou a atenção sempre que necessário, incansável na verificação dos textos em língua inglesa, por me escutar horas a fio, por estar sempre disponível, e como se não bastasse, ainda me abriu as portas de sua casa, no seio da sua família, sempre que me deslocava ao Sul durante a recolha de amostras. Por tudo isto, alargo este agradecimento à sua esposa, Rita, e ao pequeno “grande” Henrique, que me acolheram sempre, fazendo-me sentir como se estivesse na minha própria casa.
Ao Professor Doutor Amadeu Soares pela oportunidade no Programa Doutoral, pela confiança depositada e pelas responsabilidades que me atribuiu. Aos professores, investigadores e pessoal não docente do DBIO que colaboraram nas mais diversas circunstâncias.
Às minhas primeiras professoras: Graça Fardilha, que iniciou a minha educação e formação escolar e Rosa Pereira, que me ensinou a ler e a escrever, assim como ensinou todas as bases do ensino primário.
Ao Eduardo Ferreira, João Santos, Rita Torres, Filipa Peste, Ana Lino, Ana Valente, Rita Rocha, Milene Matos, entre outros colegas da Unidade de Vida Selvagem que me auxiliaram a complementar os trabalhos de várias maneiras, com ênfase especial à Tânia Barros, que me acolheu no projeto do Sacarrabos e permitiu desenvolver a componente dos estudos ecológicos, e ao João Carvalho que preparou e disponibilizou os dados ecológicos e climáticos, bem
agradecimentos Aos coletores, caçadores, entidades gestoras de zonas de caça e seus representantes, que recolheram e disponibilizaram as amostras que tornaram possível este trabalho, nomeadamente: FENCAÇA, ANPC e CNCP, Tapada Nacional de Mafra, Alberto Oliveira, Alcides Jesus, Almerindo, Ana Valente, Catarina Carvalho, André, António Coelho, António Martins Alexandre, Professor Doutor António Mira, António Pepe, António Rocha, Capitão Faustino, Professor Doutor Carlos Fonseca, Carlos Laranjeira, Carlos Mestre, Carlos Santos, César, Eng. Dario Ramos, Professor Doutor David Rodrigues, Domingos Trindade, Eduardo Oliveira e Sousa, Ernesto Alves, Dra. Fábia Azevedo, Fausto Guilherme, Dr. Fernando Correia, Fernando Francisco, Fernando Lopes, Dr. Flor Ferreira, Francisco Gomes, Graça, Jacinto Amaro, Eng. João Basso Costa, João Carlos Lourenço, Dr. João Carvalho, João Grosso, João Hélder da Silva, Doutor João Santos, José, José Silvares Campos, José Correia, Luís Dias, Luís Machado, Luís Simões, Manuel Dias, Manuel Gil, Manuel Jóia, Manuel Palma, Mário Tomás, Miguel Machado, Miguel Monteiro, Nazaré, Nuno Moricato, Olinto Lacerda, Dra. Paula Simões, Paulo Loureiro, Pedro Carvalho, Professor Doutor Manuel Assunção, R. Santos, Raúl Correia, Ricardo Duque, Ricardo Neto, Ricardo Paiva, Doutora Rita Torres, Dr. Rui Ferreira Marques, Vítor Eusébio, Vítor Palmilha, Vítor Ventura.
Ao ICNF pelas autorizações devidas para a realização deste trabalho.
À equipa de técnicos do INIAV, IP., especialmente ao Dr. Paulo Carvalho, Dra. Paula Mendonça e Dra. Madalena Monteiro, por algumas das colheitas de amostras.
Ao Carlos Pimenta do Museu de História Natural de Lisboa pelo acolhimento, disponibilidade para ensinar e por providenciar o método para a limpeza dos crânios através de ação enzimática.
À FCT, DBIO e CESAM pelo suporte financeiro.
Ao Programa Doutoral em Biologia e Ecologia das Alterações Globais e aos colegas, pela oportunidade de tomar parte.
Aos meus amigos, e são tantos, pela paciência, compreensão e pela minha ausência em muitos momentos. Agradeço especialmente ao Roberto Filipe que sempre esteve disponível para atender às urgências técnicas que tantas vezes o meu computador exigiu. À Mariana Almeida pelo auxílio e pelos bons momentos partilhados nos intervalos dos trabalhos.
Àqueles que durante o meu percurso profissional me fecharam portas, desse modo permitiram evitar que eu tivesse perdido tempo com a sua ignorância e
palavras-chave Herpestes ichneumon; biometrias; dimorfismo sexual; competência imune; condição corporal; ecologia trófica; ecologia reprodutiva.
resumo O sacarrabos (Herpestes ichneumon Linnaeus, 1758) é um carnívoro que, na Europa,
se encontra restrito à Península Ibérica e cuja distribuição em Portugal esteve mais confinada a Sul do Rio Tejo, até meados dos anos 90 (séc. XX). Durante as últimas décadas, esta espécie tem vindo a expandir-se do interior para o litoral e de Sul para Norte. Algumas populações são já encontradas na região biogeográfica Atlântica, onde encontram novas condições ecológicas, climáticas e de habitat. O sacarrabos é conotado negativamente pela comunidade de caçadores, que o imputa de depredar maioritariamente as espécies de caça menor com maior interesse económico, como o coelho-bravo, a perdiz e os seus ovos, bem como de gerar ninhadas múltiplas e numerosas. Na verdade, estas preocupações carecem de confirmação científica. Os aspetos ecológicos conhecidos em sacarrabos devem-se principalmente aos trabalhos científicos desenvolvidos nas populações da região de Doñana (Espanha) ou de Israel. Os estudos sobre a ecologia das populações deste carnívoro em território português são escassos ou restritos a algumas regiões. A ecologia do sacarrabos à escala biogeográfica, cobrindo diferentes padrões ecológicos, climáticos ou de pressão antrópica é desconhecida. Este trabalho pretende contribuir para o conhecimento dos aspetos ecológicos fundamentais, tróficos e reprodutivos do sacarrabos, quer nas áreas de distribuição histórica, como nas zonas de expansão e recentemente colonizadas. Foram assim amostrados 678 sacarrabos provenientes de atropelamentos acidentais (33), ações de correção de densidade de predadores e atos legais de caça (645) no território de Portugal continental. Neste contexto, os principais objetivos deste trabalho compreendem: 1) a descrição e análise dos parâmetros biométricos; 2) a determinação e a análise dos fatores que regulam a competência imune e a condição corporal; 3) a identificação das principais presas e a avaliação da ecologia trófica, entre géneros, classes etárias, estações do ano e regiões, moldados pelas diferentes características ambientais, condições climáticas e pressões antrópicas; 4) a identificação dos períodos reprodutor, de gestação, de lactação, com determinação do tamanho da ninhada e análise dos padrões reprodutivos. Os resultados apurados permitiram registar, pela primeira vez, dimorfismo sexual no tamanho corporal de sacarrabos em território lusitano, confirmando-se que os machos são maiores que as fêmeas, além de se apurarem diferenças biométricas marcadas entre regiões, que se sugere serem reguladas pela seleção sexual, disponibilidade alimentar, pressão humana e pelos diferentes padrões de utilização do habitat. Neste trabalho, foram também reveladas, pela primeira vez, as médias dos pesos e das principais medidas corporais de juvenis tipo I, tipo II e de sub-adultos. Neste estudo, foram ainda identificadas variações na competência imune ao longo do ano, que aparenta ser maior nos machos, justificadas pelo comportamento reprodutivo, parasitismo, ou enfermidades. Foi detetada uma relação estatísticamente significativa entre a competência imune e a condição corporal, que difere também entre géneros e idades, devido à ecologia trófica e reprodutiva. A análise da dieta permitiu observar que as espécies de caça menor representam menos de metade do espectro alimentar consumido. Neste estudo foram determinados os tamanhos médios (3) ( =2.75), a extensão (1 a 4) e a moda (3) das ninhadas. Identificaram-se os períodos férteis dos órgãos reprodutores, de gestação e de lactação, que se encontram associados ao aumento do fotoperíodo e da produtividade primária, e que estão confinados à época que inicia no auge do Inverno e que decorre até ao início do Verão. Por fim, nos machos verificou-se existirem conflitos na alocação de recursos à reprodução versus competência imune ou condição corporal. Com as informações extraídas desta investigação, espera-se contribuir para a criação de uma base de conhecimento para futuros estudos científicos relacionados com a sanidade, ou
keywords Herpestes ichneumon; biometrics; sexual dimorphism; immune competence; body condition; trophic ecology; reproductive ecology.
abstract The Egyptian mongoose (Herpestes ichneumon Linnaeus, 1758) is a carnivore that in
Europe is restricted to the Iberian Peninsula and whose distribution in Portugal was previously confined to the South of the Tagus River until the mid-1990's. During the last decades, this species has been expanding geographically, from inland to the coast and from South to North. Some populations of Egyptian mongoose are already found in the Atlantic biogeographical region, where they find new ecological, climate and habitat conditions. The Egyptian mongoose is negatively perceived by the hunting community who believes it to predate mostly on small game species with great economic interest, such as the European rabbit, the red-legged partridge and its eggs, and to generate multiple and numerous litters. However, these concerns lack scientific clarification. Ecological aspects of Egyptian mongoose are known mainly from scientific work carried out on the population of the Doñana region (Spain) or Israel. Studies on the ecology of the Portuguese populations of this carnivore are scarce or restricted to certain geographic areas. The ecology of the Egyptian mongoose on a biogeographic scale, covering different ecological and climatic patterns or human pressure is unknown and lacks comprehension and scientific evidence. This work aims to contribute to the knowledge of the fundamental, trophic and reproductive ecological aspects of the Egyptian mongoose, both in its historical distribution areas, and in the expansion and recently colonized areas. In this study, 678 mongooses were sampled from accidental road-kills (33), density correction actions and legal acts of hunting (645) in the territory of mainland Portugal. In this context, the main objectives of this study include: 1) description and analysis of biometric parameters; 2) determination and analysis of the factors that regulate immune competence and body condition; 3) identification of the main prey and evaluation of its trophic ecology, according to gender, age classes, seasons and regions, shaped by different environmental characteristics, climatic conditions and human pressures; 4) the identification of reproductive, pregnancy and lactation periods, determination of litter size and analysis of reproductive patterns. The results obtained indicate for the first time sexual dimorphism in body size in the Egyptian mongoose populations of the Portuguese territory, in which males are larger than females, in addition to clear biometric differences between regions. The reported variations are suggested to be regulated by sexual selection, food availability, human pressure and by different habitat use patterns. For the first time, the average weight and main body measurements of juvenile type I, type II and sub-adults were determined. Variations in immune competence were identified throughout the year, which was higher in males, justified by the reproductive behavior, parasitism, or diseases. A statistically significant relationship between immune competence and body condition was detected, which also differs between genders and ages due to trophic and reproductive ecology. Diet analysis indicates that small game species represent less than half of the consumed food spectrum. In this study the average sizes (3) ( =2.75), range (1 a 4), and mode (3) of the litters were also determined. Additionally, the active periods of reproductive organs, pregnancy and lactation were identified, which are associated to the increasing photoperiod and to primary productivity, starting at the peak of winter and elapsing until the beginning of summer. Finally, we found male-specific conflicts in resource allocation between mating effort/parental investment and body condition, as well as with immune function, supporting the notion of an energetic trade-off and fitness cost associated with reproductive performance. With the information drawn from this research, we hope to shed light on mongoose’s bio-ecology and to create a framework for future research, either related to health or climate change. This work is also a contribution for the reassessment of the hunting status and improvement of the Egyptian
Declaro que esta tese é integralmente da minha autoria, estando devidamente referenciadas as fontes e obras consultadas, bem como identificadas de modo claro as citações dessas obras. Não contém, por isso, qualquer tipo de plágio quer de textos publicados, qualquer que seja o meio dessa publicação, incluindo meios eletrónicos, quer de trabalhos académicos.
CONTENTS
List of Figures ………. V List of Tables ………... IX
Chapter 1. General introduction ……….. 1
1.1. Main objectives ……… 11
1.2. Thesis structure ………. 14
1.3. References ……… 14
Chapter 2. Biometrics ………... 21
2.1. Geographic variation and sexual dimorphism in body size of the Egyptian mongoose, Herpestes ichneumon in the western limit of its European distribution ………... 23
2.2. Abstract ……… 25
2.3. Introduction ……….. 27
2.4. Material and methods ………... 29
2.4.1. Sampling procedures ……… 29 2.4.2. Study area ………. 30 2.4.3. Statistical procedures ……… 31 2.5. Results ……….. 32 2.6. Discussion ……… 44 2.7. References ……… 48
Chapter 3. Immune competence and body condition ……… 57
3.1. Life-history traits and seasonal effects drive spleen weight and body condition of a medium-sized carnivore, the Egyptian mongoose (Herpestes ichneumon) ………. 59
3.2. Abstract ……… 61
3.3. Introduction ……….. 63
3.4. Material and methods ………... 65
3.4.1. Study area ………. 65
3.4.3. Environmental and ecological drivers ……….. 66 3.4.4. Statistical procedures ……… 68 3.5. Results ……….. 70 3.6. Discussion ……… 79 3.7. References ……… 84 Chapter 4. Diet ………... 91
4.1. Diet footprint of Egyptian mongoose along ecological gradients: effects of primary productivity and life-history traits ………... 93
4.2. Abstract ……… 95
4.3. Introduction ……….. 97
4.4. Material and methods ………... 100
4.4.1. Study area ………. 100
4.4.2. Sampling procedures ……… 101
4.4.3. Statistical procedures ……… 102
4.5. Results ……….. 104
4.5.1. Food categories and overall diet contents ……… 104
4.5.2. Variables and interactions related with Mammals’ consumption ……… 110
4.5.3. Variables and interactions related with Reptiles’ consumption ………... 114
4.5.4. Variables and interactions related with Amphibians’ consumption ……. 116
4.5.5. Variables and interactions related with Invertebrates’ consumption …... 119
4.6. Discussion ……… 121
4.7. References ……….... 129
Chapter 5. Reproduction ……….. 137
5.1. The reproductive ecology patterns of the Egyptian mongoose (Herpestes ichneumon) on the western limits of Europe ………... 139
5.2. Abstract ……… 141
5.3. Introduction ……….. 143
5.4. Material and methods ………... 146
5.4.1. Study area ………. 146
5.4.2. Sampling procedures ……… 147
5.5. Results ……….. 150
5.6. Discussion ……… 165
5.7. References ……… 171
Chapter 6. Highlights on bio-ecology of the Egyptian mongoose in Portugal . 179 Chapter 7. Final considerations and future perspectives ……….. 187
7.1. References ……… 194 Supplementary data ………. 197 Appendix A1 ………... 199 Appendix A2 ………... 205 Appendix A3 ………... 210 Appendix A4 ………... 223 Appendix A5 ………... 229
LIST OF FIGURES
Fig. 1.1. Egyptian mongoose (Herpestes ichneumon Linnaeus, 1758) specimen. .. 4 Fig. 1.2. Representation of the biogeographic regions within mainland Portugal (adapted from Rivas-Martínez et al., 2004). ………... 5 Fig. 1.3. Current distribution of the Egyptian mongoose (Herpestes ichneumon) in Portugal. (data from the present study and data adapted from Barros et al., 2015). ………... 6 Fig. 1.4. Scope of the expansion of the Egyptian mongoose (Herpestes
ichneumon) in the last 30 years in Portugal. (data adapted from Barros et al.,
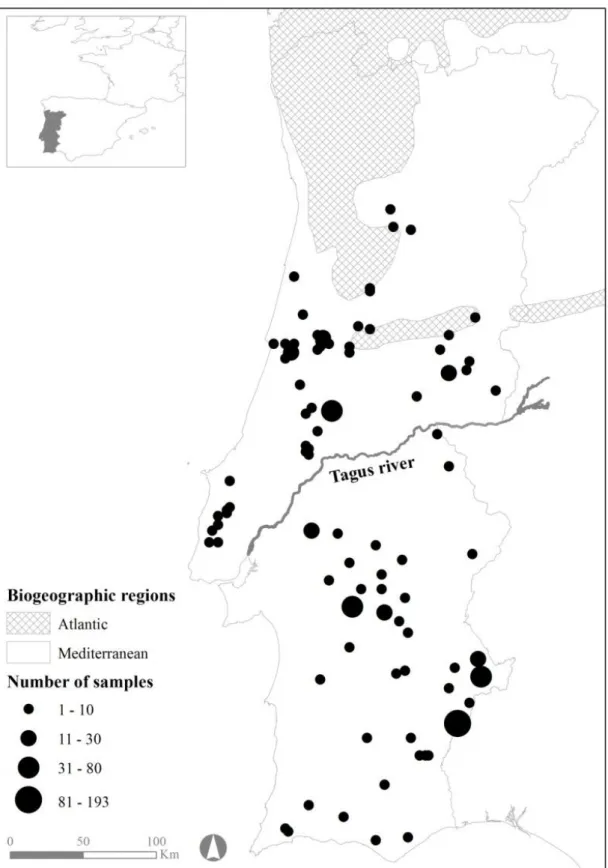
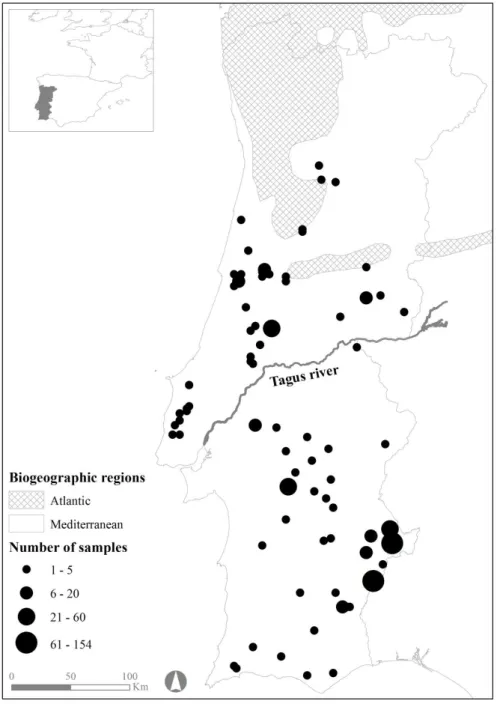
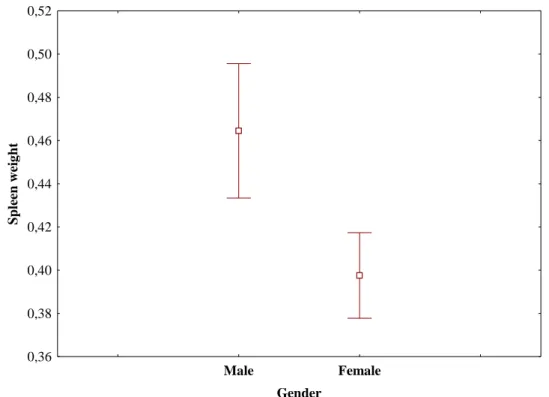
2015). ………... 7 Fig. 1.5. Mediterranean maquis - characteristic habitat of the Egyptian mongoose (Herpestes ichneumon). ………... 8 Fig. 2.1. Locations and number of samples of the Egyptian mongoose specimens under study. ………. 33 Fig. 2.2. Means of size index calculated by PCA using weight and six physical measures of the Egyptian mongoose observed for each gender across the age class. Vertical bars denote 95% confidence intervals. ……… 42 Fig. 2.3. Means of size index calculated by PCA using weight and six physical measures of the Egyptian mongoose observed for each region across the age class. Vertical bars denote 95% confidence intervals. ……… 42 Fig. 3.1. Locations and number of samples of the Egyptian mongoose specimens under study. ………. 70 Fig. 3.2. Means of Egyptian mongoose spleen weight (expressed as g/100 g body weight) observed for each gender. Vertical bars denote 95% confidence intervals. 73 Fig. 3.3. Means of Egyptian mongoose spleen weight (expressed as g/100 g body weight) observed for each season. Vertical bars denote 95% confidence intervals. 73 Fig. 3.4. Means of Egyptian mongoose body condition (residuals from the regression of total body weight against total body length) observed for each gender. Vertical bars denote 95% confidence intervals. ………. 77
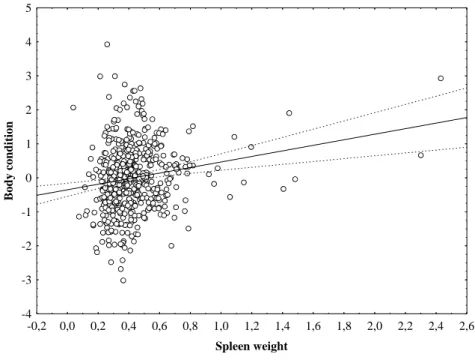
Fig. 3.5. Means of Egyptian mongoose body condition (residuals from the regression of total body weight against total body length) observed for subcutaneous fat indexes (ranging 0-4). Vertical bars denote 95% confidence intervals. ……….. 77 Fig. 3.6. Means of Egyptian mongoose body condition (residuals from the regression of total body weight against total body length) observed for visceral fat indexes (ranging 0-4). Vertical bars denote 95% confidence intervals. ……… 78 Fig. 3.7. Scatterplot of Egyptian mongoose body condition (residuals from the regression of total body weight against total body length) observed for spleen weight (expressed as g/100 g body weight). Dashed lines denote 95% confidence intervals. Body condition = -0.3508+0.817*spleen weight. ………... 78 Fig. 4.1. Locations of the Egyptian mongoose specimens under study. …………. 104 Fig. 4.2. Percentage of each food item consumed by the Egyptian mongoose in Portugal. ……….. 109 Fig. 4.3. Percentage of game species and other food items consumed by the Egyptian mongoose in Portugal. ………. 109 Fig. 5.1. Locations and number of samples of the female Egyptian mongoose specimens under study. ……… 150 Fig. 5.2. Locations and number of samples of the male Egyptian mongoose specimens under study. ……… 150 Fig. 5.3. Ovarian weight (expressed as mg/100g of total body weight) of 157 adult females of the Egyptian mongoose over month. (n) is the number of females in each month. Vertical lines represent the standard error of the mean. … 152 Fig. 5.4. Length and width of ovarian of 157 adult females of the Egyptian mongoose over month. (n) is the number of females in each month. Vertical lines represent the standard error of the mean. ……… 152 Fig. 5.5. Means of 269 Egyptian mongoose ovarian weight (expressed as mg/100g of total body weight) over season. Vertical bars denote 95% confidence intervals. ……….. 154 Fig. 5.6. Scatterplot of 269 Egyptian mongoose ovarian weight (expressed as mg/100g of total body weight) observed for NDVI. Dashed lines denote 95% confidence intervals. Ovarian weight = 1.581+1.481x ………... 155
Fig. 5.7. Scatterplot of 269 Egyptian mongoose ovarian weight (expressed as mg/100g of total body weight) observed for spleen weight (expressed as g/100g body weight). Dashed lines denote 95% confidence intervals. Ovarian weight = 2.1555+0.4241x………... 155 Fig. 5.8. Number of pregnant females of the Egyptian mongoose by month. (n=20) ……….. 157 Fig. 5.9. Number of pregnant females of the Egyptian mongoose among regions by month. (n=20) ………. 157 Fig. 5.10. Number of litters with n embryos of the Egyptian mongoose. (n=20) ... 158 Fig. 5.11. Number of litters with n embryos of the Egyptian mongoose among regions. (n=20) ……… 158 Fig. 5.12. Number of lactating females of the Egyptian mongoose by month. (n=10) ……….. 159 Fig. 5.13. Testes weight (expressed as mg/100g of total body weight) of 116 adult males of the Egyptian mongoose over month. (n) is the number of males in each month. Vertical lines represent the standard error of the mean. ………. 160 Fig. 5.14. Length and width of testes of 116 adult males of the Egyptian mongoose over month. (n) is the number of males in each month. Vertical lines represent the standard error of the mean. ……… 161 Fig. 5.15. Means of 238 Egyptian mongoose testes weight (expressed as mg/100g of total body weight) across regions. Vertical bars denote 95% confidence intervals. ……… 164 Fig. 5.16. Means of 238 Egyptian mongoose testes weight (expressed as mg/100g of total body weight) across age class. Vertical bars denote 95% confidence intervals. ……… 164 Fig. A1.1. Means of number of hectares of urban, rice fields, shrubs, inland water bodies, vineyards and orchards, coniferous, broadleaved and mix forests, and agriculture areas observed for each region of Egyptian mongoose sample location. Vertical bars denote 95% confidence intervals. ………... 200 Fig. A1.2. Means of average annual temperature and annual rainfall value observed for each region of Egyptian mongoose sample location. Vertical bars denote 95% confidence intervals. ……… 202
Fig. A1.3. Means of altimetry value, distance in meters of river network, number of inhabitants per km2, distance in meters of road network, observed for each region of Egyptian mongoose sample location. Vertical bars denote 95% confidence intervals. ……… 203 Fig. A1.4. Scatterplot of NDVI (primary productivity) observed for each region of Egyptian mongoose sample location. NDVI = 81.0499-0.7901*x ………. 204 Fig. A5.1. Categorization of Egyptian mongoose’s skulls using an age classification based on dental development analysis. (Juvenile type I: skull without molars and with only 32 teeth; Juvenile type II: skull with 40 teeth, but includes at least one milk tooth; Sub-adult: skull with 40 definitive teeth, but some still under development; Adult: skull with fully developed definitive teeth, with all the definitive teeth completely closed at its base). ………. 229 Fig. A5.2. New locations of reptiles in Portugal through Egyptian mongoose diet study. [Map adapted from Loureiro, A., Ferrand de Almeida, N., Carretero, M.A. & Paulo, O.S. (Eds.) (2008). Atlas dos Anfíbios e Répteis de Portugal. Instituto da Conservação da Natureza e da Biodiversidade. Lisboa.] ………... 231
LIST OF TABLES
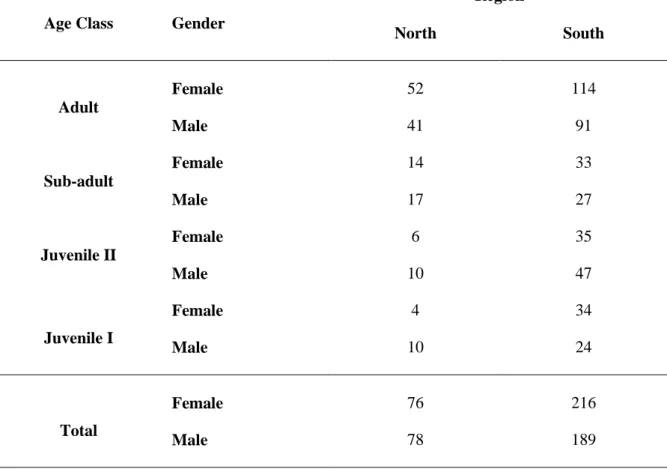
Table 2.1. Number of Egyptian mongoose samples obtained in each study region (north and south of Tagus River), by age class and gender. ………... 34 Table 2.2. Biometrics of adult Egyptian mongoose (BW – Body Weight; STL – Snout-Tail Length; TL – Tail Length; HBL – Head and Body Length; RHLL – Right Hind Leg Length; RHFL – Right Hind Foot Length; SH – Shoulder Height; NP – Neck Perimeter; HW – Head Width), whose values are given as mean ± standard deviation (top), range (bottom). n is the sample size; F the statistic value and p the significance value of one way ANOVA test. (p significant values at the 0.0056 level with a Bonferroni adjustment for alpha are in bold). ………... 35 Table 2.3. Biometrics of sub-adult Egyptian mongoose (BW – Body Weight; STL – Snout-Tail Length; TL – Tail Length; HBL – Head and Body Length; RHLL – Right Hind Leg Length; RHFL – Right Hind Foot Length; SH – Shoulder Height; NP – Neck Perimeter; HW – Head Width), whose values are given as mean ± standard deviation (top), range (bottom). n is the sample size; F the statistic value and p the significance value of one way ANOVA test. (p significant values at the 0.0056 level with a Bonferroni adjustment for alpha are in bold). ………... 36 Table 2.4. Biometrics of juvenile type II Egyptian mongoose (BW – Body Weight; STL – Snout-Tail Length; TL – Tail Length; HBL –Head and Body Length; RHLL – Right Hind Leg Length; RHFL – Right Hind Foot Length; SH – Shoulder Height; NP – Neck Perimeter; HW – Head Width), whose values are given as mean ± standard deviation (top), range (bottom). n is the sample size; F the statistic value and p the significance value of one way ANOVA test. (p significant values at the 0.0056 level with a Bonferroni adjustment for alpha are in bold). ………... 37 Table 2.5. Biometrics of juvenile type I Egyptian mongoose (BW – Body Weight; STL – Snout-Tail Length; TL – Tail Length; HBL – Head and Body Length; RHLL – Right Hind Leg Length; RHFL – Right Hind Foot Length; SH – Shoulder Height; NP – Neck Perimeter; HW – Head Width), whose values are given as mean ± standard deviation (top), range (bottom). n is the sample size; F the statistic value and p the significance value of one way ANOVA test. (p significant values at the 0.0056 level with a Bonferroni adjustment for alpha are in bold). ………... 38
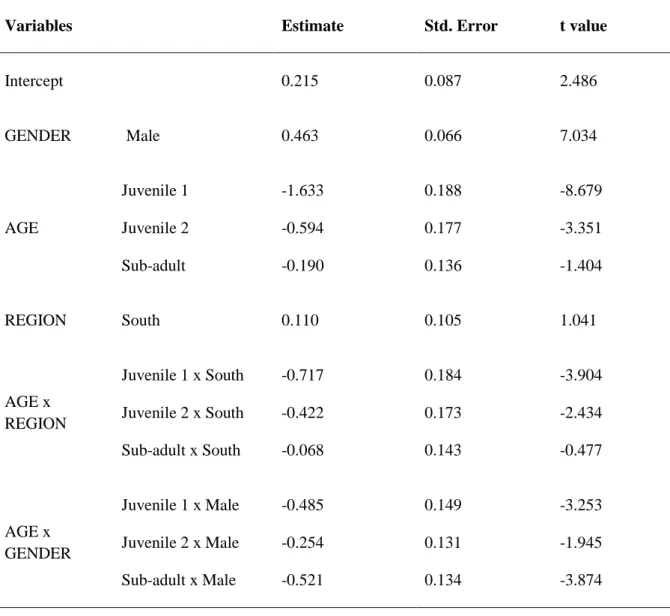
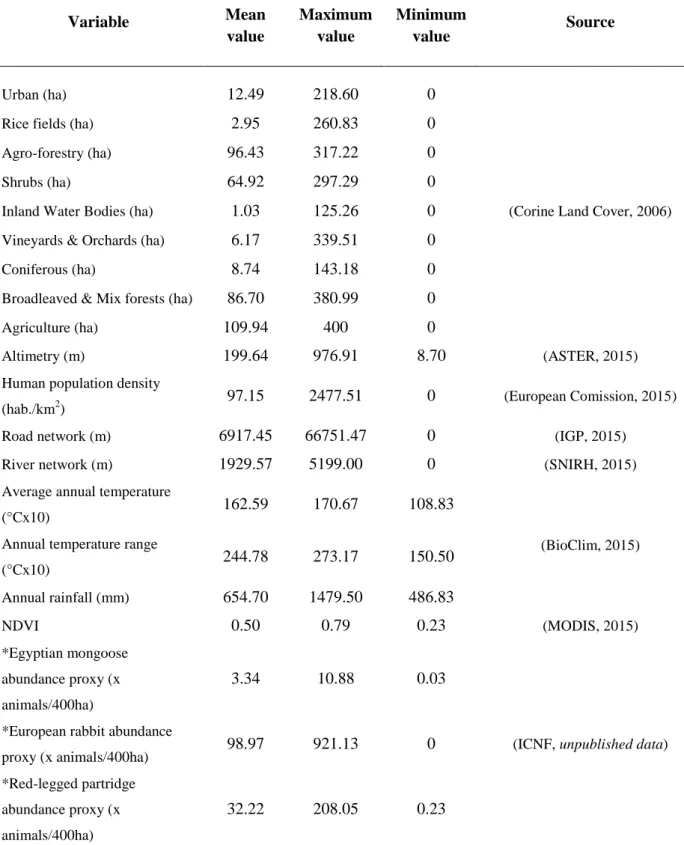
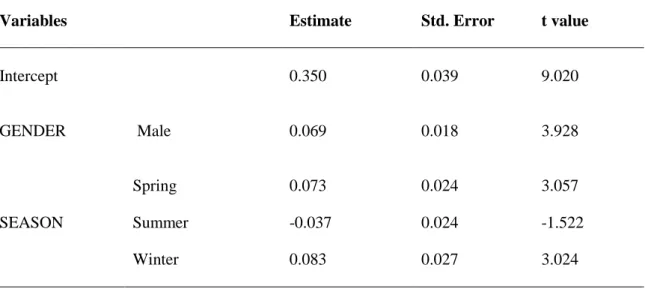
Table 2.6. Results obtained from GLMM analyses to examine gender, age and/or region variables as categorical predictors of body size (explained as PCA1 retained by PCA analysis of six measured biometrics and weight) of Egyptian mongoose. District was used as random factor to control for spatial autocorrelation of samples. (df – degrees of freedom; MS – Mean square; F – statistic value; p significant values are in bold). ………. 39 Table 2.7. Model selection, using AICc, for the effect of age, region, gender and their interactions on body size (PCA1 of six measured biometrics and weight) of the Egyptian mongoose in Portugal. ΔAICc is the difference between the AIC yielded by each model and the lowest AICc that is considered the best model; df – degrees of freedom. ……….. 40 Table 2.8. Effects of the model considered as explanatory for body size (PCA1 of six measured biometrics and weight) of the Egyptian mongoose in Portugal. ... 41 Table 2.9. Biometrics of adult Egyptian mongoose (BW – Body Weight; STL – Snout-Tail Length; TL – Tail Length; HBL – Head and Body Length; RHLL – Right Hind Leg Length; RHFL – Right Hind Foot Length; SH – Shoulder Height; NP – Neck Perimeter; HW – Head Width), whose values are given as mean for both genders. Each region is related with a study: a) Portugal – this study; b) Grândola (Portugal) – Rosalino et al., 2005; c) Doñana (Spain) – Palomares & Delibes, 1992; d) Israel – Ben-Yaacov & Yom-Tov, 1983. (The values from this study are presented in bold; n is the sample size.). ………... 43 Table 3.1. Mean, maximum and minimum values of environmental and ecological variables. ……… 67 Table 3.2. Number of Egyptian mongoose samples obtained for each region, north and south of Tagus River, within age class and gender information. ……… 71 Table 3.3. Model selection using AICc for the effect of age, region, season, gender, and their interactions, Egyptian mongoose, European rabbit and red-legged partridge abundances, annual rainfall and body condition, with district as random factor, on spleen weight (expressed as g/100g body weight) of the Egyptian mongoose in Portugal. ΔAICc is the difference between the AIC yielded by each model and the lowest AICc that is considered the best model; df - degrees of freedom. ………... 72 Table 3.4. Effects of the model considered as explanatory for spleen weight (expressed as g/100g body weight) of the Egyptian mongoose in Portugal. …….. 72
Table 3.5. Model selection using AICc for the effect of age, region, season, gender, and their interactions, spleen weight (expressed as g/100 g body weight), subcutaneous fat and visceral fat, with district as random factor, on body condition (residuals from the regression of total body weight against total body length) of the Egyptian mongoose in Portugal. ΔAICc is the difference between the AIC yielded by each model and the lowest AICc that is considered the best model; df - degrees of freedom. ……….. 74 Table 3.6. Models considered as explanatory on body condition (residuals from the regression of total body weight against total body length) of the Egyptian mongoose in Portugal. ΔAICc is the difference between the AIC yielded by each model and the lowest AICc that is considered the best model; df – degrees of freedom. ………... 75 Table 3.7. Model-averaged coefficients for the effects of SPLEEN WEIGHT, VISCERAL and SUBCUTANEOUS FAT, AGE and GENDER on body condition (residuals from the regression of total body weight against total body length) of the Egyptian mongoose in Portugal. ………... 76 Table 4.1. Number of samples of Egyptian mongoose obtained from each region, north and south of Tagus River, within age class and gender information. ……… 105 Table 4.2. Diet composition of the Egyptian mongoose in Portugal. (NS - number of stomachs where each food item was found; MNI - minimum number of individuals of each food item; RFO - percentage of relative frequency of occurrence; B - percentage of biomass consumed; NI – not identified; * - game species). ………... 106 Table 4.3. Models considered as explanatory on mammal, reptile, amphibian and invertebrate food items of the Egyptian mongoose in Portugal. ΔAICc is the difference between the AIC yielded by each model and the lowest AICc that is considered the best model; df – degrees of freedom. ……….. 110 Table 4.4. Effects of the model and variables considered as explanatory for mammal food item of the Egyptian mongoose in Portugal. ……… 112 Table 4.5. Model-averaged coefficients for the effects of explanatory variables on reptile food item of the Egyptian mongoose in Portugal. ………... 115 Table 4.6. Model-averaged coefficients for the effects of explanatory variables on amphibian food item of the Egyptian mongoose in Portugal. ……… 117
Table 4.7. Model-averaged coefficients for the effects of explanatory variables on invertebrate food item of the Egyptian mongoose in Portugal. ……….. 120 Table 5.1. Number of samples of Egyptian mongoose obtained from each region, north and south of Tagus River, within age class and gender information. ……… 151 Table 5.2. Models considered as explanatory on ovarian weight (expressed as mg/100g body weight) of the Egyptian mongoose in Portugal. ΔAICc is the difference between the AIC yielded by each model and the lowest AICc that is considered the best model; df – degrees of freedom. ……….. 153 Table 5.3. Model-averaged coefficients for the effects of explanatory variables on ovaries weight of the Egyptian mongoose in Portugal. ……….. 154 Table 5.4. Models considered as explanatory on testes weight (expressed as mg/100g body weight) of the Egyptian mongoose in Portugal. ΔAICc is the difference between the AIC yielded by each model and the lowest AICc that is considered the best model; df – degrees of freedom. ……….. 162 Table 5.5. Model-averaged coefficients for the effects of explanatory variables on testes weight of the Egyptian mongoose in Portugal. ……… 162 Table A1.1. Loadings for each variable of body measure in PCA ………. 199 Table A2.1. Results obtained from GLMM analyses to examine gender, age, region and/or season variables as categorical predictors of spleen weight (expressed as g/100 g body weight) of Egyptian mongoose. District was used as random factor to control for spatial autocorrelation of samples. Subcutaneous and visceral fat, Egyptian mongoose, European rabbit and red-legged partridge abundances, land use (urban, rice fields, agro-forestry, shrubs, inland water bodies, vineyards and orchards, coniferous, broadleaved and mix forests, agriculture areas), altimetry, human population density, road network, river network, average annual temperature, annual temperature range, annual rainfall, Normalized Difference Vegetation Index (NDVI), body size (PCA1 of all measured biometrics and weight) and body condition (residuals from the regression of total body weight against total body length) were used as continuous predictors. [df – degrees of freedom; MS – mean square; F – statistic value; p – corresponding significance value. (p significant values at the 0.05 level are in bold).]. ……….. 205
Table A2.2. Results obtained from GLMM analyses to examine gender, age, region and/or season variables as categorical predictors of body condition (residuals from the regression of total body weight against total body length) of Egyptian mongoose. District was used as random factor to control for spatial autocorrelation of samples. Spleen weight (expressed as g/100 g body weight), subcutaneous and visceral fat, Egyptian mongoose, European rabbit and red-legged partridge abundances, land use (urban, rice fields, agro-forestry, shrubs, inland water bodies, vineyards and orchards, coniferous, broadleaved and mix forests, agriculture areas), altimetry, human population density, road network, river network, average annual temperature, annual temperature range, annual rainfall, Normalized Difference Vegetation Index (NDVI) and body size (PCA1 of all measured biometrics and weight) were used as continuous predictors. [df – degrees of freedom; MS – mean square; F – statistic value; p – corresponding significance value. (p significant values at the 0.05 level are in bold).]. ………... 207 Table A3.1. Results obtained from GLMM analyses to examine gender, age, region and/or season variables as categorical predictors of mammals’ food item of Egyptian mongoose. Province was used as random factor to control for spatial autocorrelation of samples. Spleen weight (expressed as g/100g body weight), subcutaneous and visceral fat, Egyptian mongoose, European rabbit and red-legged partridge abundances, land use (urban, rice fields, agro-forestry, shrubs, inland water bodies, vineyards and orchards, coniferous, broadleaved and mix forests, agriculture areas), altimetry, human population density, road network, river network, average annual temperature, annual temperature range, annual rainfall, Normalized Difference Vegetation Index (NDVI), body size (PCA1 of biometrics and weight) and body condition (residuals from the regression of total body weight against total body length) were used as continuous predictors. (df – degrees of freedom; MS – Mean square; F – statistic value; p significant values are in bold) ………... 210
Table A3.2. Results obtained from GLMM analyses to examine gender, age, region and/or season variables as categorical predictors of reptiles’ food item of Egyptian mongoose. Province was used as random factor to control for spatial autocorrelation of samples. Spleen weight (expressed as g/100g body weight), subcutaneous and visceral fat, Egyptian mongoose, European rabbit and red-legged partridge abundances, land use (urban, rice fields, agro-forestry, shrubs, inland water bodies, vineyards and orchards, coniferous, broadleaved and mix forests, agriculture areas), altimetry, human population density, road network, river network, average annual temperature, annual temperature range, annual rainfall, Normalized Difference Vegetation Index (NDVI), body size (PCA1 of biometrics and weight) and body condition (residuals from the regression of total body weight against total body length) were used as continuous predictors. (df – degrees of freedom; MS – Mean square; F – statistic value; p significant values are in bold) ………... 212 Table A3.3. Results obtained from GLMM analyses to examine gender, age, region and/or season variables as categorical predictors of amphibians’ food item of Egyptian mongoose. Province was used as random factor to control for spatial autocorrelation of samples. Spleen weight (expressed as g/100g body weight), subcutaneous and visceral fat, Egyptian mongoose, European rabbit and red-legged partridge abundances, land use (urban, rice fields, agro-forestry, shrubs, inland water bodies, vineyards and orchards, coniferous, broadleaved and mix forests, agriculture areas), altimetry, human population density, road network, river network, average annual temperature, annual temperature range, annual rainfall, Normalized Difference Vegetation Index (NDVI), body size (PCA1 of biometrics and weight) and body condition (residuals from the regression of total body weight against total body length) were used as continuous predictors. (df – degrees of freedom; MS – Mean square; F – statistic value; p significant values are in bold) ……… 214
Table A3.4. Results obtained from GLMM analyses to examine gender, age, region and/or season variables as categorical predictors of invertebrates’ food item of Egyptian mongoose. Province was used as random factor to control for spatial autocorrelation of samples. Spleen weight (expressed as g/100g body weight), subcutaneous and visceral fat, Egyptian mongoose, European rabbit and red-legged partridge abundances, land use (urban, rice fields, agro-forestry, shrubs, inland water bodies, vineyards and orchards, coniferous, broadleaved and mix forests, agriculture areas), altimetry, human population density, road network, river network, average annual temperature, annual temperature range, annual rainfall, Normalized Difference Vegetation Index (NDVI), body size (PCA1 of biometrics and weight) and body condition (residuals from the regression of total body weight against total body length) were used as continuous predictors. (df – degrees of freedom; MS – Mean square; F – statistic value; p significant values are in bold) ……… 216 Table A3.5. Model selection, using AICc, for the effect of age, region, season, gender, region x age, region x gender, region x season, gender x age, gender x season, age x season, NDVI, spleen weight, body size and body condition on mammals, reptiles, amphibians and invertebrates food items of the Egyptian mongoose in Portugal. Rice fields (land use) was used in reptiles models only, annual rainfall in amphibians models only and altimetry and average annual temperature in invertebrates models only. ΔAICc is the difference between the AIC yielded by each model and the lowest AICc that is considered the best model; df – degrees of freedom. ………..
218 Table A4.1. Results obtained from GLMM (Generalized Linear Mixed Models) analyses to examine age, region and/or season variables as categorical predictors of ovaries weight of Egyptian mongoose. Province was used as random factor to control for spatial autocorrelation of samples. Spleen weight (expressed as g/100g body weight), subcutaneous and visceral fat, Egyptian mongoose, European rabbit and red-legged partridge abundances, land use (urban, rice fields, agro-forestry, shrubs, inland water bodies, vineyards and orchards, coniferous, broadleaved and mix forests, agriculture areas), altimetry, human population density, road network, river network, average annual temperature, annual temperature range, annual rainfall, Normalized Difference Vegetation Index (NDVI) and body condition (residuals from the regression of total body weight against total body length) were used as continuous predictors. (df – degrees of freedom; MS – Mean square; F – statistic value; p significant values are in bold). ………..
Table A4.2. Results obtained from GLMM (Generalized Linear Mixed Models) analyses to examine age, region and/or season variables as categorical predictors of testes weight of Egyptian mongoose. Province was used as random factor to control for spatial autocorrelation of samples. Spleen weight (expressed as g/100g body weight), subcutaneous and visceral fat, Egyptian mongoose, European rabbit and red-legged partridge abundances, land use (urban, rice fields, agro-forestry, shrubs, inland water bodies, vineyards and orchards, coniferous, broadleaved and mix forests, agriculture areas), altimetry, human population density, road network, river network, average annual temperature, annual temperature range, annual rainfall, Normalized Difference Vegetation Index (NDVI) and body condition (residuals from the regression of total body weight against total body length) were used as continuous predictors. (df – degrees of freedom; MS – Mean square; F – statistic value; p significant values are in bold). ………..
225 Table A4.3. Model selection, using Akaike’s Information Criterion (AICc), for the effect of age, region, season, region x age, region x season, age x season, NDVI, spleen weight, body condition on ovaries and testes weight (expressed as mg/100g body weight). [European rabbit and red-legged partridge abundances, and land use (rice fields) effects were used only for ovaries weight]. Province was used as random factor. ΔAICc is the difference between the AIC yielded by each model and the lowest AICc that is considered the best model; df – degrees of freedom. ………..
CHAPTER 1
1. GENERAL INTRODUCTION
It is now widely recognized that global changes and biodiversity are interconnected (Convention on Biological Diversity, 2012). Biodiversity is affected by these changes, with subsequent negative consequences for humans (Parry et al., 2007; Convention on Biological Diversity, 2012). However, biological diversity contributes to mitigation and adaptation to global changes through the wide range of ecosystem services that it supports (Parry et al., 2007; Convention on Biological Diversity, 2012). The conservation and sustainable management of biodiversity are thus essential to face such system deviations (Convention on Biological Diversity, 2012). Habitat adjustments and species distributions have cumulatively been reflecting the effects of global change (Convention on Biological Diversity, 2012), allowing some opportunistic species to occupy new niches (Logan, 2007). Opportunistic species are less sensitive to resource limitations and population sizes can augment along with favorable events (Levinton, 1970). The population size increase of opportunistic species concurs with the decline of species with more specific ecological niches, potentially threatening the ecological balance of an ecosystem and, thus, jeopardizing biodiversity (Dutra et al., 2012).
Biological encroachments are a major threat to human health, agriculture and ecosystem sustainability (Hampton et al., 2004), resulting in the reduction or extinction of native species (Santos et al., 2007). Once established, opportunistic species may cause an irreversible event with serious consequences on the environment in new distributions. Ecological monitoring allows the application of more effective and specific actions in the management of wild populations of opportunistic species. The identification of the resource use patterns of each species is a fundamental step to unravel how the ecosystem is organized, the pattern of species coexistence and the niche structure (Tokeshi, 1999). In this context, the study of trophic ecology is fundamental, because the diet has a crucial dimension on ecological niche (Krebs, 1989). Knowledge about the diet contributes to the understanding of dietary preferences and the conditions that allow the expansion and the success of a species (Rosalino et al., 2009). Reproductive ecology is another factor to take into consideration, in order to understand the effect of management actions on litter size, the duration of the fertile period during the year, or body weight of females in the different
periods (Abe et al., 2006). Animal reproductive performance may also be an indicator of environmental health.
The Egyptian mongoose (Herpestes ichneumon Linnaeus, 1758) is one of the most abundant, natural, mammalian colonizers of mainland Portugal (see Gaubert et al., 2011). The mitochondrial diversity of the Egyptian mongoose across the Iberian Peninsula, where the species is currently expanding north-west, confirmed its long-term presence in the region, evidenced by haplotype segregation and strong differentiation between Iberian and North African populations (Barros et al., 2016a). Evidence of substructure and significant genetic differentiation within the Northern and Southern population divided by Tagus River were recorded, suggesting that the river acted as a semi-permeable barrier, possibly leading to genetic differentiation between the two populations (Barros et al., 2016b). The distribution area of this carnivore was once concentrated in the south of the Portuguese territory (Borralho et al., 1996). However, the species has been expanding to the north, and from the inland to the coast, a phenomenon that still is in progress (Barros & Fonseca, 2011; Barros et al., 2015). Currently, it is already present on Atlantic biogeographical region, where it finds new environmental conditions (Figures 1.1 and 1.2).
Figure 1.2. Representation of the biogeographic regions within mainland Portugal (adapted from Rivas-Martínez et al., 2004).
Figure 1.3. Current distribution of the Egyptian mongoose (Herpestes ichneumon) in Portugal. (data from the present study and data adapted from Barros et al., 2015).
Over the past 80 years, it is estimated that the Egyptian mongoose has undergone successive expansions and contractions in its distribution area in Portugal (Barros & Fonseca, 2011). During the 1930s, the loss of suitable habitat, thick Mediterranean shrubland maquis, due to increased cereal production, and changes in land use jointly promoted the contraction of the occupancy area of this species (Barros & Fonseca, 2011). On the other hand, the recent abandonment of agricultural land, rural depopulation (Borralho et al., 1996), and the variation in average temperatures and annual rainfall (Barros et al., 2015) have cumulatively contributed to the recent occupation of new territories.
Figure 1.4. Scope of the expansion of the Egyptian mongoose (Herpestes ichneumon) in the last 30 years in Portugal according to inquiries and registries (data adapted from Barros
et al., 2015).
The conservation status of Egyptian mongoose is Least Concern (LC) in Portugal (Cabral
et al., 2005), as in global IUCN Red List (Do Linh San et al., 2016). According to the
“Decreto-Lei nº 227-B/2000” and “Decreto-Lei nº202/2004” with the new wording given by “Decreto-Lei nº 201/2005”, it is listed as a game species in the Portuguese territory, where a large number of Egyptian mongoose are culled in each hunting season (ICNF,
consider it responsible for the predation of the most important small game species, which include the European rabbit (Oryctolagus cuniculus) and the red-legged partridge (Alectoris rufa). Scientific studies point to it being an opportunistic and generalist predator, capturing more abundant, available and vulnerable prey, according to occasion (Delibes et
al., 1984; Palomares & Delibes, 1998). Periods of activity of this carnivore coincide with
periods of resting of most prey species (Palomares & Delibes, 1992a), thus being more active during the day, and inactive from sunset until an hour or two before dawn, with two peaks of activity registered, one in the morning and another in the afternoon (Delibes & Beltran, 1985). Prey are located and captured by an intense exploration activity, on the ground or by digging frequently (Palomares & Delibes, 1991; Palomares & Delibes, 1998). Typically, the Egyptian mongoose avoids open areas and prefers dense vegetation, with great cover and protection, where exploratory activities predominate, in habitats such as riparian corridors in Mediterranean environments, brambles and xerophytic scrubland, which are very productive habitats (Palomares & Delibes, 1990; Palomares & Delibes, 1991b; Palomares & Delibes, 1993; Virgós, 2001; Santos et al., 2011).
Figure 1.5. Mediterranean maquis - characteristic habitat of the Egyptian mongoose (Herpestes ichneumon).
Shrub cover over their burrows has three main functions: improvement of the microclimate, protection from trampling by larger species and reduction of the risk of predation (Blaum et al., 2007). Egyptian mongoose use latrines next to resting sites and increase their scent marking behavior when they are mating, in January and February (highest peak), and in September and October, when family groups are larger (Palomares, 1993). During the breeding season, behaviors and olfactory communication reach their peak (Ruiz-Olmo, 1997).
Up to the present moment, this species has not been subject to thorough investigation in Portugal, particularly on its fundamental and reproductive ecology. There is a study concerning biometrics that is restricted to the Serra de Grândola region (Rosalino et al., 2005). At national scale, there is only one study of trophic ecology that did not contemplate expansion regions (Rosalino et al., 2009). Most of the knowledge on Egyptian mongoose biology comes from studies conducted on populations from southwestern Spain (eg. Delibes et al., 1984; Palomares & Delibes, 1992b; Palomares & Delibes, 1993) and Israel (Ben-Yaacov & Yom-Tov, 1983). The work enclosed in this dissertation aimed to collect data regarding trophic ecology, reproductive biology and the phenotypic and morphological characteristics of the Egyptian mongoose, through a widespread sampling effort. This effort succeeded to cover the main habitats of the two biogeographic regions of the Iberian Peninsula where the species is distributed, including its previous distribution, and the newly occupied territories. These ecological data are herein combined with the specimen region, bioclimatic variables, habitat type, land use, or seasonality. Six hundred and seventy-eight wild Egyptian mongoose specimens were collected from 13 out of 17 districts of mainland Portugal where the species is distributed. Their origin was from hunting activities (645 specimens) and from accidental road kills (33 specimens), in compliance with legal requirements and with permits from the competent authorities. Depending on the origin of the harvest, each sample was assigned to a particular region, north or south of the Tagus River, which may be considered a geographical barrier for the species, bearing in mind that, until the 90s (of the XX century), the distribution of the Egyptian mongoose was more concentrated in the south of the Tagus River (Borralho et
al., 1996; Barros & Fonseca, 2011; Barros et al., 2016b). Regarding land cover and habitat
characteristics of each region, flora found in the north is mainly characterized by monoculture of Eucaliptus sp., which replaced a large part of the areas occupied by Pinus
pinaster, Quercus robur, Salix sp. or Alnus glutinosa (Alves et al., 2009). In the south, the
prevailing flora consists of Quercus suber, with well-populated Olea europaea and
Quercus ilex areas (Alves et al., 2009). In contrast with the south, the north is also
characterized by higher human density, more kilometers of road, much more fragmented and altered by human action habitats, greater number of ridges with higher altitude, more rocky areas, more hydrography, lower temperatures, higher rainfall (see CIGeoE, 2016; INE, 2016) and lower densities of prey target species (Instituto da Conservação da Natureza e das Florestas, unpublished data; Loureiro et al., 2008). To compare the mongoose population from historic distribution (South of Tagus River) with the population in expansion (North of Tagus River) a battery of environmental, climatic and ecological variables was provided to complement study area information and to give insights on the region differences that each population faces. These variables are the number of hectares of each habitat type (urban, rice fields, agro-forestry, shrubs, inland water bodies, vineyards and orchards, coniferous, broadleaved and mix forests and agriculture areas) retrieved from Corine Land Cover (2006). Mean altimetry value (data SRTM, NASA, resolution of 30 meters) gathered using the ASTER Global Digital Elevation Model platform (http://gdem.ersdac.jspacesystems.or.jp/) (ASTER, 2016). Number of inhabitants per km2 in each grid using data from Eurostat per kilometer (http://epp.eurostat.ec.europa.eu/) (European Commission, 2016). Distance in meters of road and hydrographic network, respectively with data from Instituto Geográfico Português (www.igeo.pt/) and SNIRH (http://snirh.apambiente.pt/) (SNIRH, 2016). Average annual temperature and annual temperature range in degrees multiplied by 10, and annual rainfall in mm gathered from BioClim (http://www.worldclim.org/bioclim) at 30 arc-second resolution (Hijmans et al., 2005). Primary productivity based on Normalized Difference Vegetation Index (NDVI) of each collected sample location used as a proxy of primary productivity (Pettorelli, 2013). The NDVI value for each record was calculated from satellite images supplied by MODIS (2016) (Moderate Resolution Imaging Spectroradiometer; http://modis.gsfc.nasa.gov) at a spatial resolution of 250m. Proxy of Egyptian mongoose, European rabbit and Red-legged partridge abundances (x animals/400ha) calculated through the number of animals hunted in each area and during the month, where and when each Egyptian mongoose sampled was collected (data from ICNF, unpublished data). Each variable was represented by mean
values of the 2 × 2 km grid cell, considering the vital area of the Egyptian mongoose (Palomares & Delibes, 1991a).
In light of current knowledge, this work is unprecedented, as no other research study on opportunistic carnivorous mammals produced or combined such a wide variety of biological data with physical components of the environment to unravel intrinsic ecological and demographic processes, from such a large sample. This knowledge is anticipated to be useful in the management of this species in the Portuguese territory and simultaneously in the understanding and monitoring of the impacts caused by global changes.
The expansion of Egyptian mongoose populations, that has been taking place in recent decades (Barros & Fonseca, 2011; Barros et al., 2015), enabled us to collect specimens around the Ria de Aveiro, in the shrubs, rice paddies and wetlands of Rio Mondego, and even in the agricultural valleys of Castro Daire, which would be unlikely 30 years ago. In fact, this study provides baseline data for future comparisons. This is a fundamental study because: firstly, the species is in an expansion phase (Barros & Fonseca, 2011), with evidence of still being exploring new distributions, such as the district of Aveiro (personal
observation; Bandeira et al., 2013), and of its entry into a new biogeographic region;
secondly, because there are no previous studies on biometric parameters or on reproductive patterns; thirdly, because the Portuguese territory is witnessing the human exodus from villages to cities, and with it, the abandonment of rural areas, increasing the suitable habitat for the species (Barros & Fonseca, 2011); Finally, all specimens of the present study were collected before the reintroduction of the Iberian lynx (Lynx pardinus) in Portugal in 2014, a competitor which can kill Egyptian mongooses to decrease competition for resources (Palomares et al., 1995; Ruiz-Olmo, 2012).
1.1. MAIN OBJECTIVES
Considering the unstoppable course of global changes and knowing that the Egyptian mongoose is expanding across the Portuguese territory, the population dynamics and expansion odds of the species are expected to be regulated and shaped by a combination of genetic and ecological characteristics,together with intrinsic demographic processes. This
work thus intended to enlighten the ecological structure of natural populations of mongoose in relation to its historic distribution and the new expansion areas and to expose how global mechanisms, such as natural environment factors and climate change, may affect the performance and distribution of plastic/opportunistic species, potentially assisting the management of wild populations in the future.
The identification of patterns in resource use by the Egyptian mongoose was also pursued as a fundamental step to unravel key ecological processes of this species. The following objectives were thus outlined:
- to analyze differences in biometrics and body mass in relation to life-history stage, dissecting variations with respect to gender and age structure, between Portuguese regions including historic distribution (south of Portugal) and expansion areas (northern Portugal), throughout the seasons, and seeking potential interactions with the type of habitat and land use, human pressure, climatic conditions, or ecological parameters. Given the different biotic and abiotic factors in the expansion and historic areas, we hypothesize that they will induce differences in biometric variables between these two populations of mongooses; - to analyze and compare body condition and spleen weight (as a predictor of immune competence) with individual traits such as age structure and gender, across Portuguese regions including historic distribution (south of Portugal) and expansion areas (northern Portugal), throughout the seasons, relating them to the type of habitat and land use, human pressure, climatic conditions, or ecological parameters. Since ecological conditions of the Egyptian mongoose from south of the Tagus River (historic) are more favorable than those from north (expansion), we hypothesized there would be differences in spleen weight and body condition between both populations. We included both variables in our analysis to control for increases in spleen weight due to pathological conditions, which should generally be accompanied by a poor body condition score. Further, we expected geographic and seasonal differences, as well as gender dimorphism, to influence spleen weight and body condition;
- to characterize and compare the diet of two major subpopulations, in the historic and expansion distribution areas (Northern and Southern of Tagus River) in relation to life-history stage, studying the effects exerted by environmental factors, human pressure, or
ecological parameters; to ascertain if the Egyptian mongoose diet is essentially based on the consumption of small game species, and to gain a notion of the ecological footprint of the species. Due to the wide array of ecological differences between the historic and expansion areas, we hypothesized that these populations would have different diets. It is important to identify these differences due to their influence on the species potential to impact the ecosystems, either by consuming key prey species in the historic area, or by disrupting ecological balances in the expasion area. Secondly, we hypothesized there would be geographical, seasonal and gender differences in diet. Thirdly, we presume that animals with better condition and body size, greater spleen weight and living in areas with higher primary productivity will capture and consume larger and more energetic prey, while animals with divergent biological parameters will invest in the intake of less energetic prey, which require less effort in capture and manipulation. Finally and with the goal of clarifying the general doubts within the hunting community we aim to ascertain if game species are indeed the most commonly consumed prey by mongooses;
- to analyze the reproductive systems of both genders, identifying litter size or length of the fertile period and compare these reproductive indicators across regions of historic and expansion distribution, ascertaining the influence of environmental and human factors or ecological parameters, and establishing if there is an energetic cost associated with reproductive success. Here, we hypothesized that males and females exhibit variation in the weight of their reproductive organs throughout the year that are indicative of the periods in which they are active or inactive. Further, we predict that reproductive timings vary geographically, and are influenced by body condition, food resources and immune function. Thirdly, we hypothesized that there is a trade-off between resource allocation in reproduction and immune competence, and that these trade-offs are gender-specific.
This study used state of the art ecological methods tackling the ecological and biological events frame of a species in expansion in Portugal. The results gathered here might have applicability to inform decisions on species management, thus providing a critical model for science, society, hunting activity and the management of wildlife that face enduring global changes.