Sequential Injection Kinetic Flow Assay for Monitoring
Glycerol in a Sugar Fermentation Process
by
Saccharomyces cerevisiae
Karina B. Hueso Domínguez&Ildikó V. Tóth&M. Renata S. Souto&Filipa Mendes& Cándido García De María&Isabel Vasconcelos&António O. S. S. Rangel
Abstract A sequential injection system to monitor glycerol in a Saccharomyces cerevisiae fermentation process was developed. The method relies on the rate of formation of nicotinamide adenine dinucleotide in its reduced form (NADH, measured spectrophotomet-rically at 340 nm) from the reaction of glycerol with NAD+cofactor, catalysed by the enzyme glycerol dehydrogenase present in solution. This procedure enables the determination of glycerol between 0.046 and 0.46 g/l, (corresponding to yeast fermentation samples with concentrations up to 50 g/l) with good repeatability (relative standard deviation for n=10 lower than 2.2% for three different samples) at a sampling frequency of 25/h. The detection and quantification limits using a miniaturised spectrophotometer were 0.13 and 0.44 mM, respectively. Reagent consumption was of 0.45μmol NAD+and 1.8 μg enzyme per assay, and the waste production was 2.8 ml per determination. Results obtained for samples were in agreement with those obtained with a high-performance liquid chromatography method.
Keywords Sequential injection analysis . Glycerol . Glucose fermentation . Saccharomyces cerevisiae . Kinetic method . Enzymatic assay
Introduction
During a fermentation process, monitoring and control of substrates and/or products is usually carried out to assure the quality of the final product. This is generally done by K. B. H. Domínguez : C. García De María
Facultad de Ciencias Químicas, Dpto. de Química Analítica, Nutrición y Bromatología, Universidad de Salamanca, Plaza de la Merced, s/n, Salamanca 37008, Spain
I. V. Tóth: M. R. S. Souto : F. Mendes : I. Vasconcelos : A.O.S.S. Rangel
CBQF/Escola Superior de Biotecnologia, Universidade Católica Portuguesa, Rua Dr. António Bernardino de Almeida, Porto 4200-072, Portugal
e-mail: [email protected]
M. R. S. Souto
Faculdade de Ciências da Saúde, Universidade Fernando Pessoa, Rua Carlos da Maia, 296, Porto 4200-150, Portugal
offline procedures—samples are taken at different time intervals and analytical measure-ments are performed in a laboratory environment using conventional instrumeasure-ments. This approach inhibits fast access to information about the state of the bio-process and prevents possible feedback actions to improve the quality of the process [1,2].
Glycerol is one of the major by-products of sugar fermentation by the yeast Saccharomyces cerevisiae. Glycerol synthesis enables the cell to use the excess of NADH produced during glycolysis in order to maintain its redox balance. Under normal fermentative conditions, glycerol is produced via the excess of NADH [3] or as a response to osmotic stress. The amount of glycerol produced by a wild strain of S. cerevisiae can reach 10 g/l under anaerobic conditions [4]. In the application presented in this study, glucose fermentation was carried out by the S. cerevisiae mutant strain HC42 [5] adapted to high glucose concentrations. This strain is the result of genetic engineering strategies focused on the redirection of metabolic fluxes and overexpression of the key enzymes of the glycerol pathway. The primary objective of the genetic engineering process was to achieve the maximum glycerol yield. Therefore, accurate and fast measurement of the amount of glycerol produced during the fermentation process is fundamental throughout these optimisation studies.
The produced glycerol can be used as a raw material for the production of 1,3 propanediol with great interest for the chemical and medical industry [6,7]. Nowadays, with the exponential increase of bio-fuel production, raw glycerol is produced in excess [8]; however, the quality and the quantity of other compounds present in the raw glycerol can compromise the success of a further bio-process aiming for the“green” production of fine chemicals [6]. Therefore, the production of glycerol via sugar fermentation fromD-glucose source has potential interest.
Routine methods for glycerol analysis include oxidation, esterification, ether formation, dehydration reaction and chromatographic procedures. However, when samples have a high matrix complexity and high background absorption signals, enzymatic methodologies are usually preferred. Kinetic assessment (continuous monitoring of the concentration change as a function of time) of glycerol in this type of samples presents clear advantages in overcoming potential matrix interferents and achieving adequate selectivity: being relative measurements, the background interference from the sample matrix is reduced, and as the reaction exhibits increased selectivity towards the target analyte, it results in more reliable analytical data. The interferences can be substances that are present in the sample and can cause over- or underestimation of the true analyte concentration. These species can be structurally related to the analyte, and interact with the assay reagents in similar way to the analyte or/and can produce spectral interference at the applied monitoring wavelength.
The genetically modified strain of the yeast S. cerevisiae used in the fermentation process analysed in this study, is capable of converting 100 g/l of glucose to around 50 g/l of glycerol, corresponding to approximately a 1:1 molar ratio. This striking capacity will result in a high temporal variation of the sample matrix composition. Therefore, the use of a kinetic method would be a valuable alternative.
Several works were recently reviewed [9] on the use of automatic glycerol biosensor procedures for different applications. Most of them are focused on monitoring of glycerol content in wine and beer samples. Nevertheless, glycerol is a biologically active compound, and glycerol biosensors have also been used for biomedical, clinical and pharmaceutical purposes. In most of these procedures, the biocatalyst (single or multienzyme system) is immobilised on various supports using different immobilisation techniques [10]. However, when repeated analyses are necessary (as is the case of continuous monitoring of a compound), enzyme stability is an essential issue. According to the literature [9], the
continual operation stabilities of these biosensors vary from few hours up to several days, and the storage stabilities were up to several months. In the approach presented in this study, this situation is avoided using enzyme in solution as a fresh aliquot of this reagent is applied in each determination [11].
In this study, a sequential injection analysis (SIA) [12] system based on kinetic measurements is proposed. This computer-controlled flow network has high portability and enables precise control of volume delivery, flow rates and operation time. Compared to flow injection analysis systems, SIA is an attractive alternative because of its increased simplicity, flexibility and robustness and also because it is an environment-friendly analytical procedure due to its low reagent consumption and generation of less wastes [13]. The quantification involves the NAD+-dependent enzyme glycerol dehydrogenase (GDH) and relies on the spectrophotometric monitoring at 340 nm of the NADH produced in the assay mixture. This enzyme catalyses the oxidation of glycerol to dihydroxyacetone, with simultaneous reduction of the cofactor NAD+to NADH (Eq. 1). The concentration of NADH is thus proportional to the glycerol concentration if NAD+ and GDH are in sufficiently high concentration to keep the reaction pseudo-first order relative to the substrate [14].
glycerol þ NADþ! dihydroxyacetone þ NADH þ Hþ ð1Þ
In this work, a SI system for the kinetic determination of glycerol was designed and applied to samples of a fermentation process.
Materials and Methods
Reagents and Chemicals
All chemicals were of analytical reagent grade quality, and solutions were prepared with boiled ultrapure water.
Liophilized NAD+-dependent GDH from Cellulomonas sp. (ref G3512, Sigma, 70% protein, 3.2 mg of solid, 107 units/mg protein) was used. The enzyme was suspended in 3.2 M ammonium sulphate solution with the pH adjusted to 7.5 and stored at 4 °C. The enzyme working solution (60 μg/ml) was prepared daily by dissolving 70 μl of the commercial enzyme in 10 ml of 50 mM potassium phosphate pH 7.5.
The ß-nicotinamide adenine dinucleotide (NAD+) approximately 98% (grade III, ref. 10621650001) was obtained from Roche. To avoid its degradation, the solid reagent was maintained refrigerated, while the working solution of the 15 mM NAD+ in water was prepared daily before use.
Glycerol standard solution (ref. 104094, 87%, d=1.23) was acquired from Merck. The 1 M glycerol stock solution was prepared in water. Working standards within the 0.5– 5.0 mM concentration range were also prepared in water.
As carrier stream (C, Fig.1), a buffer consisting of 0.5 M sodium carbonate/bicarbonate solution was prepared by dissolving 5.3 g of Na2CO3and 4.2 g of NaHCO3in 200 ml of deionised water where the final pH was adjusted to 10 if necessary.
Bioreactor fermentation samples were taken from the 2-l fermenter vessel (B-Braun, Biostat-MD, Melsungen, Germany) in regular intervals of time and analysed after adequate sample dilution with boiled ultrapure water. The synthetic medium used for the yeast cultivation contained, per litre of deionized water: 1.7 g Bacto yeast nitrogen base (Difco)
without amino acids and (NH4)2SO4, 5 g (NH4)2SO4, 100 g glucose, 0.02 g L-arginine, 0.05 g threonine, 0.04 gL-tryptophan, 0.06 gL-isoleucine, 0.04 g lysine, 0.01 g methionine, 0.06 g phenylalanine, 0.05 g tyrosine, 0.01 g adenine and 0.01 g uracil. Aerobic batch cultures at 30 °C with continuous stirring at 150 rpm and with an aeration rate of 0.5 vvm were carried out. The pH was maintained at 6.5 by automatic addition of 1 M NaOH.
Apparatus
Solutions were propelled by a Gilson (Middleton, Wisconsin, USA) Minipuls 3 peristaltic pump, equipped with Tygon (Paris, France) polyvinyl chloride pumping tubes (d.i., 0.76 mm) to impel the solutions. In this setup, variable flow rates can be achieved up to 42μl/s. Manifold was built up with 0.8-mm i.d. Omnifit (Cambridge, U.K.) polytetrafluoroethylene tubing. The pump was connected to the central channel of an eight-port electrically actuated selection valve (Valco, Houston, Texas, USA; model VICI C15-3118E). For temperature control, a thermostatic bath (ISCO. Srl, Milano), Model GTR 190 was used.
A Thermo (Waltham, Massachusetts, USA) Spectronic Heλios γ UV-Vis spectropho-tometer equipped with a Hellma (Jena, Germany), model 178.712-QS flow cell (10-mm light path; inner optical volume, 80 μl), connected to a Kipp & Zonen (Delft, The Netherlands) BD112 flatbed chart recorder was initially used.
Subsequently, an OceanOptics (Dunedin, FL, USA) USB2000-FLG spectrometer was connected via a 400-μm fibre optical cable (model P400-2-UV-VIS) to the flow cell, placed in an Ocean Optics CUV cell support. A Mikropack (Ostfildern, Germany) Deuterium-Halogen light source, model DH-2000-BAL was used with a 400-μm illumination optical fibre (model P400-2-UV-VIS). Analytical signal acquisition was carried out using the OOIBase32 Spectrometer Operating Software. Wavelength was set at 340 nm.
A 386 Samsung (Seoul, Korea) SD700 personal computer with an Advantec PCL 818 L interface card running a home-made software written in QuickBasic 4.5 controlled the eight-port selection valve positions, the rotation direction and speed of the peristaltic pump. An HP Compaq (Palo Alto, California, USA) dc 5100 MT personal computer running the OOIBase32 Spectrometer Operating Software with Windows XP Professional was used for data acquisition. 1 2 3 4 5 6 7 8 D C HC W SV S P R1 R2 MC 1 2 3 4 5 6 7 8 D C HC W SV S P R1 R2 MC
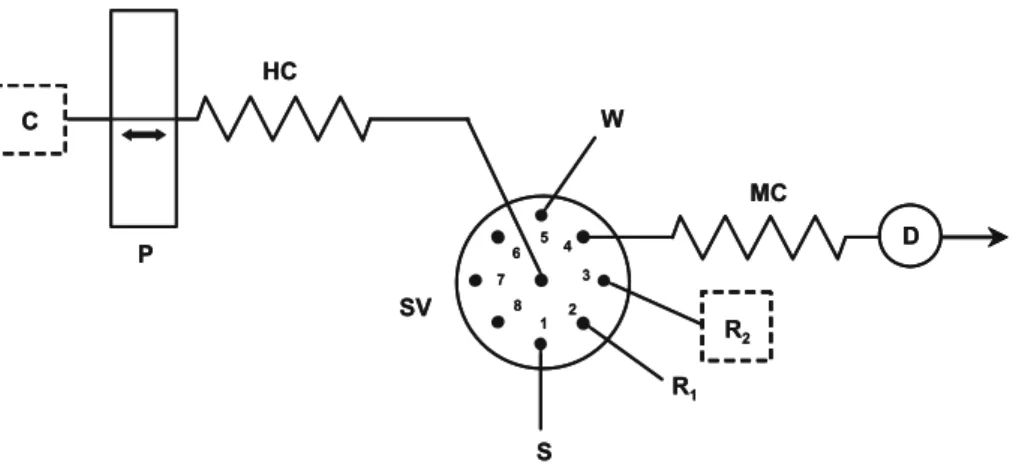
Fig. 1 Flow diagram of the SIA system: SV selection valve, P peristaltic pump, HC holding coil, MC knotted mixing coil, D spectrophotometric detection system, S sample or standard, R1NAD+reagent, R2 GDH enzyme solution, C buffer/carrier stream, W waste. Dotted squares represents thermostated solutions
Sequential Injection Procedures
The system components were arranged as shown schematically in Fig.1. The holding coil (HC) was 200 cm long, whereas the mixing coil (MC), located between the selection valve and the detector, was 100 cm long. Other tubes connected to the selection valve were 30 cm long.
The protocol sequence for the determination of glycerol is presented in Table1. First, aliquots of sample/standard solution, NAD+cofactor and enzyme solution were loaded into the HC. After flow reversal, the string of solutions inside the HC was sent through the MC toward detection. After a preset period of time, the flow was stopped, and acquisition of the analytical signal was performed during an established time interval. Thereafter, the peristaltic pump was reactivated, and the flow cell was washed by the buffer/carrier solution.
Glycerol quantification was based on the rate of formation of NADH, assessed by monitoring the increase in absorbance at 340 nm for a given period of time, after the flow stop. Absorbance values were plotted as a function of time, and the slope value reflected the rate of NADH formation. The linearity of the absorbance versus time function of the obtained graphs was assessed and considered to exist when the correlation coefficient was equal or superior to 0.995 (n>20). Analytical calibration curves were obtained by plotting the rate of NADH formation versus concentration of glycerol.
Accuracy Assessment — HPLC Analysis
High-performance liquid chromatography (HPLC) analyses were run on a high-performance liquid chromatograph (Knauer, Germany) equipped with WellChrom K-2301 refractive index detector (Knauer, Germany). The analytical conditions were as follows: column, Bio-Rad Aminex HPX-87H (300×7.8 mm; Biorad, Richmond, CA,USA); mobile phase, 1 mM sulphuric acid; flow rate, 0.5 ml/min; injection volume, 20 µl; and temperature, 30 °C.
Results and Discussion
Development of the Sequential Injection System—Preliminary Kinetic Studies
In SIA systems, zone overlap is essential to attain suitable mixing conditions. As a consequence, preliminary studies were made to determine solution aspiration sequence,
Table 1 Sequential injection flow protocol for the determination of glycerol.
Step Valve position Operation time (s) Flow rate (μl/s) Volume (μl) Description
a 1 9 10 90 Sample/standard aspiration into HC
b 2 3 10 30 NAD+aspiration into HC
c 3 3 10 30 Enzyme aspiration into HC
d 4 19.3 30 580 Propulsion of HC content toward the flow cell
e 4 30 Stop period, acquisition of analytical signal
volumes to be inserted and the time interval during which the pump should propel solutions towards the detection system before a flow stop period. These experiments were carried out using the classical bench-top spectrophotometric detection system with dye solutions and, later on, confirmed with the analytical reagents. It was determined that solutions should be drawn into the HC in the following order: 90μl of sample/standard, 30 μl of NAD+, and 30μl of enzyme. This sequence allowed reduced enzyme dilution and suitable overlap of the three zones.
The time interval during which the pump was activated before reaction monitoring (Table1, step d) was also an important parameter to assign in the system design. It defined the portion of the overlapped zones (sample/NAD+/enzyme) present in the flow cell during the flow stop period (Table1, step e). Time intervals between 17 and 20.5 s were tested (3.0 mM glycerol, 10 mM NAD+, and 60μg/ml GDH solutions, pH 10.0 carrier solution). Absorbance signal acquisition was performed during the first 30 s. Thereafter, the peristaltic pump was reactivated, and the flow cell was washed by the buffer/carrier solution. The interval was fixed at 19.3 s as the absorbance increase was similar for periods within 19.1 and 19.9 s.
Optimization Studies
In order to achieve adequate analytical features for the SIA methodology, several physical and chemical parameters were studied: the effect of pH, enzyme and NAD+concentrations and reaction temperature.
The set of experiments described below was carried out at laboratory temperature (approximately 20 °C), using glycerol reference solutions between 0.5 and 5.0 mM and initial NAD+ and GDH concentrations of 10 mM and 60 μg/ml, respectively. This application range was selected to maintain the quantity of the enzyme in excess relative to the substrate concentration without increasing the enzyme consumption and compromising the assay costs. Other parameters were set to values used in previous assays.
The influence of pH on the reaction rate was studied by varying the pH of the sodium carbonate/bicarbonate carrier solution between 8.0 and 11.0. Similar reaction velocities were reached for pH values between 9.5 and 10.5. The optimum pH reported for GDH is between 10.0 and 10.5, and the pH recommended by bibliography for the activity measurement of this enzyme is pH 10.0 [15,16] Therefore, a pH of 10.0 was chosen for further experiments.
The concentration of NAD+was studied between 5 and 50 mM. Maximum reaction rate was obtained for the 25 mM NAD+. For all NAD+ concentrations tested, the reaction rates corresponding to each of the glycerol solutions, showed a similar pattern, and reaction rates were a 60%, 75%, 80% and 93% of those obtained for 25 mM NAD+. However, considering that maximum reaction rate value (Fig.2) obtained for 15 mM NAD+was only approximately 13% lower, this concentration was chosen as a compromise between sensitivity and reagent consumption.
GDH concentrations between 30 and 120μg/ml were studied. The concentration of the enzyme was chosen to be 60 μg/ml because, when compared to the highest tested concentration, the rate of reaction was similar (≈10% lower) with a 50% reduction in enzyme consumption.
The influence of temperature was studied by varying the temperature of the enzyme and carrier solutions between 20 and 40 °C with increments at 25, 30, 35 and at 37 °C. As expected, an increase in the rate of the enzymatic reaction was noticed. However, to avoid occasional formation of air bubbles, the temperature was set at 37 °C.
The analytical performance of the SIA system coupled to a classical bench top and to a miniaturised charge-coupled device (CCD) array spectrophotometer was assessed. Detection and quantification limits were calculated as proposed by IUPAC [17] Using the classical spectrophotometric detector, values of 0.01 and 0.15 mM for the detection and quantification limits were obtained, respectively. With the miniaturised CCD array spectrophotometer, the detection limit was 0.13 mM, and the quantification limit was 0.44 mM. Although both limits were higher for the CCD array spectrophotometer, detector portability and the fact that it allows simultaneous monitoring of several wavelengths, enabling multiple detection and background correction, are important advantages to be considered.
Figures of Merit and Application to Samples
The performance of the proposed sequential injection system for the determination of glycerol was evaluated regarding application range, accuracy, repeatability, reagents consumption and determination frequency. The standard concentrations varied between 0.5 and 5.0 mM. This range was only applicable for determination in samples with 0.05–0.5 g/L of glycerol. Therefore, appropriate dilutions were made prior to introduction in the flow system.
The analytical curve was obtained by plotting the reaction rate versus glycerol concentration. As this relationship was not linear for the concentration range defined, the analyte concentration was calculated through the second-order polynomial curve.
Repeatability was estimated for both standard solutions and fermented samples by calculating the relative standard deviation from ten consecutive injections. For three different samples with representative glycerol concentration levels—1.95, 2.63 and 3.85 mM—values of 1.1%, 2.2% and 1.7% were obtained.
Reagent consumption was only 0.45μmol of NAD+and 1.8μg of the enzyme per assay, and the waste production was around 3 ml per assay for both detectors.
The sampling frequency was calculated by considering the time intervals inherent to each step of the protocol sequence (Table1). The time required for all of these operations was 144 s, meaning 25 assays per hour.
To evaluate the accuracy of the proposed system, 17 samples taken at different times from two, otherwise identical, fermentation process were analysed according to the proposed method (CSIA) and by a chromatographic HPLC reference method (CRef). Results obtained are presented in Table2.
Samples taken at the beginning of the fermentation processes (1a–3a and 1b–2b) presented high relative deviations from the reference procedure. To assess the accuracy for the other 12 samples, a linear relationship was established between the obtained
0.000 0.002 0.004 0.006 0.008 0.010 0.012 0 10 20 30 40 50 60 [NAD+] / mM R at e of r eact ion / A U s -1
1 mM gly cerol 2 mM gly cerol 3 mM gly cerol 5 mM gly cerol Fig. 2 Rates of reaction
(absor-bance units per second) obtained with different NAD+solutions for several glycerol solutions
concentrations with the developed method (CSIA) and by the reference HPLC method (CRef) [18]. The equation CSIA=1.0536 (±0.0646) Cref.−0.577 (±2.401), with a correlation coefficient of 0.9906 was obtained. Values between brackets represent the limits of the 95% confidence intervals for the regression parameters. From these figures, it can be concluded that the estimated intercept and slope values do not differ significantly from 0 and 1, respectively, and therefore, no evidence of systematic errors was noticed.
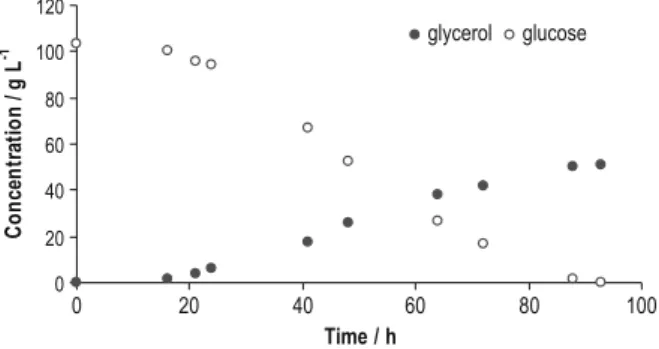
In a normally occurring fermentation process, the development of the nutrients to products ratio follows a defined pattern. Throughout the fermentation process, some of the compounds (glucose, glycerol, succinate, acetate, ethanol, acetoin and acetaldehyde) present in the broth were monitored by HPLC. Considering that along the bioprocess, within these components, glucose is the one that suffers the highest temporal variation, the effect of several glycerol to glucose concentration ratios on the analytical signal were assessed. Three different glycerol concentrations—initial, medium and final glycerol concentrations in the fermentation media—were chosen. For these three glycerol levels, molar ratios between glycerol and glucose of 1:0.5, 1:1, 1:2, 1:5, 1:12 and 1:30 were tested. These ratio values were chosen based on the concentrations found by HPLC procedures in the samples (Fig.3).
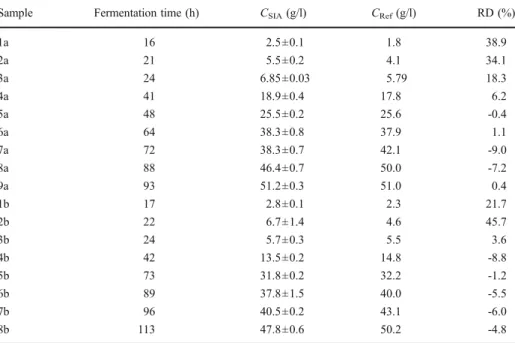
No statistical difference was found between pure glycerol standards and the mixed standards for 0.5 to 5 time excess of glucose (relative deviation lower than 10% were obtained). However, for mixed standard solutions having a large excess of glucose, higher relative deviations were found (up to 50%). This fact can be attributed to the change in the shape of the analytical signal (Fig. 4). On this figure, the absorbance change during the whole analytical cycle can be followed. However, for quantification purposes, only the portion of the curve corresponding to the linear increase in the monitored signal is used. As it can be observed, the registered absolute absorbance values are lower when the excess of glucose increases, but the slope Table 2 Glycerol concentrations for samples collected at different fermentation times from two processes (a and b) by the developed SI procedure (CSIA) and an HPLC (CRef) methodology and corresponding relative deviations (RD).
Sample Fermentation time (h) CSIA(g/l) CRef(g/l) RD (%)
1a 16 2.5±0.1 1.8 38.9 2a 21 5.5±0.2 4.1 34.1 3a 24 6.85±0.03 5.79 18.3 4a 41 18.9±0.4 17.8 6.2 5a 48 25.5±0.2 25.6 -0.4 6a 64 38.3±0.8 37.9 1.1 7a 72 38.3±0.7 42.1 -9.0 8a 88 46.4±0.7 50.0 -7.2 9a 93 51.2±0.3 51.0 0.4 1b 17 2.8±0.1 2.3 21.7 2b 22 6.7±1.4 4.6 45.7 3b 24 5.7±0.3 5.5 3.6 4b 42 13.5±0.2 14.8 -8.8 5b 73 31.8±0.2 32.2 -1.2 6b 89 37.8±1.5 40.0 -5.5 7b 96 40.5±0.2 43.1 -6.0 8b 113 47.8±0.6 50.2 -4.8
(ΔA/Δt) of the linear portion of the curves in fact increases, and this finding can explain the overestimation of the glycerol levels in the samples taken in the beginning of the fermentation curves (Table2, samples 1a–3a and 1b–2b).
Conclusion
The proposed sequential injection system was used for the offline monitoring of biotechnological conversion of glucose to glycerol by a genetically modified strain of S. cerevisiae. The main advantages offered by biosensors over conventional analytical techniques are the possibility of portability, of miniaturisation and working onsite and the ability to measure target analytes in complex matrices with minimal sample preparation. Fast and reliable data (consistent with those obtained with HPLC reference procedure) together with low reagent consumption (1.8 µg of enzyme; 0.45 µmol of NAD+) and minimum waste generation (3.0 ml) were attained.
The present biosensing system holds promise for online detection of glycerol in fermentation processes. As in most of the samples, if glycerol concentration is over the response range of this enzymatic procedure, an online sample dilution would be necessary. This could be accomplished by including an additional step in the SI protocol. Moreover, the applied kinetic strategy can be extended to other substrates, products or by-products of diverse biotransformation processes enabling to surpass background absorption.
0 20 40 60 80 100 120 0 20 40 60 80 100 Time / h C on cen tr at io n / g L -1 glycerol glucose
Fig. 3 Glucose and glycerol con-centrations determined by HPLC procedures in fermented samples
0.000 0.100 0.200 0.300 0.400 0.500 40 20 0 60 80 Time / s Absorb an ce va lu es glycerol standard
mixed glycerol-glucose standard 1:30 mixed glycerol-glucose standard 1:12 0.000 0.100 0.200 0.300 0.400 0.500 Time / s Absorb an ce va lu es glycerol standard
mixed glycerol-glucose standard 1:30 mixed glycerol-glucose standard 1:12 Fig. 4 Analytical signals
obtained for a pure glycerol standard and mixed glycerol– glucose standards with molar ratios of 1:12 and 1:30
Acknowledgements K. Hueso thanks the Spanish Ministerio de Educación y Ciencia for the grant BES-2003-1012/Project BQU2002-02332. Ildikó Tóth thanks Fundação para a Ciência e a Tecnologia (FCT) and FSE (III Quadro Comunitário) for the grant SFRH/BPD/5631/2001.
References
1. Schügerl, K. (2001). Journal of Biotechnology, 85, 149–173. doi:10.1016/S0168-1656(00)00361-8. 2. Mello, L. D., & Kubota, L. T. (2002). Food Chemistry, 77, 237–256. doi:10.1016/S0308-8146(02)
00104-8.
3. Overkamp, K. M., Bakker, B. M., Kotter, P., Luttik, M. A., van Dijken, J. P., & Pronk, J. T. (2002). Applied and Environmental Microbiology, 68, 2814–2821. doi:10.1128/AEM.68.6.2814-2821.2002. 4. Remize, F., Roustan, J. L., Sablayrolles, J. M., Barre, P., & Dequin, S. (1999). Applied and
Environmental Microbiology, 65, 143–149.
5. Cordier, H., Mendes, F., Vasconcelos, I., & François, J. M. (2007). Metabolic Engineering, 9, 364–378.
doi:10.1016/j.ymben.2007.03.002.
6. Nakamura, C. H., & Whited, G. M. (2003). Current Opinion in Biotechnology, 14, 454–459.
doi:10.1016/j.copbio.2003.08.005.
7. Németh, Á., & Sevella, B. (2008). Applied Biochemistry and Biotechnology, 144, 47–58. doi:10.1007/
s12010-007-0040-5.
8. Yazdani, S. S., & Gonzalez, R. (2007). Current Opinion in Biotechnology, 18, 213–219. doi:10.1016/j.
copbio.2007.05.002.
9. Lapenaite, I., Ramanaviciene, A., & Ramanavicius, A. (2006). Critical Reviews in Analytical Chemistry, 36, 13–25. doi:10.1080/10408340500451973.
10. Katrlík, J., Mastihuba, V., Vostiar, I., Sefcovicová, J., Stefuca, V., & Gemeiner, P. (2006). Analytica Chimica Acta, 566, 11–18. doi:10.1016/j.aca.2006.02.063.
11. Oliveira, H. M., Segundo, M. A., Lima, J. L. F. C., Grassi, V., & Zagatto, E. A. G. (2006). Journal of Agricultural and Food Chemistry, 54, 4136–4140. doi:10.1021/jf060229j.
12. Ruzicka, J., & Marshall, G. D. (1990). Analytica Chimica Acta, 237, 329–343. doi:10.1016/S0003-2670
(00)83937-9.
13. Segundo, M. A., & Rangel, A. O. S. S. (2002). Journal of Flow Injection Analysis, 19, 3–8. 14. Wu, L. C., & Cheng, C. M. (2005). Analytical Biochemistry, 346, 234–240. doi:10.1016/j.
ab.2005.08.031.
15. Sigma-Aldrich (1997) Enzymatic assay of glycerol dehydrogenase, SPGLYC01. St. Louis, MO: Sigma-Aldrich 16. Toyobo Enzymes.Glycerol Dehydrogenase from Cellulomonas sp. GYD-301.http://www.toyobo.co.jp/e/
seihin/xr/enzyme. Accessed May 30, 2008.
17. International Union of Pure and Applied Chemistry (IUPAC). (1995). Pure and Applied Chemistry, 67, 1699–1723. doi:10.1351/pac199567101699.
18. Miller, J. C., & Miller, J. N. (1993). Statistics for analytical chemistry (3rd ed.). Chichester, UK: Horwood.