The system of support for academic
teachers in process of shaping soft
skills of their students
process of shaping soft skills of their students
Mário Baía, School of Education of the Polytechnic Institute of Setúbal, Setúbal, Portugal
Maria Rosário Rodrigues * Ana Luísa Oliveira Pires * Elsa Ferreira **
Mário Baía *
* School of Education of the Polytechnic Institute of Setúbal, Setúbal, Portugal
** School of Technology of the Polytechnic Institute of Setúbal, Setúbal, Portugal
December 2019
IPS - Instituto Politécnico de Setúbal 978-989-54631-5-2
This output was carried out as part of the
Erasmus+ KA2: Strategic Partnership
This publication is the outcome of work
undertaken by:
Design: Organization: Date: Editor: ISBNUniversity College of Enterprise and Administration,
Lublin, Poland.
Małgorzata Orzeł, Sylwia Jezierska-Lis
International School for Social and Business Studies,
Celje, Slovenia
Valerij Dermol, Nada Trunk Širca, Alenka Dermol Bernik, Aleš Trunk
Deggendorf Institute of Technology from University of Applied Sciences, Deggendorf, Germany
Sonja Biock, Ariadna Fürstenau
School of Education and School of Technology of the Polytechnic Institute of Setúbal, Setúbal, Portugal. Maria Rosário Rodrigues, Ana Luísa Oliveira Pires, Elsa Ferreira, Mário Baía
Executive summary ...1 1. Introduction ...2
Małgorzata Orzeł, Sylwia Jezierska-Lis
2. Methodology ...3 Maria Rosário Rodrigues, Ana Luísa Oliveira Pires, Elsa Ferreira, Mário Baía
3. Data analysis ...4 3.1. Identification of the respondents ...4
Maria Rosário Rodrigues, Ana Luísa Oliveira Pires, Elsa Ferreira, Mário Baía 3.2. Teaching of how to learn - through experimentation, experience and other
methods activating students ...6 Małgorzata Orzeł, Sylwia Jezierska-Lis
3.3. Teaching creativity, innovation, critical thinking and teamwork skills ...12 Valerij Dermol, Nada Trunk Širca, Alenka Dermol Bernik, Aleš Trunk
3.4. Using digital technologies in the process of teaching and learning ...17 Maria Rosário Rodrigues, Ana Luísa Oliveira Pires, Elsa Ferreira, Mário Baía
3.5. Intercultural entrepreneurship - how to include intercultural aspects in
regular classes ...21 Sonja Biock, Ariadna Fürstenau
Executive summary
The Output 1 - “Improve your teaching – Publication for academic teachers” – is an exploratory study. It was developed based on a questionnaire survey (Tuckman, 2012, Scott & Usher, 2003). This survey was designed to identify the perspectives of higher education teachers on themes related to the Soft Skills project and possible training needs in these areas.
Each partner of the project prepared a set of questions related to the theme. The questions were shared, discussed and validated by all members of the project. An Excel database was built with a questionnaire in English and with four versions translated into the partners’ national languages - German, Slovene, Polish and Portuguese. Despite being written in five languages, the questionnaire had a single structure so the results would produce a single database. Taking into account the European data protection law, the Lime Survey software, installed on the IPS server, was used to ensure the security of the collected data.
Data analysis shows that the number of respondents is approximately the same in all partner countries. Regarding the area of teaching, the Economics and Management area had the highest number of answers with about 34%. With respect to the teaching experience, we concluded that the majority of the respondents (53%) had more than 10 years of experience, with a very large percentage of teachers with less than 10 years of experience (40%). The age of the respondents was also very scattered, about 55% of the respondents were less than 40 years old, which corresponds to a relatively young population performing as teachers in higher education.
In the questions related to the use of digital technologies in the process of teaching and learning, the survey results shows the great importance that the use of digital resources available for learning and communication have. Despite the importance given to technologies, respondents revealed little knowledge about audio, video, and multimedia edition software or building Web pages software.
In the questions “how teaching and how to learn - through experimentation”, the survey shows that 95.45% of respondents answered that teaching how to learn is an extremely important and relevant element in the professional life of each person.
The survey on Teaching creativity, innovation, critical thinking and teamwork skills showed that the teaching approaches enhancing the creativity, innovation, critical thinking and the skills of teamwork are already quite strongly present in a higher education environment. As the study suggests, the frequency of use and the variety of such approaches depend upon the direction as well as the discipline of teaching.
With the questionnaire on Intercultural entrepreneurship, the state of integration of interculturality in the study programs were evaluated and explores the personal development of interculturality among the teachers. According to the survey results, the subject of interculturality is well understood by most participants in different countries and almost all participants find it important to develop intercultural skills.
1. Introduction
“Improve your teaching – Publication for academic teachers” is an the intellectual output 1, developed within the project “The system of support for academic teachers in process of shaping soft skills of their students” – the project is implemented within Erasmus + programme, Key Action 2: Cooperation for innovation and the exchange of good practices - Strategic Partnerships for higher education (Agreement no: 2018-1-PL01-KA203-050754).
The publication was developed by an international consortium of higher education institutions from 4 countries:
Instituto Politecnico de Setubal, Portugal (School of Education and School of Technology of the Polytechnic
Institute of Setúbal, Portugal) – Lead Partner, responsible for coordination of work under this output.
Mednarodna Fakulteta za Druzbene in Poslovne Studije Zavod, Slovenia (International School for Social
and Business Studies, Celje, Slovenia)
Technische Hochschule Deggendorf, Germany (Deggendorf Institute of Technology from University of
Applied Sciences, Deggendorf, Germany)
Wyższa Szkoła Przedsiębiorczości i Administracji w Lublinie, Poland (University College of Enterprise
and Administration in Lublin, Poland).
The publication is dedicated to academic teachers who would wish to improve quality of their work. Content of the publication is based on information from academic teachers, gathered during the process of national data collection, launched by each Partner Institution.
The Publication consists of following parts:
Executive summary – made by School of Education and School of Technology of the Polytechnic Institute
of Setúbal, summarizes the entire document
Introduction – made by University College of Enterprise and Administration, serving as an overall
presentation of the publication
Methodology – made by School of Education and School of Technology of the Polytechnic Institute of
Setúbal, presenting methodology used during creation of the publication
Data analysis – divided into 5 chapters:
– Identification of the respondents, made by School of Education and School of Technology of the Polytechnic Institute of Setúbal
– Teaching how to learn - through experimentation, experience and other methods activating students, made by University College of Enterprise and Administration
– Teaching creativity, innovation, critical thinking and teamwork skills, made by International School for Social and Business Studies
– Using digital technologies in the process of teaching and learning, made by School of Education and School of Technology of the Polytechnic Institute of Setúbal
– Intercultural entrepreneurship - how to include intercultural aspects into regular classes, made by Deggendorf Institute of Technology from University of Applied Sciences
Final remarks – made by School of Education and School of Technology of the Polytechnic Institute of
Setúbal with contribuition from all partners – which focuses on an overall analysis of the results of each group of questions and includes some suggestions for building the training modules.
This project has been funded with the support from the European Commission (project no 2018-1-PL01-KA203-050754). This publication reflects the views only of the authors, and the Commission cannot be held responsible for any use which may be made of the information contained therein.
2. Methodology
Aiming to produce the Output 1 - “Improve your teaching - Publication for academic teachers” - an exploratory study was developed based on a questionnaire survey (Tuckman, 2012, Scott & Usher, 2003). This survey was designed to identify the perspectives of higher education teachers on subjects related to the Soft Skills project and possible training needs in these areas. Its results would then guide the design of the training courses that will be part of Output 2, namely:
1. Teaching how to learn - teaching through experimentation, experience and other methods for activating students;
2. Shaping attitudes of innovation, creativity, critical thinking, and teamwork skills during regular classes;
3. Using ICT in the teaching process of any subject;
4. Intercultural entrepreneurship - how to include intercultural aspects in regular classes.
The online survey was structured in five groups of questions: the first group was related to personal identification and the following four were related to the four thematic areas / training courses outlined above.
Each partner of the project prepared a set of questions related to the theme / course developed under his / her responsibility.
The questionnaire survey included simple open and closed questions (simple factual and opinion questions), multiple choice and Lickert scales (closed lists, partial agreement statements or questions). The questions were shared, discussed and validated by all members of the project. An Excel database was built with a questionnaire in English and with four versions translated into the partners’ national languages - German, Slovene, Polish and Portuguese. Despite written in five languages, the questionnaire had a single structure so the results would produce a single database. Taking into account the European data protection law, the Lime Survey software1, installed on the IPS server, was used to ensure the security of the collected data.
The final version of the questionnaire sought to respond all requirements suggested by the partners. However, due to both the characteristics of the software used and some question repetition, partners’ suggestions needed to be changed. In order to validate this version, a pre-test of the questionnaire was performed in English. Thirteen answers were obtained, eight of which were partial and five completed. The distribution of answers by country is shown in figure 1. Although not very significant, the number of answers allowed us to determine the comprehensibility and pertinence of the questions.
Chart 2.1. Answers by country - test version
The survey was carried out in the last fortnight of May 2019. All partners processed the answers: each team was responsible for the cross-sectional analysis of the answers of the corresponding thematic group.
3. Data analysis
This chapter contains the analysis of the data collected by the survey. This group of questions was handled question by question. If there was a relationship between the data of several questions, such data was handled together. At the end of each section, there is a short reflection on the data collected in that group of questions and some suggestions on teacher university training in that study field.
3.1. Identification of the respondents
In this section of the report, we analyze the data collected in the group A of the survey, with information about the respondents’ characterization.
Question A1 - In which country do you work? And A2 - In which university do you work?
With this survey, we collected 88 responses. The first and second questions were intended to characterize the origin of the respondent. Data analysis shows that the number of respondents is approximately the same in all partner countries.
Chart 3.1.1. Number of answers by partner Chart 3.1.2. Number of answers by partner and by university
When looking at the distribution of the answers by Higher Education Institutions (HEIs) of each partner, we noticed that the vast majority were obtained in the HEI, except in Slovenia where they were obtained in other institutions (chart 3.1.2).
Question A3 - Scientific field of graduation.
The analysis of the answers obtained in this question was different for each partner. 20 answers (23%) referred the academic degree of the respondent whereas the remaining 68 answers (64%) referred their training field.
Question A4 - Scientific area of teaching.
Regarding the area of teaching, and as the answers varied greatly, we found the need to categorize them according to the more comprehensive scientific areas of the International Standard Classification of Education (Eurostat, 2015).
The Economics and Management area had the highest number of answers with about 34% (chart 3.1.3). However, the other answers were scattered by other areas, which allows us to affirm that the training modules to be developed based on these results could be used in several study fields.
When comparing academic data and teaching data, we found that 12 respondents (14%) stated that they work in a different area from the one of their training. These differences were greater in respondents whose area of training was Social Sciences, where six respondents stated working in other areas: Economics and Management (4), Education (1), and Health (1).
Question A5 - How many years have you been teaching? And A6 - Which is your year of birth?
With respect to the teaching experience, it ranged from a respondent with less than a year of experience to a respondent with forty-two years of experience. By grouping the collected data in decades, we concluded that the majority of the respondents (53%) had more than 10 years of experience, with a very large percentage of teachers with less than 10 years of experience (40%), as we can see in chart 3.1 4.
Chart 3.1.4. Experience as a teacher Chart 3.1.5. Age of the respondents
The age of the respondents was also very scattered. The youngest respondent was born in 1989 (30 years old) whereas the oldest respondent was born in 1953 (66 years old). The chart 3.1.5 shows that about 55% of the respondents were less than 40 years old, which corresponds to a relatively young population performing as teachers in higher education.
Question A7 – Gender
The distribution of respondents by gender (chart 3.1.6) revealed a relatively balanced percentage between the two. The distribution by gender and by country (chart 3.1.7) showed that in Germany, the majority of respondents were male, but in other countries the distribution was balanced between both genders.
3.2. Teaching of how to learn - through experimentation, experience and other methods
activating students
Question B1 – Please assess from 1 to 5 what is the role of “teaching how to learn” in professional life.
The question was planned in a way enabling to give 1 answer marking from 5 to 1, where 5 means “very high” and 1 means “irrelevant”. There is a table below that presents the amount of affirmative answers for that question.
Chart 3.2.1 . Percentage of affirmative answers indicating the validity of “teaching how to learn”
As the table shows, fifty six respondents (63.63%) answered that teaching how to learn is an extremely important and relevant element in the professional life of each person. It is important that only three people from the respondents indicated a small or no role of teaching how to learn in professional life. Chart 3.2.2 shows the data organized by gender, where women definitely appreciate more the role of teaching how to learn.
Chart 3.2.2. Frequencies of answers “teaching how to learn” organized by gender
Answers about the low role of teaching how to learn in professional life came from representatives of Germany and Slovenia (Chart 3.2.3). The biggest role was attributed by people from Portugal (20 people) and Poland (19 people).
When it comes to the scientific category / main discipline (Chart 3.2.4), the highest scores come from Economics and Management (19 and 10), then Education and Social Sciences and Computer Sciences. The low indicator answers come from the field of Engineering and Mathematics.
Chart 3.2.4. Percentage of affirmative answers indicating the validity of “teaching how to learn” by scientific area Question B2 - How do you shape student’s learning skills? Name at least 3 ways you use.
That was an open question. Answers received are complementary with the next question – B3 – what activating methods are used in teaching.
One of the most frequent answers was:
“ - Through projects that are prepared by students on their own, multimedia presentation, case study analysis – Case study
– Role play – Discussions – Brainstorming”
One of the answers was formulated as following:
“1. organize classes and present the content in a way that inspire students to look for further information; 2. divide material/content into parts in a way, that is consistent and logical; 3. learn memorization techniques and logical thinking”.
To sum up, we can conclude, that basic element, that is used by respondents in shaping student’s learning skills are activating methods such as: lectures, workshops, practices, working in groups, brainstorming, projects. One of not listed but mentioned by respondents was using Youtube lectures, applied internships, computer simulations, so using IT tools.
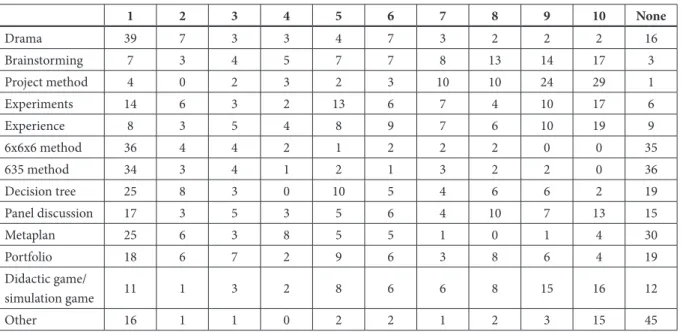
Question B3 - Please assess (using scale, where 10 is the most often, 1 is the least) – what activating methods do you use in teaching?
Respondent was supposed to answer to every part of the question, that are examples of activating methods by giving them a degree of importance on a scale of 1 to 10 - where 10 means the most often I use and 1 the least often I use.
Table 3.2.1. Activating methods 1 2 3 4 5 6 7 8 9 10 None Drama 39 7 3 3 4 7 3 2 2 2 16 Brainstorming 7 3 4 5 7 7 8 13 14 17 3 Project method 4 0 2 3 2 3 10 10 24 29 1 Experiments 14 6 3 2 13 6 7 4 10 17 6 Experience 8 3 5 4 8 9 7 6 10 19 9 6x6x6 method 36 4 4 2 1 2 2 2 0 0 35 635 method 34 3 4 1 2 1 3 2 2 0 36 Decision tree 25 8 3 0 10 5 4 6 6 2 19 Panel discussion 17 3 5 3 5 6 4 10 7 13 15 Metaplan 25 6 3 8 5 5 1 0 1 4 30 Portfolio 18 6 7 2 9 6 3 8 6 4 19 Didactic game/ simulation game 11 1 3 2 8 6 6 8 15 16 12 Other 16 1 1 0 2 2 1 2 3 15 45
Based on the analysis of the above data it can be concluded that the most popular and most commonly used method of activating students is the project method (33%), 22% experiments and the brainstorming method (19%). The least willingly used methods are the 6x6x6 method (41% of respondents rated it 1 as the least) and the 635 method (39%). Perhaps this is due to not being familiar with these methods or their specifics It is also important that only a few of the respondents (22 people) indicated their own activation methods that they implement in their classes. Among them were indicated:
– think pair share – group puzzle – marble group – quiz
– text work
– Practical examples from industry, successful research projects, current salary lists
– Practical examples as exercises – Guest lectures with practical examples – Own practice project
– outdoor classes
– Experimental learning - Self and group reflection - key learning from experience,
– Videos, demo components
– Reference to “knowledge is money.”
– As a young student one should see the drudgery of learning in a sporty way.
– In addition: You simply can’t convince everyone. – You simply expect a good deal of self-discipline
and self-organisation.
– Particularly in the Master’s programme, I describe the expectations of the industry to the students:
– “Master = increased demands on oneself”. – Poor grades in the Master’s programme are
counterproductive and reduce the chances of good positions, because in industry Bachelor’s graduates with medium grades are more likely to be recruited than Master’s candidates with poor grades.
– group work
– group puzzle
– Switching between listening and own activity – Change of media
– problem solving – photovoice method
– group / team work, autonomous research / research strategies, presentations / seminars – Construction of digital resources in small group – Adapting flipped learning
– Individual Work Plan (articulated with modes of organization in class with group work / peer work and expository class)
– Grammatical Laboratory – Discussion Forum – Seminar, open classes,...
– Exposure of contents; discussion of themes; Work Presentation; reading and discussion of scientific articles
– Case study, simulations, working in groups – Discussions
– Looking for answers for current challenges, participation in public activities, listening to radio programmes (and discussion), preparing micro-tasks, assigning and solving them, role play – Multimedia quiz
– Brainstorming, situation games and other
– working in groups, presentation preparation, developing tests, crosswords with noting easy answers by students themselves, review and analysis of thematic films, brainstorming.
They overlap to some extent with the methods mentioned earlier in the study, which may suggest either ignorance of the assumptions of specific methods or other understanding of their content.
Question B4 – What are the main obstacles in using activating methods in teaching process?
Respondents were supposed to tick and least 1 option. In case of category “other” they were supposed to make this answer precise by giving own answer.
Chart 3.2.5. Main obstacles in using activating methods
The lack of time was considered as the biggest obstacle – too little teaching hours (51%) and lack of didactic help (26%). Next, not being familiar with methods and techniques by educators - each indicated by 23%. These results correspond to the low results obtained by activating methods 6x6x6 and 635 as the least popular and used - perhaps because of not being familiar with these methods. Respondents were also asked to indicate other reasons that hinder the use of methods and techniques activating students. Among the overlapping answers are: too large groups of students and the use of smartphones in the classroom.
Table 3.2.2. Main obstacles in using activating methods [Other] Too large groups
Time, Funding Smartphones
Too large groups, changing numbers of participants and poor planning Acceptance through students
Preparation time, student participation Fight against distraction: Smartphone Lack of discipline among Students Lack of thinking among the students Lack of student preparation and autonomy Students often ask for more expository methods
Difficulty in activating students to discuss and present their opinion (difficulties with speaking) and systematic work. Language difficulties of foreign students
Passivity of students
Lack of will to cooperate from student
Question B5 - Do you use in your work the method of educational project? (Yes/No)
Then, the respondents were asked if they use one of the activating methods in their work, which is the method of an educational project. 77.27% of the answers were affirmative. This is complementary to the results in the question about the popularity of particular activation methods. Negative responses of German respondents are 11 people, which, referring to the total number of respondents from this country, gives 52.38%. In the survey we see responds, that indicate improper understanding and not being familiar with the method of the educational project.
Question B6 - What is the role of feedback in didactics?
Answer to the question could be given starting from big, through average to small. Respondents could also give an answer in which they say that feedback plays no role.
Chart 3.2.7. The role of feedback in didactics, organized by country
Out of 88 respondents, almost 78 which is 88,64% answered that feedback plays big role in modern didactics, 10 people answered that average. Representatives of Portugal and Poland, each, gave 21 answer “big”, which is 80,77% (Portugal) from all respondents from that country is 95,45% (Poland).
Chart 3.2.8. The role of feedback in didactics, organized by scientific areas
Analyzing the answers in the context of which areas of science are the answers - it should be noted that the most responses stating the very high role of feedback in the didactics come from Economic Sciences and Management (28) followed by the area of Education, Computer Science and Social Sciences.
Question B7 – Do you use formative assessment in your work (Yes/No)
In the final phase of this section, the respondents were asked for the use of formative assessment in their daily work. 80 people (90.90%) answered affirmatively and only 8 people negatively. This means that people are not only familiar with the notion of such a method of assessment but they also regularly apply it to their everyday didactic practice. One of the reasons for not using this method, given by the respondent, was the fact that it requires a significant amount of time for interviews with students. This corresponds to the answers in question B4 - where 51% of respondents stated that one of the main obstacles in using methods activating students is the lack of time for classes.
Chart 3.2.9. The use of formative assessment Chart 3.2.10. Using formative assessment, by country
Among the countries participating in the survey, the most affirmative answers to the question were given from Portugal (26 people) and Poland (20 people). However, 4 negative responses were from Slovenia. Considering the period that person works as a lecturer, the results are as follows. Regarding the number of responds, two negative respondents were received from people who have been in the profession for 18 years.
Chart 3.2.11. Using formative assessment, by years of teaching
Chart 3.2.12. Using formative assessment, by years of teaching
The most positive responds in this category were from teachers that has been teaching from minimum 20 years.
Some final remarks on Teaching how to learn - through experimentation, experience and other methods activating students
It should be emphasized that 95.45% of respondents answered that teaching how to learn is an extremely important and relevant element in the professional life of each person, which later made an influence on results in other questions, as it indicated a commitment to teaching and shaping learning skills. It seems, however, that future training should be extended to include other than e.g. project method or brainstorming, methods for activating students, that are the most often used and the most popular.
3.3. Teaching creativity, innovation, critical thinking and teamwork skills
General fundings
Chart 3.3.1. presents average assessments of frequency the respondents gave to the three directions of teaching used to enhance students’ soft skills in their higher education institutions. As can be seen from the figure, the differences among the three directions are marginal; however, it seems that the main emphasis may be on teaching teamwork behaviour. On the other hand, it seems that teaching creativity and innovation is a bit less present in the classrooms.
Chart 3.3.1. Average assessment of teaching directions
The further analysis presented in chart 3.3.2 shows that most of the approaches directed into the enhancement of creativity and innovation are used frequently. Nevertheless, it seems that teachers push students more strongly to demonstrate originality in their learning as well as to try out new ideas and approaches to problem-solving during the process of learning.
Chart 3.3.2. Assessment of teaching directions – creativity and innovation (Students are encouraged to…)
The frequency of teaching directed into enhancing critical thinking is also assessed quite good. The highest assessments received by the respondents are related to the skills of formulating questions clearly and concisely, and openness to multiple possibilities which appear in an environment.
Chart 3.3.3. Assessment of teaching directions – critical thinking (Students are encouraged to...)
As chart 3.3.4 indicates, the teaching of teamwork behaviour seems to be used very often by the majority of respondents. The differences between individual indicators of teamwork teaching are marginal. However, from the figure, we can conclude that cooperative work, respect for different opinions, habits and preferences as well as the contribution of new ideas are the most common approaches to teamwork teaching.
Chart 3.3.4. Assessment of teaching directions – teamwork behaviour (Students are encouraged to…)
Chart 3.3.5. Used teaching approaches
The chart 3.3.5 lists the teaching methods promoting soft skills in higher education as well as their frequencies of use. We can see that the most frequently used methods are problem-based learning, self-directed learning and group exercises/action learning. On the other hand, the least frequently used methods are competitions and role-playing. Simulations, games and group techniques to create new ideas are also a bit less frequently used teaching methods.
Comparison between different fields of teaching
In the survey, we asked respondents about specific methods which might improve soft skills of creativity, innovation, critical thinking and teamwork behaviour. They gave us the following suggestions which add new possibilities to the list from chart 3.3.5:
– practical experiments
– students conduct interviews with local people and present learnt things interactively
– YouTube videos for the preparation of a topic – Design Thinking
– Lego Serious Play – project work
– autonomous research – technology assessment – what-if analysis
– flashlight inquiry with an online voting tool – symbolic techniques such as Creative Art – critical incident technique
– coaching
– feedback from students and teachers
– open tasks with many degrees of freedom for students, discussion of controversial themes with groups defending antagonistic positions, collaboratively developed works in small group – the methodology of Project-based learning not
only allows group balancing to solve a situation by appealing to creativity in solving problems, allowing diverse consultation to sources of information
– use of open software so they can create and think with students how to create new and creative products
– encouraging formulation of problems to be investigated (in working groups) with themes related to their future professional area
– presentation of a first version of the group work given my feedback and questions posed by the
– systemic questioning techniques
– students solve specific tasks and then correct their solutions using presented sample solutions. – brainstorming, argumentation - pro and contra,
learning negotiation techniques
– learning through the game, comparing different activities, confronting opinions, preparing suggestions for solutions, creation of ideas and arguments in groups
– use of graphic representations in social essays. – challenges prepared by companies - students
search for and develop innovative ideas and solutions
– I often use simulations of real situations in school settings but also, whenever possible, out of school. Thus, it is intended to create an environment of positive pressure, concerning risk and exposure, different from the one we have in a more controlled environment that is the classroom
– involvement in open projects – critical analysis of scientific articles – developing a game as Project Work
– organization and stimulation of scientific events – proposals for solutions to a real problem – autonomous reading and reading forum
– development of specific physical exercise programs for a specific subject and/or population – techniques of sociodrama
– the most creative proposals are mostly worked with finalist students and are most often present in health-promoting actions. In these initiatives, students work in groups and are encouraged to develop innovative products to ensure the audience’s attention (short, animated and original videos, infographics, etc.)
– creating their plans, maps, a vision of the world
Comparison between different fields of teaching
In the analysis, we also compare approaches to the teaching of creativity, innovation, critical thinking and teamwork behaviour used in different fields of teaching. As can be seen from chart 3.3.6. in the field of computer science, engineering and mathematics, such approaches are used less frequently, on the other hand, they are used most frequently in education.
Chart 3.3.6. Average assessment of teaching directions per fields of teaching
Chart 3.3.7. Assessment of teaching directions – creativity and innovation, per teaching disciplines (Students are encouraged to…)
In chart 3.3.7, chart 3.3.8 and chart 3.3.9 can see differences between teaching in various teaching disciplines in details. Variability between the fields of teaching is quite high, but the general finding of low-frequency use of creative methods if teaching in engineering and on the other hand, high-frequency use if such approaches in education are repeated in all areas (creativity and innovation, critical thinking, teamwork).
Chart 3.3.8. Assessment of teaching directions – critical thinking,
per teaching discipline (Students are encouraged to…) behaviour, per teaching discipline (Students are encouraged to…)Chart 3.3.9. Assessment of teaching directions – teamwork
Chart 3.3.10 shows how often different methods of teaching are used in different disciplines of teaching. Again, the differences between the disciplines are significant. As the figure suggests, teachers in Computer Science, Engineering and Mathematics use all the approaches listed in the questionnaire the least frequent. In comparison with other disciplines, teachers in Economics and Management, for example, use quite often all the methods proposed in the study. The same seems to be with the teachers in the Social Sciences. In Education, guest form practice, case studies, workshops, competitions and role-playing are used less frequently, especially when we compare the frequency with the other disciplines.
Chart 3.3.10. Used teaching approaches per teaching discipline
The obstacles for the use of creative methods of teaching soft skills
In the survey, we asked respondents about specific obstacles which might hinder learning of soft skills of creativity, innovation, critical thinking and teamwork behaviour. They gave us the following answers: – attitude of the faculty that creativity must be
proven by written theory examinations. – generally unmotivated students
– lack of group dynamics since no processes for the specific development of groups (team building) take place at the beginning of the studies
– changing numbers of participants and poor planning of workshops
– problems of time
– students having many other classes and assignments to take care of, or they are just not interested on the topic.
– in project groups, students often work on their own, communicate little or rely on others to
– learning for the exam
– for teaching mathematics, the question is not appropriate
– immaturity of students
– preference of students for traditional methods (less active)
– lack of student autonomy when entering in higher education
– lack of time on the part of students, mostly student-workers
– high number of students per class
– lack of knowledge that is the base for implementing creative actions
Conclusions
The study among higher education teachers showed that the teaching approaches enhancing the creativity, innovation, critical thinking and the skills of teamwork are already quite strongly present in a higher education environment. As the study suggests, the frequency of use and the variety of such approaches depend upon the direction as well as the discipline of teaching. Namely, the results of the study show that the main emphasis of soft skills teaching may be on teaching the teamwork behaviour, and a little less emphasis is put on teaching creativity and innovation. Besides, in the disciplines of computer science, engineering and mathematics, soft-skills oriented teaching approaches are used less frequently, on the other hand, they are used most frequently in education
To teach in promote the creativity and innovation, higher education teachers most often motivate students during the process of learning to demonstrate originality in their learning and try out new ideas and approaches to problem-solving. To improve the students’ critical thinking abilities, the teachers focus on the skills of formulating questions clearly and concisely, and on strengthening students’ openness to multiple possibilities appearing in the study environment. The teaching of teamwork behaviour, which is used very often in the classrooms, promotes cooperative work, respect for different opinions, habits and preferences as well as the contribution of new ideas.
The most common teaching methods the respondents reported are problem-based learning, self-directed learning and group exercises/action learning. On the other hand, the less frequently used methods are the use of competitions and role-playing, simulations, games and group techniques for the creation of new ideas. Besides, quite some advanced methods of teaching soft-skills were reported - practical experiments, the use of YouTube videos, Lego Serious Play, Design Thinking, Creative Art, learning through the game, etc.
The main obstacles hindering teaching soft-skills of creativity, innovation, critical thinking and teamwork reported by the respondents are attitudes of the faculty towards knowledge assessment preferring classical examination, which does not support creativity and innovation, as well as the lack of knowledge needed to implement creative actions, attitudes of the students who learn just to pass the exams, and who are quite often unmotivated to learn, or have cultural and language issues. The problems might also relate to the infrastructure or organisation of teaching due to changing numbers of students in the learning activities throughout the course implementation, limitations related to time, too many obligations in too short time students have due to too many classes and assignments, etc.
3.4. Using digital technologies in the process of teaching and learning
This group of questions aimed to assess the learning environment, including understanding how teachers access technology and their perceptions and uses of digital resources for teaching and learning. The questions included in the survey were inspired by Kirkwood & Price (2016).
Question D1 - Considering the changes introduced by technologies in society, in education and in the world of work, please mention the TWO that you consider most significant.
This was an open question. As the answers were very diverse, we analyzed their content and their frequency. We identified 4 major categories of changes, which were: 1) access to information; 2) communication, networking and collaborative work; 3) use of collaborative educational platforms; and 4) the use of internet, mobile phones, and tablets were also referred to as a change. Those changes led to benefits, as referred in the answers, which are in figure 1. However, some dangers were also referred, for example, the lack of trust in the information available on the Internet and the students’ lack of attention and motivation to learn (“why should I learn anything if I can google it?”). The challenges of new technologies in education were also mentioned, under this idea: with the new technologies we will have to rethink education and consider new ways of communicating.
Figure 3.4.1. Major categories of changes and main benefits
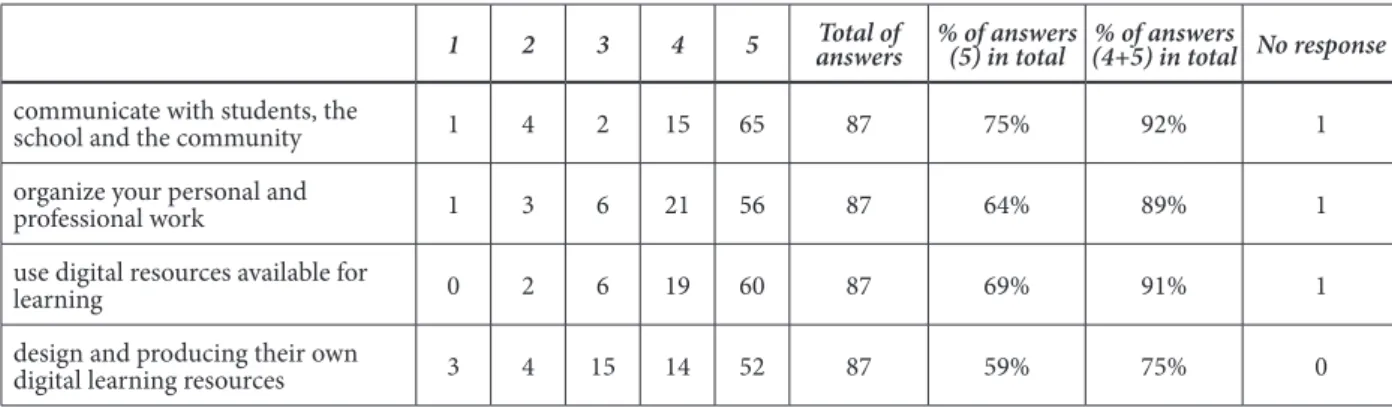
Question D2 - Please rate the importance you give to the use of digital technologies, for the following purposes: (1 - not important at all, 5 - very important)
This question was divided into four sub questions. The following table, table 1, shows the absolute frequencies of the answers obtained for each sub question, the percentage of answers for the very important use (5) option, and the sum of answers for the percentage of important use (4) and very important use (5) options.
Table 3.4.1. Importance of use of digital technologies
1 2 3 4 5 answersTotal of % of answers (5) in total (4+5) in total No response% of answers
communicate with students, the
school and the community 1 4 2 15 65 87 75% 92% 1 organize your personal and
professional work 1 3 6 21 56 87 64% 89% 1
use digital resources available for
learning 0 2 6 19 60 87 69% 91% 1
design and producing their own
digital learning resources 3 4 15 14 52 87 59% 75% 0
Looking at table 3.4.1, we can see that the majority of respondents chose the important (4) or very important (5) options for every alternative. This percentage is higher regarding aspects of information use (use digital resources available for learning) and communication (communicate with students, the school and the
Question D3 - Please rate your knowledge level with the following technologies: (1 - I do not Know, 5 - I Know very well)
Table 3.4.2 shows the number of answers for each knowledge level and the percentage of the sum of answers of the two higher levels. Among the tools listed, Spreadsheets and Electronic Presentations were the ones with the highest level, with about 88% and 97% of answers with values 4 or 5, respectively. In contrast, Video editing (38%) and Web page design (36%) had the lowest values. The following lesser-known digital tools were Multimedia authoring and Digital audio with 49% and 41%, respectively. These results seem to confirm that respondents reveal little knowledge about information production tools.
Table 3.4.2. Knowledge level of technologies
1 2 3 4 5 answersTotal of (4+5) in total No response% of answers
Spreadsheets (e.g. Excel) 0 3 7 33 45 88 89% 0
Presentation (e.g. PowerPoint) 0 0 3 29 56 88 97% 0
Databases 4 11 23 29 21 88 57% 0
Multimedia authoring 7 15 21 17 25 85 49% 3
Graphic editing 6 12 24 20 25 87 52% 1
Digital audio 9 21 21 20 15 86 41% 2
Video editing 12 18 24 17 16 87 38% 1
Web page design 24 16 16 18 13 87 36% 1
Learning Management Systems (e.g. Moodle) 4 7 16 32 28 87 69% 1 Web 2.0 tools (wikis, blogs, social networking
and sharing tools) 7 11 22 23 25 88 55% 0
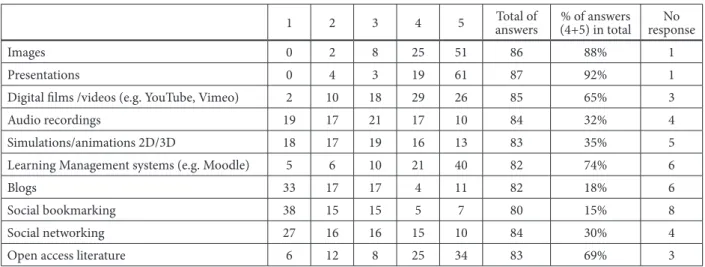
Question D4 - Please indicate how often you use the following digital resources: (1- Never, 5 - Always) Table 3.4.3. Use of digital tools
1 2 3 4 5 answersTotal of (4+5) in total% of answers responseNo
Images 0 2 8 25 51 86 88% 1
Presentations 0 4 3 19 61 87 92% 1
Digital films /videos (e.g. YouTube, Vimeo) 2 10 18 29 26 85 65% 3
Audio recordings 19 17 21 17 10 84 32% 4
Simulations/animations 2D/3D 18 17 19 16 13 83 35% 5 Learning Management systems (e.g. Moodle) 5 6 10 21 40 82 74% 6
Blogs 33 17 17 4 11 82 18% 6
Social bookmarking 38 15 15 5 7 80 15% 8
Social networking 27 16 16 15 10 84 30% 4
Open access literature 6 12 8 25 34 83 69% 3
Regarding the use of digital tools (table 3.4.3), when summing the answers of the two highest values of the scale used, it was not surprising that respondents stated a frequent use of Images (88%) and Presentations (92%). In contrast, and in line with the previous point, Social bookmarking, Blogs, Social networking, Audio recordings and Simulations/ animations 2D / 3D were the items less used, with 15%, 18%, 30%, 32%, and 35%, respectively.
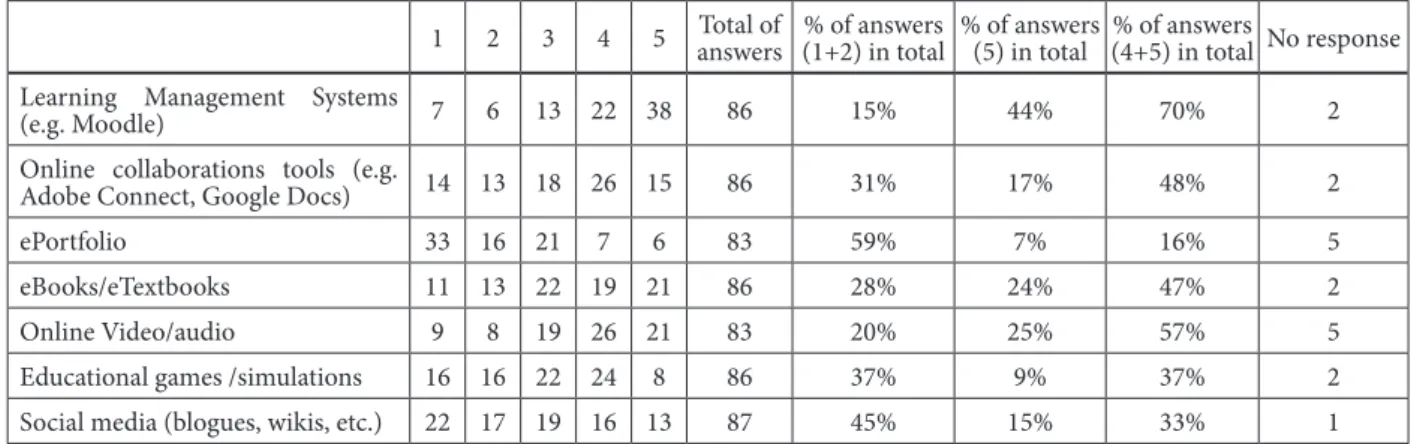
Question D5 - Please classify your level of use of the following technologies in the teaching and learning process: (1 - I can´t use it, 5 - I use it very well)
Continuing the percentage analysis of the answers obtained in the two highest values of the scale (table 3.4.4), we conclude that only two technologies reached values greater than 50%: Learning Management systems, with 70%, and Video / audio Online, with 57%. On the other hand, there are significant percentages in the lowest values for the following items: Digital Portfolios (59%), Social Media (45%), Educational Games / simulations (37%), and Online collaboration tools (31%). The data seem to reveal that the respondents do not frequently use the collaborative tools.
Table 3.4.4. Use of technologies in the teaching and learning process
1 2 3 4 5 Total of answers (1+2) in total% of answers % of answers (5) in total (4+5) in total No response% of answers Learning Management Systems
(e.g. Moodle) 7 6 13 22 38 86 15% 44% 70% 2
Online collaborations tools (e.g.
Adobe Connect, Google Docs) 14 13 18 26 15 86 31% 17% 48% 2
ePortfolio 33 16 21 7 6 83 59% 7% 16% 5
eBooks/eTextbooks 11 13 22 19 21 86 28% 24% 47% 2 Online Video/audio 9 8 19 26 21 83 20% 25% 57% 5 Educational games /simulations 16 16 22 24 8 86 37% 9% 37% 2 Social media (blogues, wikis, etc.) 22 17 19 16 13 87 45% 15% 33% 1 Question D6 - How do you relate to each one of the following statements? (1 - Strongly disagree, 5 - Strongly agree)
When clustering values 1 and 2 of the scale (table 3.4.5), the less valued statements were: The technologies allow to reduce the time and effort of professors and students (20%), Technologies to solve many educational problems (14%), and Technologies promote student involvement in learning (14%).
The statements most valued were Technologies promoting new opportunities to organize teaching and learning, with 91%, and Technologies improve access to education and training, with 89%. The remaining statements were valued between 61% and 79% for the two highest values on the rating scale.
Table 3.4.5. Value of technologies in teaching and learning
Technologies… 1 2 3 4 5 awswersTotal of % of awswers (1+2) in total % of awswers (4+5) in total responseNo can solve many educational problems 7 5 14 35 27 88 14% 70% 0 promote new opportunities to
organize teaching and learning 0 4 4 29 51 88 5% 91% 0 allow to reduce the time and effort of
professors and students 7 10 16 29 25 87 20% 62% 1 improve access to education and
training 1 2 7 26 52 88 3% 89% 0
allow to improve the professional
practice of the teacher 2 1 15 32 36 86 3% 79% 2 facilitate collaborative learning 1 5 15 25 42 88 7% 76% 0 promote student involvement in
learning 3 9 22 28 26 88 14% 61% 0
Question D7 - Identify the digital tools used in your classroom and the pedagogical activities you promote with it.
This was an open question and the answers were very diverse. The digital tools most referred were the Powerpoint and the Moodle/e-learning platform. The Powerpoint is used for presentations whereas the Moodle/e-learning platform promotes different pedagogical functions such as: 1) sharing knowledge through videos/audio, written materials, among others; 2) interaction between students and between students and teachers, promoting debates and clarifying doubts; 3) conducting evaluation through online tests.
The digital tools less referred were GoogleDocs, Kahoot, and statistical software like E-Views, Statistics or SPSS. GoogleDocs was less referred maybe because Moodle allows document sharing. Software such as E-views, Statistics and SPSS are used in more specific areas.
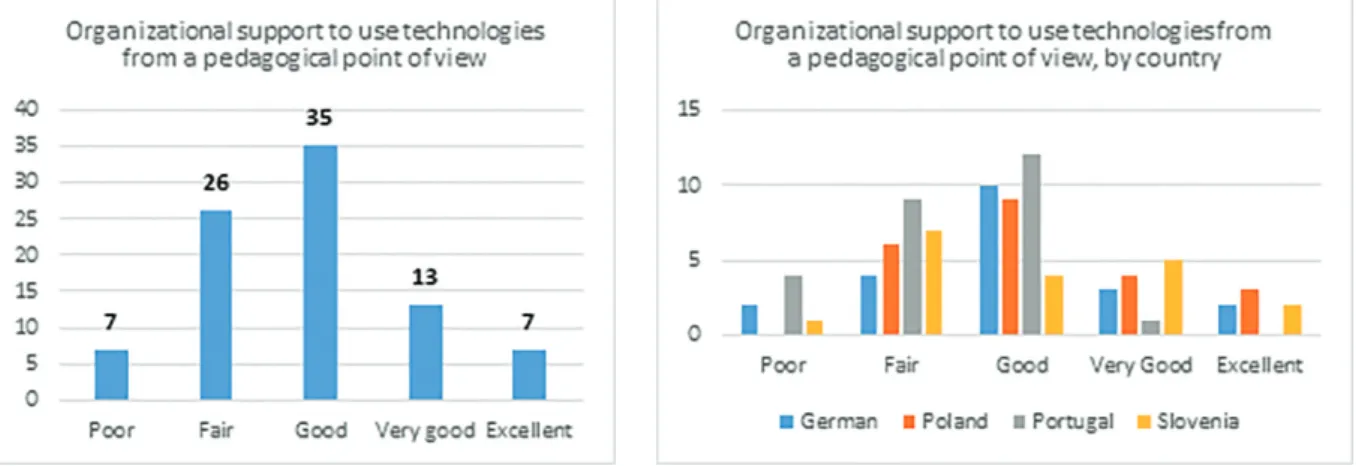
Question D8 - What level of support do you have in your organization to use the technologies from a pedagogical point of view?
considered the support in their institutions as Fair or Good whereas in Portugal nobody considered it as Excellent. In the two other countries, the answers showed a normal distribution of values.
Chart 3.4.1. Organizational support Chart 3.4.2. Organizational support by country Question D9 - Do you participate in personal or professional learning networks?
The question on participation in personal and professional networks of learning revealed that more than half (55%) of the respondents do not know or do not recognize advantages in participating in this type of networks.
Question D10 - Rate the importance of the following aspects for the safe use of technologies. (1 - Not important at all, 5 - Very important)
Regarding the safe use of technologies, the questions access to illegal information and digital footprint were not answered by a large number of respondents (table 3.4.6). This corresponded to a change from the previous questions where the lack of answer was not important. The credibility of sources and sites was the aspect with the most consistency whereas the access to illegal information had very scattered answers.
Table 3.4.6. (Importance of the following aspects for technology insurance) Value of technologies in teaching and learning 1 2 3 4 5 responseNo
credibility of sources and sites 0 0 3 22 61 2 publication of personal data 4 1 17 17 44 5 access to illegal information 13 5 15 10 32 13 behaviors on the internet 2 2 11 23 45 5
digital footprint 2 3 17 25 31 10
Some final remarks on the Using digital technologies in the process of teaching and learning group of questions
The first highlight is the importance the majority of respondents gave to digital technologies (question D2). Despite the importance given to technologies, respondents revealed little knowledge about audio, video, and multimedia edition software or building Web pages software (question D3).
Regarding the use of technologies in the teaching-learning context, we believe that the most used are the learning management systems and the already existing audio and video resources (question D5).
We also believe that the collaborative tools provided by Web 2.0 are little valued for participating in learning networks (question D9). Digital-portfolios and social networks are not used much either (question D5).
3.5. Intercultural entrepreneurship - how to include intercultural aspects in regular classes
The analyzed questionnaire deals with the state of integration of interculturality in the study programs and explores the personal development of interculturality among the teachers. The analysis of the data of this questionnaire is structured the way the questionnaire is designed, which means question after question will be discussed. Charts and tables are used to illustrate the data.
Question E1 - Evaluate your current state of development on the subject of Interculturality/Intercultural Management (1 - Not at all, 5 - a lot).
32 of the 88 participants assessed a ‘4’ for their state of development on the subject of interculturality. That means the majority thinks they have a good understanding about the discussed topic. 24 indicated a ‘3’ and 21 think their current state of development on this subject is advanced and assessed a ‘5’.
Compared with the different countries, in which the participants work (question A1), Portugal shows a better evolved state of development in terms of interculturality and intercultural
management than the other countries. Chart 3.5.1. State of development on the subject of interculturality
The participants from Germany have more doubts about their development on this topic and Slovenia and Poland show very similar responses.
Question E2 - How open are you towards intercultural learning methods? (1 - Not at all; 5 - a lot)
This question is analyzed by comparing the answer options with the different countries (question A1) as well. There’s a clear feedback that most of the participants is very opened towards intercultural learning methods, especially the participants from Poland and Germany. Only 5 out of 88 assessed a ‘1’ and a ‘2’ and are therefore not convinced about intercultural learning methods.
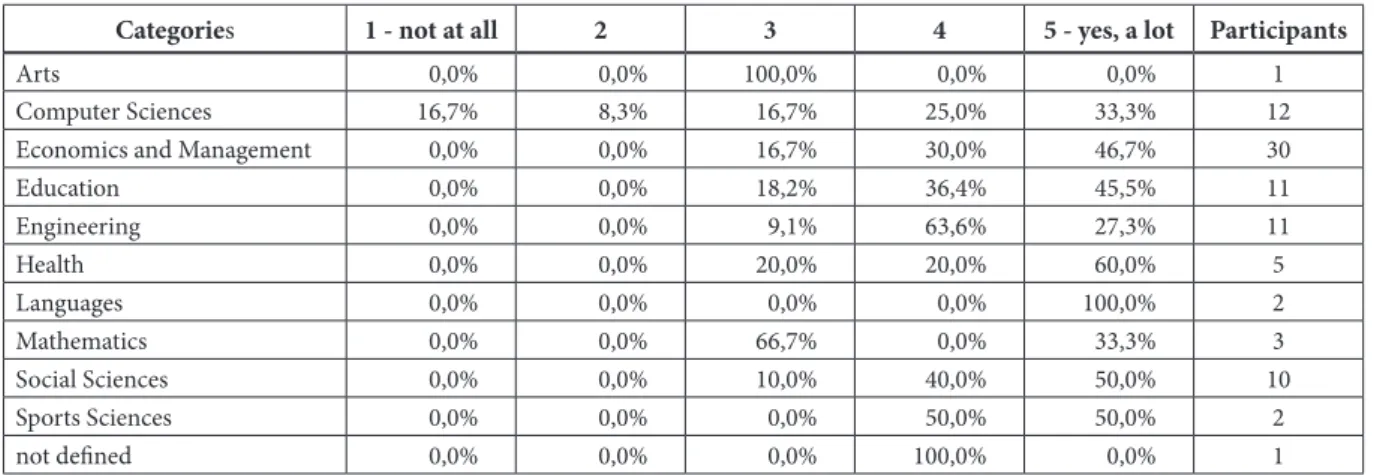
Question E3 - Do you see cultural diversity as an added value to your lessons? (1 - Not at all; 5 – A lot) Table 3.5.1. cultural diversity as an added value to your lessons?
Categories 1 - not at all 2 3 4 5 - yes, a lot Participants
Arts 0,0% 0,0% 100,0% 0,0% 0,0% 1
Computer Sciences 16,7% 8,3% 16,7% 25,0% 33,3% 12
Economics and Management 0,0% 0,0% 16,7% 30,0% 46,7% 30
Education 0,0% 0,0% 18,2% 36,4% 45,5% 11 Engineering 0,0% 0,0% 9,1% 63,6% 27,3% 11 Health 0,0% 0,0% 20,0% 20,0% 60,0% 5 Languages 0,0% 0,0% 0,0% 0,0% 100,0% 2 Mathematics 0,0% 0,0% 66,7% 0,0% 33,3% 3 Social Sciences 0,0% 0,0% 10,0% 40,0% 50,0% 10 Sports Sciences 0,0% 0,0% 0,0% 50,0% 50,0% 2 not defined 0,0% 0,0% 0,0% 100,0% 0,0% 1
The question is analyzed by combining the data with the different scientific area categories in which the participants work (question A4). The table shows that especially participants from the categories Economics and Management, Education, Languages, Social Sciences and Sports Sciences see cultural diversity as an important added value to their lessons.
The responses from the categories Mathematic and Arts are more skeptical about that topic. All in all, the majority sees cultural diversity as an added value to their lessons.
Question E4 - To what extent do you incorporate the topic of “interculturality” into your lessons? (1 - Not at all; 5 - a lot)
Table 3.5.2. Incorporate the topic of “interculturality” into your lessons
Categories 1 - not at all 2 3 4 5 - yes, a lot Participants
Arts 0,0% 0,0% 100,0% 0,0% 0,0% 1
Computer Sciences 25,0% 16,7% 25,0% 16,7% 16,7% 12
Economics and Management 0,0% 13,3% 26,7% 26,7% 33,3% 30
Education 0,0% 36,4% 45,5% 18,2% 0,0% 11 Engineering 9,1% 27,3% 54,5% 9,1% 0,0% 11 Health 20,0% 0,0% 20,0% 60,0% 0,0% 5 Languages 0,0% 0,0% 0,0% 50,0% 50,0% 2 Mathematics 0,0% 33,3% 33,3% 0,0% 33,3% 3 Social Sciences 0,0% 0,0% 40,0% 0,0% 60,0% 10 Sports Sciences 0,0% 0,0% 50,0% 50,0% 0,0% 2 not defined 0,0% 0,0% 0,0% 100,0% 0,0% 1
This question is also analyzed comparing the answers with the different scientific area categories in which the participants work (question A4). The table shows that participants of the categories ‘Languages’ and ‘Social Sciences’ integrate the topic interculturality a lot into their lessons followed by the categories ‘Health’, ‘Social Sciences’ and ‘Sports Sciences’. The majority (30 of 88) answered this question
Question E5 - Do you use any teaching methods in your lessons to help integrate students of other nationalities?
Chart 3.5.3. Helping integrate students of other nationalities
The majority (54 of 88) answered this question with ‘yes’. Combining the answers of this question with the different countries, the table shows that participants who work in Portugal and Germany use more often teaching methods in their lessons which help integrating students of other nationalities than participants who work in Slovenia or Poland.
Question E6 - How would you rate the understanding between yourself and students of other nationalities (understanding of their behaviors)? (1 - Not at all; 5 - A lot)
Chart 3.5.4. Understanding between you and students of other nationalities
The majority answered this question by assessing a ‘4’, which means the understanding between the teachers and students of other nationalities is perceived as quite good.
Question E7 - Evaluate your ability to resolve conflicts and your intercultural fluency (communication skills and flexibility). (1 - Not at all, 5 - a lot)
This chart shows that 37 of 88 participants evaluated their ability to resolve conflicts and their intercultural fluency with ‘4’ followed by 23 who assessed a ‘3’. So, the majority is convinced to have a good ability to resolve conflicts, but there are also some who think their skills on that topic are only okay or not that good.
Chart 3.5.5. How to Assess Conflict Resolution Ability and Intercultural Fluency
Question E8 - Do you find it important to develop intercultural skills?
Almost all the participants find it important to develop intercultural skills, which is an important requirement for the project of developing a course for teachers about how to include intercultural aspects into regular classes.
Chart 3.5.6. Importance of developing intercultural skills Question E8a - Why do you think it is important to develop intercultural skills?
This is an open question and many participants mentioned the globalisation and therefore the importance of understanding other cultures and the development of intercultural competences. Another reason which is mentioned, is the reducing of conflicts and misunderstandings through a better understanding of other cultures which effects the increasingly interconnected business world as well.
Question E9 - Are you already familiar with the following concepts of culture? Table 3.5.3. Familiarity with concepts of culture
Answers yes uncertain no
onion model of culture (Hofstede) 28,4% 27,3% 44,3% cultural dimensions (Hofstede) 33,0% 20,5% 46,6% cultural dimensions (Hall) 33,0% 23,9% 43,2%
cultural iceberg (Hall) 31,8% 20,5% 47,7%
cultural dimensions (Trompenaars) 19,3% 22,7% 58,0%
The table shows the different possible answer options with their responses indicated in percentages. It demonstrates that most of the participants is not familiar with the concepts of cultures mentioned above.
Question E10 - Are intercultural events held at your university?
Chart 3.5.7. Intercultural events held at the university
This question was analysed combining the data with the different countries in which the participants work (question A1). The chart illustrates that in every university, in which the participants work, intercultural events are held.
Question E10a - Do you attend the intercultural events held at your university?
The majority, 56 out of 88, answered this question with ‘yes’ and attend intercultural events held at their university. 21 participants said ‘no’ and 11 gave no answer.
Since the question is formulated too unspecifically, it was difficult to analyze the data sufficiently. In the further process it will be an important task to specify the question and the term ‘intercultural event’ to avoid ambiguities and misunderstandings.
Question E10b - Why do not you attend the intercultural events at your university?
This is an open question and most of the answers imply time problems or lack of time as explanation why they don’t attend intercultural events. Some mention that they are not interested in these events or that they are not attractive enough.
Question E11 - Do you find it enriching to work in an intercultural team? (1 - Not at all, 5 - A lot)
The chart shows clearly that the majority finds it enriching to work in an intercultural team and only few have an opposite opinion about this topic.
Chart 3.5.8. Do you think it is enriching to work in an intercultural team?
Question E12 - How high do you think is the need to integrate intercultural contexts in university life? (1 - Not at all, 5 - a lot)
Chart 3.5.9. Do you think it is necessary to integrate intercultural contexts in university life?
This chart demonstrates the answers of this question compared with the different countries in which the participants work (question A1). It shows that the majority thinks there is a high need to integrate intercultural contexts in university life, especially participants from Poland and Portugal.
4. Final remarks
This final chapter focuses on the overall analysis of the results of each group of questions and includes some suggestions for the creation of the training modules.
Identification of the respondents
The collected responses, as a whole, are characterized by a balanced distribution across partner countries, as well as a uniform distribution by age group, gender, and years of experience in the teaching profession. However, the scientific areas of the respondents, despite their diversity, show a preponderance of the subject area of Economics and Management. Nevertheless, based on the dispersion of the areas of science in which the respondents are active, we will develop training modules that can be used in several areas of knowledge.
Teaching how to learn - through experimentation, experience and other methods activating students
The analysis of this group’s responses to the survey reveals that learning to learn is a theme to which teachers ascribe great importance.
With regard to active methodologies, many respondents use group and project work, but not methodologies related to the active participation of students in large groups, such as the 6X6X6 method.
Respondents also declare that they use feedback and formative assessment in their teaching practices. However, these concepts are not explored throughout the survey, and it seems to us that, due to their importance in the learning process, they should be included in the training modules.
The training modules will focus on the teacher’s role in the learning process. The knowledge of the individual characteristics of each student should be developed by the teacher, paying attention to every student, listening to the students, and encouraging them to express their own opinions. If students show any difficulties in formulating and achieving goals, the teacher should help them. These are some of the ways of getting to know each student’s special skills. It is also important that the teacher query the students to find out and understand how they assess their own participation in class.
Considering that the assessment of students is an important part of the learning process, the training modules should integrate the different forms it assumes: summative assessment, which is important for summarizing the knowledge acquired by the student, the feedback of which is usually limited to the score; and formative assessment, which serves for the student to realize what they have done well, what is wrong with their performance, and how they can improve their work.
The use of formative assessment assumes a perspective of teaching and learning in which “learners are the constructors of their own learning and the teacher is an organizer of contexts and tasks that promote learning experiences and a mediator between knowledge and the learner who acquires it” (Rodrigues, Pinto, & Pires, 2018, parag. 5).
In the process of formative assessment, the teacher defines the objectives of the lesson and formulates those objectives using language and in a way such that they can be understood by every student. At the end of a lesson, together with the student(s), the teacher should check whether the goals that had been set were achieved. The assessment criteria should be clear to the student, they must know exactly what will be assessed. The criteria also help pupils prepare for a test or accomplish their work, so that the teacher’s goal can be achieved. The teacher consistently assesses only what they announced previously.
We suggest that the quality of feedback should be taken into account, in the proposed training modules, as an important aspect of the learning process. Theoretical approaches have shown that good feedback should always contain four elements: 1) it should list and acknowledge positive aspects of the students’ work; 2) it should note what needs to be corrected or additional work that should be carried out by the student; 3) it should give tips on how the student should improve the particular task to which the feedback refers and 4) it should give tips on what direction the student’s work should take. Feedback must be closely related to the assessment criteria set out before the task is completed.
The implementation of strategies to foment students’ development towards independent lifelong learning is supported by all activating methods, consisting of independent work and subjective treatment of students throughout the entire process of academic education (including them in the planning, implementation, and control stages, and in the evaluation of the educational process). Geoff Petty (2004) proposes a “self-learning” method that strengthens students’ motivation to work, where students assume responsibility for
their own education. This method teaches active strategies to cope with difficulties and shapes an active attitude, allowing for full individualization of the learning pace and techniques used. The need to use this type of method, which favors the activity and independence of students, results from some of the deepest human needs – freedom and control. Independent learning is the greatest gift a teacher can offer their pupil, the most important goal of education (Petty, 2004). Nowadays, independent learning should be treated as a basic skill in everyone’s life, so this theme will be developed in the training modules.
Shaping attitudes of innovation, creativity, critical thinking, and teamwork during regular classes
The study has shown that, although teaching approaches which enhance creativity, innovation, critical thinking and teamwork skills are strongly present in teachers’ practices, there are differences related to their area of teaching: these approaches are used less frequently in the fields of Computer Science, Engineering, and Mathematics, while they are used most frequently in the field of Education. The main emphasis of the teaching of soft skills is on teamwork behaviour, with a little less emphasis given to creativity and innovation. The main teaching methods that we identified as being employed by teachers to enhance the development of soft skills and to foment the creation of new ideas are problem-based learning, self-directed learning, and group exercises/action learning. The less frequently used methods are competitions, role-playing, simulations, games, and group techniques. Considering these findings, we would like to encourage the use of these approaches in the proposed training modules, as well as some advanced strategies for the development of soft-skills which we also identified in the study, such as the use of YouTube videos, Lego Serious Play, Design Thinking, Creative Art, and learning through games.
Using digital technologies in the process of teaching and learning
Similarly, to the conclusions drawn in the previous points, teachers considered the role of digital technologies to be very important, both in the world at large and in the learning process in particular.
The majority of the respondents mention the use of several technologies in their lessons, mainly the use of resources available on the Internet. However, fewer references are made to the use of technologies in situations related to the production of resources, such as the production of video or audio, or the construction of web pages. There is also a lack of recognition of the importance of participating in collaborative networks and communities of practice.
Foremost, teachers need to receive training in teaching methodologies and in the use of digital technologies. We suggest that the modules could include the construction of a digital portfolio, which would organize not only the activities developed throughout the course, but also promote a reflexive approach to the learning process. Digital portfolios are recognized as having great value for students’ learning processes, namely because they can promote meaningful learning, engagement, autonomy, critical reflection, collaboration and sharing, creativity, and empowerment (Bauer, 2009; Pires & Rodrigues, 2018).
The development of competencies in the production of multimedia material, using audio, video, and multimedia techniques, should also be included in the modules of this project.
One of the aspects of the survey that reveals fewer competencies is related to participation in communities. Learning collaboratively with peers provides students with a sense of being accepted, valued, included, and encouraged by others, and the feeling that they are an important part of the life and activity of the classroom (Masika & Jones, 2016). This could be very important for the students’ learning and for teachers’ professional development. Therefore, it seems very important that the training activities include these aspects and the use of utilities that facilitate collaboration.
Of the universe of collaboration tools, the ones that we will include in the training modules are those that provide for the construction, maintenance and sharing of online scientific libraries, and that facilitate the sharing of knowledge and the construction of collective intelligence — such as Mendeley or Zotero. In this group, there are also tools that facilitate knowledge building and promote collaboration by allowing the collaborative editing of the same document by different users, regardless of their location, such as Google Docs, Google Sheets, Google Maps, etc. This collective editing of documents can be synchronous or asynchronous, and the type of document can be text, a spreadsheet or an electronic presentation, among others.
![Table 3.2.2. Main obstacles in using activating methods [Other]](https://thumb-eu.123doks.com/thumbv2/123dok_br/15650213.1058787/13.892.175.741.212.361/table-main-obstacles-using-activating-methods.webp)