EUROPEAN ORGANIZATION FOR NUCLEAR RESEARCH (CERN)
CERN-PH-EP/2013-037 2014/12/10
CMS-JME-13-006
Identification techniques for highly boosted W bosons that
decay into hadrons
The CMS Collaboration
∗Abstract
In searches for new physics in the energy regime of the LHC, it is becoming increas-ingly important to distinguish single-jet objects that originate from the merging of the decay products of W bosons produced with high transverse momenta from jets ini-tiated by single partons. Algorithms are defined to identify such W jets for different signals of interest, using techniques that are also applicable to other decays of bosons to hadrons that result in a single jet, such as those from highly boosted Z and Higgs bosons. The efficiency for tagging W jets is measured in data collected with the CMS detector at a center-of-mass energy of 8 TeV, corresponding to an integrated luminos-ity of 19.7 fb−1. The performance of W tagging in data is compared with predictions from several Monte Carlo simulators.
Published in the Journal of High Energy Physics as doi:10.1007/JHEP12(2014)017.
c
2014 CERN for the benefit of the CMS Collaboration. CC-BY-3.0 license
∗See Appendix A for the list of collaboration members
1
1
Introduction
The LHC at CERN probes a new energy regime in particle physics, where searches for physics beyond the standard model (SM) at high mass scale often involve objects with large transverse momenta (pT). In final states that contain the W±and Z gauge bosons or Higgs bosons (H), it is possible to achieve a high selection efficiency through the use of hadronic decay channels. At sufficiently large boost above order of pT >200 GeV, the final state hadrons from the W→ qq0 decay merge into a single jet, and the traditional analysis techniques relying on resolved jets are no longer applicable. However, in such cases the analysis of jet substructure can be used to identify those jets arising from decays of W, Z or H bosons. Because the values of the mass of the W and Z bosons are rather close to each other, we do not distinguish the two, and refer to such jets collectively as V jets, while the Higgs boson mass is significantly higher and can be distinguished. The focus of this paper is solely on the identification of W jets, however, we note that many of the procedures described are equally applicable for handling highly boosted Z and H bosons.
Measurements of jet substructure observables related to identification of W bosons have been previously reported by CMS [1, 2] and ATLAS [3, 4]. Several searches at CMS have employed jet substructure techniques for identifying (“tagging”) W jets and Z jets. These include searches in all-jet tt final states [5, 6], single and pair produced V bosons in inclusive dijet final states [7, 8], and searches in the VV final states, where one of the vector bosons decays leptonically [9, 10]. In these searches, a variety of different observables have been used to identify the V jets. This paper aims to compare and measure the performance in 8 TeV pp collisions of various jet substructure techniques that can be used to distinguish V jets from more ordinary quark- and gluon-initiated jets, which we refer to as QCD jets.
This paper is organized as follows. The CMS detector is described in Section 2. The procedures chosen for the reconstruction of events are described in Section 3. The data and simulated events used in our studies as well as the event selection criteria are presented in Section 4. In Section 5, through Monte Carlo (MC) simulation, we investigate the performance of jet sub-structure observables used to identify W jets, in order to find the best discriminants for such events. We compare these observables in different kinematic regimes, and examine factors that contribute to their performance. Their distributions in data are compared to those in MC simu-lations in Section 6, to learn how well current MC simusimu-lations can model the physical processes responsible for jet substructure. The methods used to extract data-to-simulation scale factors needed to correct W boson tagging efficiencies obtained from MC simulation are discussed in Section 6, and the mistagging rate of QCD jets in data is extracted. The goal being to provide these as reference tools for analyzing events with jets from V bosons in the final state. Finally, we give a summary of our studies in Section 7.
2
CMS detector
The central feature of the CMS detector is a 3.8 T superconducting solenoid of 6 m internal di-ameter. A complex silicon tracker, a crystal electromagnetic calorimeter (ECAL), and a hadron calorimeter (HCAL) are located within the magnetic field volume. A muon system is installed outside the solenoid, and embedded in the steel return yoke. The CMS tracker consists of 1440 silicon pixel and 15 148 silicon strip detector modules. The ECAL consists of 75 848 lead tungstate crystals, which provide coverage in pseudorapidity of|η| <1.48 in the central barrel
region and 1.48 < |η| < 3.00 in the two forward endcap regions. The muon system includes
(0.9 < |η| < 2.5), and resistive plate chambers (|η| < 1.6). A more detailed description of
the CMS detector, together with a definition of the coordinate system used and the relevant kinematic variables, can be found in Ref. [11].
3
Event reconstruction
Jets are reconstructed by clustering particles obtained using the particle flow (PF) algorithm [12– 14]. The PF procedure identifies each individual particle (a PF candidate) through an optimized combination of all subdetector information. The energy of photons is obtained directly from the ECAL measurement, corrected for suppression effects of energies from calorimetric channels with small signals (referred to as zero-suppression) [15]. The energy of an electron is deter-mined from a combination of the track momentum at the main interaction vertex, the corre-sponding ECAL cluster energy, and the energy sum of all bremsstrahlung photons associated with the track. The energy of a muon is obtained from the corresponding track momentum. The energy of a charged hadron is determined from a combination of the track momentum and the corresponding ECAL and HCAL energies, corrected for zero-suppression effects, and cali-brated for the nonlinear response of the calorimeters. Finally, the energy of a neutral hadron is obtained from the calibrated energies in ECAL and HCAL.
The PF candidates are clustered into jets using two algorithms: the anti-kT algorithm [16] with
the distance parameter R = 0.5 (AK5), and the Cambridge-Aachen algorithm [17, 18] with
the distance parameter R = 0.8 (CA8), as implemented in FASTJET version 3.0.1 [19]. While the CA8 algorithm with a larger distance parameter is used throughout this paper to select and identify W jets, the AK5 algorithm is used to put requirements on additional QCD jets in the event selection. The choice of these algorithms is further explained in section 5. To mitigate the effect of multiple interactions in the same bunch crossing, the so-called pileup (PU), charged hadrons that are not associated with the primary vertex are removed from the list of PF candidates. The procedure is referred to as charged-hadron subtraction [20] and strongly reduces the dependence of the jet energy and substructure reconstruction on pileup. An event-by-event jet-area-based correction [21–23] is applied to remove the remaining energy due to neutral particles originating from the other pp collision vertices. All jet substructure observables are computed using PF candidates calibrated prior to jet clustering. However, the resulting jets require another small correction to the jet momentum and energy that accounts for tracking inefficiencies and threshold effects. The typical jet energy resolution is 5–10% for jets with pT >200 GeV.
Two algorithms are used to reconstruct muons [24]: one proceeds from the inner tracker out-wards, while the other starts from tracks measured in the muon chambers and matches them to those reconstructed in the silicon tracker. Muons are identified using selection criteria
opti-mized for high-pT muons [24]. The selected muon candidates must be isolated from charged
hadron activity in the detector by requiring the scaler sum of transverse momenta (Itk) of tracks within a cone of∆R=p(∆φ)2+ (∆η)2<0.3 around the muon track, divided by the muon p
T, to be Itk/pT < 0.1. Electrons are reconstructed using a Gaussian-sum filter algorithm [15, 25], and each electron candidate must furthermore pass the identification and isolation criteria op-timized for high pTelectrons [25].
3
4
Data and simulated event samples
4.1 Event topologies
This study aims to distinguish W jets from QCD jets. We use three different final state topolo-gies to establish W jet identification in a broad region of phase space, thereby enabling a num-ber of physics data analyses. In the tt-enriched lepton+jets event topology, the decay of two top quarks results in a final state with two b quarks and two W bosons of which one decays leptonically and the other decays to hadrons. This topology provides a relatively pure source of W jets in data, and is used to compare the efficiencies of W-tagging in data and in simula-tion. In contrast, the W+jet event topology, where the W boson decays leptonically, and the inclusive dijet event topology are used as a source of QCD jets to study their W-jet tagging properties in data and in simulation. These are the benchmark scenarios for searches, where the leading backgrounds are SM W+jets and dijet production. The W+jet sample accesses the low pT regime, while the dijet sample reaches higher pT, and therefore both samples are ex-plored. To study the discrimination of W jets and QCD jets in the W+jet and dijet topologies, we use simulated samples of beyond-SM resonances decaying to the WW final state as source of W jets.
4.2 Data and simulated event samples
The data were collected with the CMS detector at a proton-proton (pp) center-of-mass energy of 8 TeV and correspond to an integrated luminosity of 19.7±0.5 fb−1[26].
As the default simulated signal sample, we consider a resonance X that decays to a pair of lon-gitudinally polarized W bosons. Such samples are produced by considering either a warped extra-dimensional model, where the SM fields propagate in the bulk [27–29], or models with SM-like high mass H bosons. Graviton resonance samples in the extra-dimensional model are produced with the JHUGEN3.1.8 [30, 31], interfaced withPYTHIA6 [32] for parton showering
including the effect of hard gluon radiation.PYTHIA6.426 is used with Tune Z2* [33] in this
pa-per. SM-like H boson samples are produced withPOWHEG1.0 [34–36] interfaced withPYTHIA6.
To study the effect of W boson polarization on the distributions of substructure variables, the model with the SM Higgs-like couplings is compared to a model with a purely pseudoscalar H boson which yields only transversely polarized W bosons. These samples are produced with
the JHUGEN and PYTHIA 6, with a resonance width of≈1% chosen to be narrower than the
experimental resolution of 5–10%.
The background is modeled using QCD multijet, W+jets, WW/WZ/ZZ, Drell–Yan (qq →
Z/γ∗ → ``), tt, and single top quark MC simulation samples. Three QCD multijet samples
are compared. A first sample is generated with MADGRAPH v5.1.3.30 [37], with
shower-ing and hadronization performed with PYTHIA 6. The second sample is generated as well
as evolved with HERWIG++ 2.5.0 [38] with tune version 23 [38]. The third sample is
gener-ated with PYTHIA 8.153 [39] with Tune 4C. MADGRAPH, PYTHIA 6 and PYTHIA 8 are used
with the CTEQ61L [40] parton distribution functions (PDF), whileHERWIG++ is used with the MRST2001 [41] PDF. Two W+jets samples with different parton shower models are compared:
one sample generated with MADGRAPHinterfaced withPYTHIA 6 and a second sample
gen-erated with HERWIG++. The single top quark and tt samples are simulated with POWHEG
interfaced with PYTHIA 6 using the CT10 [42] PDF. An alternative tt sample, generated with
MC@NLO[43] and evolved withHERWIG++ using the CTEQ6M [40] PDF, is also used for stud-ies of systematic effects. The Z+jets process is simulated with MADGRAPH interfaced with
All generated samples are processed through a GEANT4-based [44] simulation of the CMS de-tector. An average of 22 supplementary interactions are added to the generated events in order to match the additional particle production observed in data from the large number of PU proton-proton interactions occurring per LHC bunch crossing.
4.3 Event selection
The dijet and W+jet topologies are chosen to be in the kinematic regime typically considered in searches for new phenomena [7, 9]. In both topologies we focus on the W-jet tagging properties of the highest pTCA8 jet in the event, requiring|η| <2.4, so that the core of the jet falls within
the tracker acceptance. The ranges in jet pT and the resonance masses mX are chosen to have the pT distributions similar for signal and for background. For the W+jet topology, the jet pT is within 250–350 GeV and mX= 600 GeV, while for the dijet topology, the jet pTis within 400– 600 GeV and mX= 1 TeV.
Collision data events with a dijet final state are collected using the logical “OR” of a set of triggers based on requirements on HT = ∑jetspT (scalar sum of pT of the AK5 jets), and on the invariant mass of the two jets of highest pT. Subsequent event selection follows closely the VV resonance search in Ref. [7]. Events are initially selected by requiring at least two jets with pT > 30 GeV and|η| < 2.4. The two jets of highest pT are required to have a pseudorapidity separation|∆η| < 1.3, which rejects a large fraction of QCD multijet events. Finally, the dijet invariant mass is required to be larger than 890 GeV. This threshold is chosen such that the trigger selection for events with dijet masses above this threshold is 99% efficient. W-tagging is studied using the leading jet in the selected dijet events, with additional requirements set on jet pT.
The main goal of the kinematic selection of the W+jet sample is to isolate a sample of events with a highly boosted topology consistent with a leptonically decaying W boson recoiling against a high pTjet. The W+jet sample, as well as the tt sample discussed below, are collected using single-lepton triggers. The lepton pT thresholds of these triggers are 40 and 80 GeV for the muon and electron channels, respectively. Offline, at least one muon or one electron, with respective pT > 50 GeV or pT > 90 GeV, is required within respective |η| < 2.1 or |η| < 2.5.
Events containing additional muons with pT > 20 GeV and |η| < 2.4 or additional electrons
with pT > 20 GeV and|η| < 2.5 are rejected, in order to improve the purity of W+jet events.
A requirement on the imbalance in transverse momentum (EmissT ) is used to reduce the QCD multijet background. The EmissT is computed from the negative transverse component of the vector sum of all PF candidate momenta, and is required to be above 50 GeV or 80 GeV for the muon and electron channel. The threshold is higher in the electron channel to further suppress the larger background from multijet processes. The pT of the leptonically decaying W boson and of the CA8 jet with highest pT, are required to be>200 GeV. Additional criteria are applied to ensure that the leptonic W boson and the CA8 jet are mostly back-to-back in the transverse
plane: ∆R between the lepton and the jet must be greater than π/2; the azimuthal distance
∆φ between Emiss
T and the jet must be greater than 2.0 radians; and the azimuthal distance∆φ between the leptonically decaying W boson and the CA8 jet must also be greater than 2.0 radi-ans. Finally, a cutoff on additional jet activity in the event is applied to reduce the amount of tt background. We identify additional b jet candidates in the event by requiring that an AK5 jet, with an angular distance of∆R>0.8 to the CA8 jet, passes the CSV b-tagging discriminant [45] using a medium working point. To suppress tt background in the W+jet selections described above, we require that no such b jets be present in the event.
5
but instead require that there is at least one AK5 b jet, with an angular distance of∆R>0.8 to the CA8 jet considered as W jet candidate. To increase the statistical precision of the sample, we select the CA8 jet with the largest mass and with∆φ between the lepton and the jet greater than π/2 as W jet candidate, rather than the highest pTCA8 jet.
5
Algorithms for W jet identification
A jet clustering algorithm with R= 0.8 is used to identify W jets. A large value of R increases the efficiency to reconstruct W bosons with small boost as single jets, since the average angular distance between the W decay products is inversely proportional to the pT of the W. The cho-sen value of R provides a high efficiency for W bosons with small boost and ensures that no efficiency is lost in the transition from classical W reconstruction from two small jets at low W pT and reconstruction from a single large jet at higher W pT(see e.g. Ref. [46]). Another point to consider when choosing the value of R, is the tt data sample available for validating highly boosted W jets. If R is chosen too large, the b quark from the t → Wb decay tends to merge into the W jet. The chosen value of R is the result of a compromise between high efficiency for W bosons with small boost and a sufficiently large sample of W jets in tt data for validating the W jet identification algorithms.
(GeV) T W boson p 200 400 600 800 1000 1200 R e c o n s tr u c ti o n e ff ic ie n c y 0 0.2 0.4 0.6 0.8 1
Merged jet efficiency
single CA R=0.8 jet
R (W,jet) < 0.1
∆
Resolved jets efficiency
two AK R=0.5 jets ) < 0.1 j ,jet i R (q ∆ 8 TeV CMS Simulation
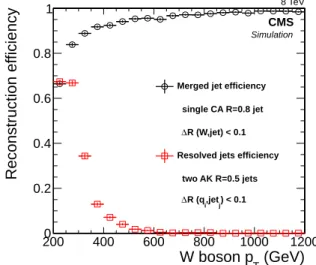
Figure 1: Efficiency to reconstruct a CA8 jet within∆R <0.1 of a generated W boson, and the efficiency to reconstruct two AK5 jets within∆R<0.1 of the generated quarks from longitudi-nally polarized W bosons, as a function of the pT of the W boson.
Figure 1 shows the pT range of W bosons for which the R = 0.8 algorithm is efficient and
compares this to the efficiency for reconstructing W bosons from two R = 0.5 jets. Above a pT of 200 GeV, the CA8 jet algorithm, used to identify W jets, becomes more efficient than the reconstruction of a W boson from two AK5 jets. In this paper we therefore study substructure
observables to identify W jets for an R = 0.8 algorithm. Whether an AK or a CA algorithm
is used in such comparison does not affect the overall conclusion. The choice of CA (with
R = 0.8) and AK (R = 0.5) is simply due to their wide use in CMS publications, where CA
was introduced in the first top tagging algorithm paper of CMS [47]. Whenever we refer to efficiency (e) in this paper, we refer to the full efficiency to identify a W boson relative to all generated W bosons decaying to hadrons.
5.1 Substructure observables
As the mass of the W boson is larger than the mass of a typical QCD jet, the jet mass is the primary observable that distinguishes a W jet from a QCD jet. The bulk of the W jet mass arises from the kinematics of the two jet cores that correspond to the two decay quarks. In contrast, the QCD jet mass arises mostly from soft gluon radiation. For this reason, the use of jet grooming methods such as filtering [48], trimming [49], or pruning [50, 51], improves discrimination by removing the softer radiation, as this shifts the jet mass of QCD jets to smaller values, while maintaining the jet mass for W jets close to the W mass. Studies of these grooming methods have been performed in Ref. [1], with the conclusion that the pruned jet mass provides the best separation between W signal and QCD background. In this paper, we use the grooming parameters proposed by the original authors.
Pruned jet mass is obtained by removing the softest components of a jet. The CA8 jet is reclustered from its original jet constituents, however the CA clustering sequence is modi-fied to remove soft and wide-angle protojets (single particles, or groups of particles already combined in the previous steps). In each recombination step, its hardness z is defined as z = min{piT, pjT}/pTp, where piT and pTj are the pT of the two protojets to be combined and pTpis the pTof the combination of the two protojets. The protojet with the lower piTis ignored if z < zcut = 0.1, and if it forms an angle∆R wider than Dcut = morig/porigT relative to the axis of the combination of the two protojets, where morigand porigT are the mass and pT of the original CA8 jet. The pruned jet mass distributions for W jets and QCD jets are shown in Fig. 2 (upper left) at generator level and detector level with pileup. Comparing the generator level predic-tions for the pruned jet mass of W jets with those at detector level with pileup, the widening of the peak due to detector resolution can be observed.
Further discrimination between W and QCD jets can be obtained from a more extensive use of jet substructure. Here we consider the following observables.
Mass drop µ[48] is calculated from the two subjets that are obtained by undoing the last iter-ation of the CA jet clustering via pruning. The idea behind the mass drop is that the W jet is formed by merging the showers of two decay quarks, and thus the mass of each quark subjet is much smaller than the mass of the W jet. In contrast, a massive QCD jet is formed through continuous soft radiation; the subjet with larger mass contains the bulk of the jet and the ratio of the mass of the large subjet to the total mass is therefore close to unity. We define the mass drop µ as the ratio of the masses of the higher mass subjet (m1) and the total pruned jet (mjet). The two subjets can also be used to estimate their∆R, which can provide additional discrim-ination. The distribution of µ is shown in Fig. 2 (upper middle). The differences between the generator level predictions and those at detector level with pileup are small for this observable, because the detector can resolve the two relatively well separated subjets.
N-subjettiness τN[52] is a generalized jet shape observable. N-subjettiness is computed under the assumption that the jet has N subjets, and it is the pT-weighted∆R distance between each jet constituent and its nearest subjet axis:
τN = 1 d0
∑
kpT,kmin{∆R1,k,∆R2,k,· · · ,∆RN,k} (1)
where k runs over all constituent particles. The normalization factor is d0= ∑k pT,kR0and R0is the original jet distance parameter. The τN observable has a small value if the jet is consistent with having N or fewer subjets, as almost every jet constituent will be close in∆R to its own true subjet. For discrimination between W jets with two subjets and QCD jets consistent with
5.1 Substructure observables 7
Pruned jet mass (GeV)
0 50 100 150 Normalized distribution 0 0.2 0.4 X → WLWL PYTHIA6 + <PU> = 22 + sim. + <PU> = 12 + sim. W+jets MG+PYTHIA6 + <PU> = 22 + sim. + <PU> = 12 + sim. W+jet CA R=0.8 < 350 GeV T 250 < p | < 2.4 η | 8 TeV CMS Simulation Mass drop 0 0.2 0.4 0.6 0.8 1 Normalized distribution 0 0.1 0.2 PYTHIA6 L W L W → X + <PU> = 22 + sim. + <PU> = 12 + sim. W+jets MG+PYTHIA6 + <PU> = 22 + sim. + <PU> = 12 + sim. W+jet CA R=0.8 < 350 GeV T 250 < p | < 2.4 η | < 100 GeV jet m 60 < 8 TeV CMS Simulation 1 τ / 2 τ 0 0.2 0.4 0.6 0.8 1 Normalized distribution 0 0.1 0.2 0.3 PYTHIA6 L W L W → X + <PU> = 22 + sim. + <PU> = 12 + sim. W+jets MG+PYTHIA6 + <PU> = 22 + sim. + <PU> = 12 + sim. W+jet CA R=0.8 < 350 GeV T 250 < p | < 2.4 η | < 100 GeV jet m 60 < 8 TeV CMS Simulation Qjet Γ 0 0.1 0.2 0.3 0.4 0.5 Normalized distribution 0 0.2 0.4 0.6 PYTHIA6 L W L W → X + <PU> = 22 + sim. + <PU> = 12 + sim. W+jets MG+PYTHIA6 + <PU> = 22 + sim. + <PU> = 12 + sim. W+jet CA R=0.8 < 350 GeV T 250 < p | < 2.4 η | < 100 GeV jet m 60 < 8 TeV CMS Simulation = 1.7) β ( 2 C 0 0.2 0.4 0.6 0.8 Normalized distribution 0 0.2 0.4 0.6 PYTHIA6 L W L W → X + <PU> = 22 + sim. + <PU> = 12 + sim. W+jets MG+PYTHIA6 + <PU> = 22 + sim. + <PU> = 12 + sim. W+jet CA R=0.8 < 350 GeV T 250 < p | < 2.4 η | < 100 GeV jet m 60 < 8 TeV CMS Simulation = 1.0) κ Jet charge ( -0.4 -0.2 0 0.2 0.4 Normalized distribution 0 0.05 0.1 0.15 0.2 only -W + <PU> = 22 + sim. only + W + <PU> = 22 + sim. W+jets MG+PYTHIA6 + <PU> = 22 + sim. W+jet CA R=0.8 < 600 GeV T 400 < p | < 2.4 η | < 100 GeV jet m 60 < 8 TeV CMS Simulation
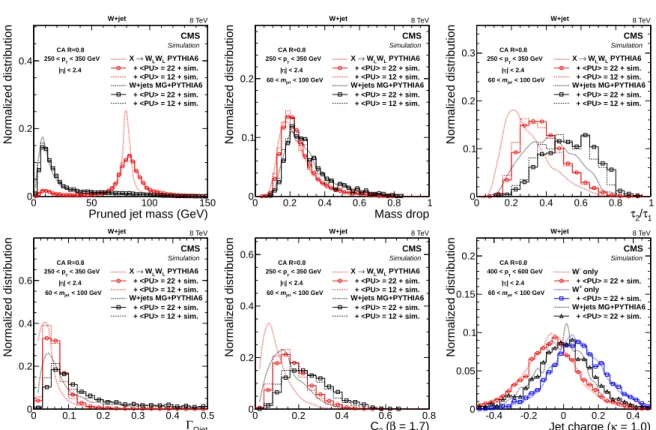
Figure 2: Distributions of six variables characterising jet substructure in simulated samples of highly boosted and longitudinally polarized W bosons and inclusive QCD jets expected in the W+jet topology. The discriminator distributions (except for the pruned jet mass in the upper left panel) are shown after a selection on the pruned jet mass of 60<mjet <100 GeV. MG denotes
the MADGRAPH generator. Thick dashed lines represent the generator predictions without
pileup interactions and without CMS detector simulation. The histograms are the expected distributions after full CMS simulation with pileup corresponding to an average number of 12 and 22 interactions. (upper middle) gives the mass drop variable, (upper right) the N-subjettiness ratio τ2/τ1, (lower left) the Qjet volatility, (lower middle) the energy correlation function double ratio C2β, and (lower left) the jet charge.
corresponding to a single subjet, the ratio τ2/τ1 is particularly useful as it tends to smaller values for W jets. The subjet axes are obtained by running the exclusive kTalgorithm [53], and reversing the last N clustering steps. The axes can be optimized to minimize the N-subjettiness value. As default, we use a “one-pass” optimization of the exclusive kTaxes, where one step of the iterative optimization is performed. By default τ2/τ1is calculated from the unpruned CA8 jets, but we also consider a pruned τ2/τ1calculated from pruned CA8 jets. Fig. 2 (upper right) shows the τ2/τ1distribution for W jets and QCD jets after requiring 60<mjet <100 GeV, and demonstrates its discrimination power after the pruned jet mass selection. The distributions at detector level with pileup are shifted significantly compared to the generator level predictions, though the discrimination power is preserved. The shift was due equally to detector effects and pileup.
Qjet volatility ΓQjet [54] is a statistical measure of an ensemble of similar jet clustering se-quences. A jet is defined by its cluster sequence, which is topologically a tree and is here referred to as “jet tree”. By randomizing the recombination scheme and running the pruning algorithm for each jet tree, we can define a family of trees for each jet from which we can com-pute a distribution of jet masses. The continuous soft radiation that forms massive QCD jets results in clustering sequences susceptible to fluctuations—a small deviation in soft radiation
can result in a very different order of putting the jet together. In contrast, W jets are character-ized by two strong jet cores, and small perturbations usually yield nearly identical clustering sequences. Therefore a large volatility of the clustering sequence is a characteristic of QCD jets, and can be used to distinguish them from signal W jets.
The procedure for quantifying the volatility of the jet clustering sequence is as follows. At every step of clustering, a weight wij is assigned to each constituent pair, and then one of the available pairs are randomly chosen and combined. The default weight is defined as:
wij =exp{−α
dij−dmin
dmin }, (2)
where dij = ∆R2
ijis the(η, φ)distance measure of the CA algorithm within the ij pair, dminis its minimum over all pairs at this stage in the clustering, and α is the rigidity controlling the level of randomness, where for α → ∞ represents the limit of a classical jet algorithm. We choose to generate 50 random jet trees. Qjet volatility is defined as the root-mean-square (RMS) of the jet mass distribution, divided by the average jet mass, or ΓQjet = RMS/hmi. To improve the speed of the algorithm without greatly degrading the performance, before Qjet clustering we pre-cluster the jet constituents down to 35 protojets. Fig. 2 (lower left) shows the distributions inΓQjet.
Energy correlation function double ratio C2β[55] is defined as follows: C2β = ∑i<j<kpTipTjpTk(RijRikRjk)
β∑ip
Ti (∑i<jpTipTj(Rij)β)2
(3) where i, j and k runs over all constituent particles satisfying i < j < k. Similarly to the ratio
τ2/τ1, the numerator quantifies how likely a jet is composed of two subjets, while the denom-inator gives a probability for being composed of one subjet. We study C2β with β = 1.7 as suggested in Ref. [55], which is suited to discriminate two-prong W jets from QCD jets consis-tent with having a single subjet. The distribution of C2βis given in Fig. 2 (lower middle).
Planar flowwith R=0.5 and trimmed grooming sensitivity [56] have also been considered in this study. Planar flow characterises the geometric distribution of energy deposition from a jet, which discriminates W jets from QCD jets, as the latter are more isotropic. Trimmed grooming sensitivity is defined as the decrease in jet mass, when the trimming algorithm [49] is applied to the jet.
Jet charge, Qκ[57] is a measure of the electric charge of the parton that is the origin of the jet. This variable has a long history in flavor tagging of neutral B mesons, and it is defined as the pT-weighted average charge of the jet:
Qκ= ∑iqi(p
i T)κ (pjetT )κ
(4) Here i runs over all particles in a jet. Our default choice for κ is 1. It can be used to provide additional discrimination among quark jets, gluon jets and W jets or also to distinguish the charged W’ signal from that of a neutral Z’. The differences between the jet charge distribution of W±jets and of neutral jets can be seen in Fig. 2 (lower right). Detector resolution and pileup have almost no effect on this variable as it is built from charged hadrons identified using the tracker where those from PU vertices are discarded.
5.2 Comparison of algorithms 9
5.2 Comparison of algorithms
We compare the performance of observables used to identify W jets with the goal of establish-ing which provides the best signal-to-background discrimination between W jets and QCD jets. Because the pruned jet mass is the best discriminant, we examine the other variables only for jets satisfying 60 < mjet < 100 GeV. Observables highly correlated with the pruned jet mass will therefore show weaker additional improvement in performance.
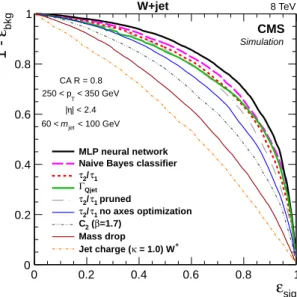
The figure of merit for comparing different substructure observables is the background rejec-tion efficiency as a funcrejec-tion of signal efficiency (“receiver operating characteristic”, or the ROC curve). Figure 3 shows the performance of the observables in the W+jet final state for jet pT 250–350 GeV. The pruned jet mass selection is applied in both the numerator and the denomi-nator of the efficiency, and only the additional discrimination power of the other observables is therefore shown in the figure. The performance of the τ2/τ1, pruned τ2/τ1, exclusive-kTτ2/τ1, ΓQjet, C2β, mass drop, and jet charge are compared. For the jet charge ROC curve, a positively charged lepton is required in the event selection, and therefore the discrimination power of negatively charged W jets against QCD jets is compared. We find that the best performant vari-able is τ2/τ1 up to an efficiency of 75%. Above an efficiency of 75%,ΓQjet is the best variable. The pruned τ2/τ1is slightly worse than the default τ2/τ1. The performance of the τ2/τ1 with-out optimization of the axes is worse than the τ2/τ1 variants with a ”one-pass” optimization. The worst performing variables are the mass drop, C2(β = 1.7), and the jet charge. We also
find that the discrimination power between W+ jets and W− jets varies by less than 10% for
values of the κ parameter in Eq. 4 between 0.3 and 1.0.
sig ε 0 0.2 0.4 0.6 0.8 1 bkg ε 1 - 0 0.2 0.4 0.6 0.8 1 CA R = 0.8 < 350 GeV T 250 < p | < 2.4 η | < 100 GeV jet m 60 < W+jet MLP neural network Naive Bayes classifier
1 τ / 2 τ Qjet Γ pruned 1 τ / 2 τ no axes optimization 1 τ / 2 τ =1.7) β ( 2 C Mass drop + = 1.0) W κ Jet charge ( 8 TeV CMS Simulation
Figure 3: Performance of several discriminants in the background-signal efficiency plane in the low jet pT bin of 250–350 GeV in the W+jet topology. The efficiencies and mistagging rates of the various discriminants are estimated on samples of W jets and QCD jets that satisfy a pruned jet mass selection of 60<mjet <100 GeV.
In addition to the performance of individual variables, we study how their combination can improve the separation between W and QCD jets. A multivariate optimization is performed using the TMVA package [58]. A combination of observables is considered in a naive Bayes classifier and in a Multilayer Perceptron (MLP) neural network discriminant. Additional ob-servables with respect to those shown in Fig. 3 are used in an attempt to increase the discrim-ination power. The variables used in both discriminants are the mass drop, ΓQjet, τ2/τ1, C2β,
the jet charge, the planar flow, the number of jet constituents,∆R between subjets, sensitivity of trimmed grooming, and the number of primary pp interaction vertices. The MLP neural network is trained using a signal sample from a SM Higgs-like resonance decaying to a pair of
longitudinally polarized W bosons and a background sample of W+jets generated with MAD
-GRAPH, splitting the events equally in training and test event samples to compute the ROC curve. The ROC curves obtained from the multivariate methods are shown in Fig. 3. Com-pared to the performance of τ2/τ1, a small improvement is obtained using such multivariate discriminators. This can be understood, because we find a large linear correlation between
τ2/τ1, which is the most sensitive variable over a large range of efficiencies, and most of the other observables. We therefore focus in the following of this paper on a baseline tagger based on τ2/τ1and point out that, not considering systematic uncertainties, there is potential gain in using multivariate discriminators.
The comparison above is performed after requiring the pruned jet mass to lie in the W boson mass window. Since all substructure variables are correlated with the jet mass, it is important to note that the variable comparison shown in Fig. 3 depends strongly on the choice of the primary discriminant. When the ungroomed jet mass is the primary discriminant, a combination with other variables provides a larger increase in discrimination, although the overall performance is still inferior to the default choice of the pruned jet mass and τ2/τ1.
5.3 Performance in simulation
In this section we examine the simulated pT and PU dependence of the W tagging efficiency. Efficiencies are defined for a pruned jet mass of 60 < mjet < 100 GeV, and N-subjettiness ratio of τ2/τ1<0.5. sig ε 0 0.2 0.4 0.6 0.8 bkg ε 1 - 0.8 0.85 0.9 0.95 1 < 600 GeV T 400 < p L W <PU> = 22 Generator, PU = 0 <PU> = 12 <PU> = 22 < 1.2 TeV T 0.8 < p < 100 GeV jet m 60 < selection jet m Only < 0.5 1 τ / 2 τ scan 1 τ / 2 τ CA R=0.8 | < 2.4 η | Dijets 8 TeV CMS Simulation sig ε 0 0.2 0.4 0.6 0.8 bkg ε 1 - 0.8 0.85 0.9 0.95 1 < 600 GeV T 400 < p L W <PU> = 22 Quark L W Gluon T W < 100 GeV jet m 60 < selection jet m Only < 0.5 1 τ / 2 τ scan 1 τ / 2 τ CA R=0.8 | < 2.4 η | Dijets 8 TeV CMS Simulation
Figure 4: Systematic effects on the performance of the pruned jet mass and τ2/τ1W-tagging al-gorithm in the high jet pTbin of 400–600 GeV. The performance of the pruned jet mass selection 60 <mjet <100 GeV in the various scenarios is indicated as a filled circle. The performance of the combination of 60< mjet < 100 GeV and τ2/τ1 < 0.5 is indicated as a filled rectangle. The lines correspond to the ROC curve of a selection on τ2/τ1in addition to 60 < mjet < 100 GeV. The solid line corresponds (in both parts) to the standard scenario with an average of 22 pileup interactions and longitudinally polarized W bosons (WL).
In Fig. 4, we compare systematic effects in terms of change in the ROC response in the dijet final state for 400< pT<600 GeV. In contrast to Fig. 3, where just the performance of other variables
5.3 Performance in simulation 11
was studied relative to that of mjet, here the efficiency is measured for the joint condition on mjet and τ2/τ1, demonstrating the impact of these discriminants. The performance for the working point requirements 60 < mjet < 100 GeV and τ2/τ1 < 0.5 is also indicated. The HERWIG++ sample is used to model QCD jets, since we observe that it models the pruned jet mass in data better thanPYTHIA6 does. Each of the displayed systematic effects is discussed below.
(GeV) T p 200 400 600 800 1000 1200 E ff ic ie n c y 0 0.2 0.4 0.6 0.8 1 W+jet selection jet m Signal, selection 1 τ / 2 τ + jet m Signal, | < 2.4 η CA R=0.8, | 8 TeV CMS Simulation E ff ic ie n c y 0.2 0.4 0.6 0.8 1 W+jet selection jet m Signal, selection 1 τ / 2 τ + jet m Signal, selection jet m Background, selection 1 τ / 2 τ + jet m Background, | < 2.4 η < 350 GeV, | T CA R=0.8, 250 < p 8 TeV CMS Simulation Number of vertices 10 15 20 25 30 B ε / S ε 0 10 20 30 40 selection jet m selection 1 τ / 2 τ + jet m
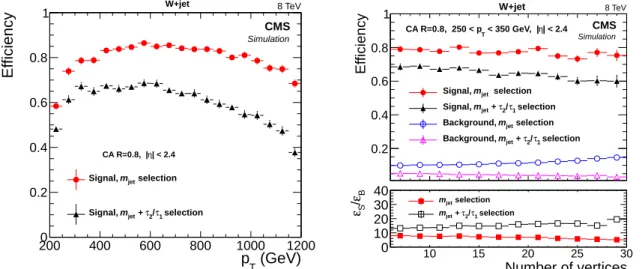
Figure 5: Efficiency of the mjet selection and the combined τ2/τ1 and mjet selection on WW signal samples as a function of (left) pT and (right) the number of reconstructed vertices. The figure on the right also shows the mistagging rate for QCD jets estimated from the W+jets background sample. The error bars represent the statistical uncertainty in the MC simulation and the horizontal ones the binning.
Figure 5 shows the efficiency of the baseline selection (60 < mjet < 100 GeV and τ2/τ1 < 0.5) determined from a WW simulation. The efficiency is given as a function of (left) jet pT and (right) the number of reconstructed vertices, reflecting the contribution from pileup. At low pT, the efficiency increases with pT for the same reason as in Fig. 1, namely that at higher pT the showers from the W decay quarks are more likely to be reconstructed within a single CA8 jet. Above 600 GeV, the efficiency begins to decrease as a function of jet pT, since at larger pTthe PF candidate reconstruction degrades in resolving the jet substructure and the pruning algorithm therefore removes too large a fraction of the jet mass. For Run II of the LHC, the particle flow reconstruction has been optimized by making better usage of the segmentation of the ECAL, where we expect to maintain constant efficiency up to at least pT =3.5 TeV [59].
The efficiency of the additional τ2/τ1 selection also drops as a function of pT. It is important to note that the same efficiency at an equivalent background rejection rate can be reached by adjusting the maximum τ2/τ1 as a function of pT. Figure 4 (left) shows that the ROC curve for jets with pT between 0.8 and 1.2 TeV (using a 2 TeV mass for the WW resonance) is almost indistinguishable from the ROC curve derived from the 400–600 GeV pT range, except that the working point corresponding to τ2/τ1 < 0.5 (square) is at a lower signal efficiency. Conse-quently, a fixed working point will degrade the efficiency with increasing pT. However, by shifting the working point, the same performance can be achieved.
The efficiency of the mjetselection as a function of the number of reconstructed vertices, shown in Fig. 5 (right), decreases by 6% between 5 and 30 reconstructed vertices, whereas the addi-tional τ2/τ1selection efficiency drops by 12% over the same range. However, the mistagging of the background also decreases with pileup for the same selection, yielding similar discrimi-nation. Efficiency and mistagging rate are affected by pileup in the same way, since additional
pileup shifts the τ2/τ1distribution towards higher values (towards background like) for both signal and background. Therefore, the same signal efficiency can be reached at the same back-ground rejection rate for up to 30 reconstructed vertices by merely adjusting the τ2/τ1selection, as demonstrated in Fig. 4 (left). Moving from an average pileup of 12 to 22 interactions shows almost no change in the ROC response.
We also study the performance of jet substructure tagging algorithms by convolving pileup, CMS detector resolution, and efficiencies in reconstructing the particles that form the jets. In Fig. 4 (left), the generator level predictions without pileup are compared with the performance after full CMS simulation with pileup. A small degradation is observed relative to generator level, but the performance at detector level is almost as good as predicted at particle level, although the W jet and the QCD jet τ2/τ1 distributions are shifted up significantly by pileup and detector effects, as seen in Fig. 2.
5.4 W-polarization and quark-gluon composition
An important factor that influences the W-tagging performance is the polarization of the recon-structed W bosons. Furthermore, the W polarization can be used to identify the nature of any new phenomena, such as, for example, through studies of new WW resonances, W boson helic-ities at large tt masses, or WW scattering. We study the effect of W polarization by comparing
simulated samples of X → WW, where the W bosons are either purely longitudinally (WL)
or transversely (WT) polarized. The key observable is the helicity angle of W → qq0 decays (cos θJ) as defined in the rest frame of the W boson relative to the W direction of motion [31]. The distribution of cos θJ at the parton level, where quarks are treated as final state particles, is presented in Fig. 6 (left). After reconstruction, the polarization in W jets can be recovered using the pruned subjets as a proxy for the W decay quarks. However, using the subjets, it is not possible to distinguish the fermion and antifermion in the W decay, which restricts the dis-tributions to 0 ≤ cos θJ ≤ 1. Figure 6 (right) shows the helicity angle between the two pruned subjets for a 600 GeV X resonance, differing from Fig. 6 (left) in that it includes reconstruction and acceptance effects. The depletion of events at|cos θJ| ≈1 is due to two acceptance effects. When θJ ≈0, the partons would be overlapping and thus reconstruction of two subjets is diffi-cult. When θJ ≈π, the one subjet tends to be much softer than the other and this can cause the
loss or misidentification of the subjet originating from one of the W decay partons. It appears that transversely polarized W bosons decay with the quarks emitted closer to the direction of the W, and therefore can be used to determine the polarization of the W boson. Going further, the reconstructed cos θJis compared to the parton-level information. The resolution on the an-gular distance between two subjets in the laboratory frame is approximately 10 mrad, which translates to a resolution of approximately 65 mrad on θJ in the W rest frame. The resolution remains relatively constant over a large range of W jet pT.
Fig. 4 (right) compares the signal-to-background discrimination of the W tagger for pure WL and pure WT signal samples. We observe that the pruned jet mass selection is less efficient for WT; this is consistent with Fig. 6 (right), where the WT jets with |cos θJ| ≈ 1 are removed by the pruned jet mass selection. This can be explained by a higher asymmetry in the pT of the two quarks from the WT decay, such that the pruning algorithm in a considerable fraction of events rejects the particles from the lower pT quark and yields a much lower jet mass. In
addition, the ∆R separation between the partons for pure WL bosons is smaller on average
than for WT bosons and is more likely to be accepted by a CA8 jet. Of the two effects, the dominant contribution depends on the transverse momentum of the W jet. For higher jet pT, the difference in the reconstructed cos θJand∆R between WLand WTbecomes larger since the more QCD-like topology of the transversely polarized W bosons becomes important, i.e. it is
13 J θ cos -1 -0.5 0 0.5 1 Normalized distribution 0.05 0.1 8 TeV only L W WT only | J θ |cos 0 0.2 0.4 0.6 0.8 1 Normalized distribution 0 0.1 0.2 0.3 only L W + <PU>=22 + sim. only T W + <PU>=22 + sim. W+jet CA R=0.8 < 350 GeV T 250 < p | < 2.4 η | < 100 GeV jet m 60 < 8 TeV CMS Simulation
Figure 6: (left) Generator level cos θJdistributions for longitudinally and transversely polarized W bosons. (right) Subjet angular observables after a selection on pruned jet mass of WL and WT samples for jets with 250< pT <350 GeV.
easier to distinguish WL and WT. The τ2/τ1 discrimination power is also degraded for WT, although, to a smaller degree than the pruned jet mass.
The composition of the QCD background also influences the discrimination of the variables discussed in Section 5, since the properties of quark- and gluon-initiated jets differ. For exam-ple, gluon jets tend to have a larger jet mass than quark jets and therefore fewer gluon jets are rejected by the pruned jet mass selection; this can be seen in Fig. 4 (right). On the contrary, the τ2/τ1discriminator rejects more gluon jets than quark jets and for these reasons a similar performance for quarks and gluons is achieved for the working point of τ2/τ1 <0.5.
6
Performance in data and systematic uncertainties
6.1 Comparison of data and simulation
We compare the distributions of substructure observables between simulation and data in in-clusive dijet, W+jet and tt samples. The W+jet and dijet events are compared in respective jet pT bins of 250–350 GeV and 400–600 GeV, and with jets in the tt sample with pT > 200 GeV.
Simulation with different parton shower models of PYTHIA 6, PYTHIA 8 and HERWIG++ are
also compared.
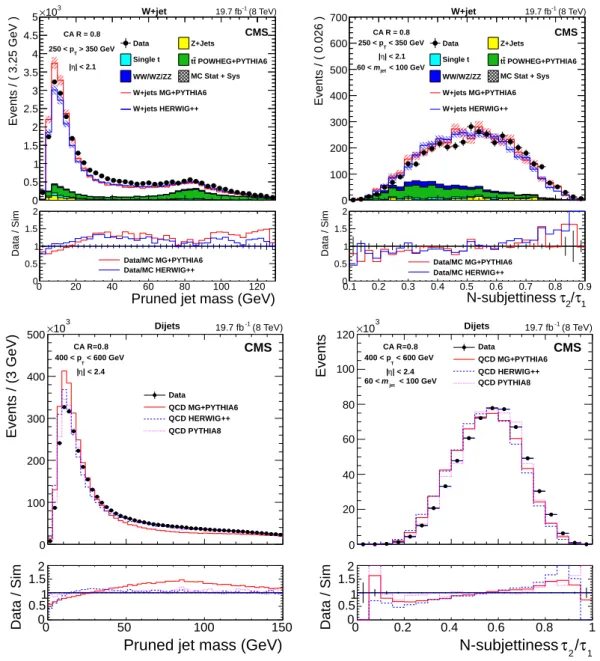
In Fig. 7, the pruned jet mass distribution is shown for both data and simulation in the dijet and W+jet samples that probe the W-tagging variables using QCD jets. We find that the agreement is good between data and simulation, butHERWIG++ agrees better thanPYTHIA6, andPYTHIA8 shows best agreement. Similar findings have been reported in Ref. [1, 2, 4]. The τ2/τ1variable is also shown and found to agree better withHERWIG++ and best withPYTHIA8.
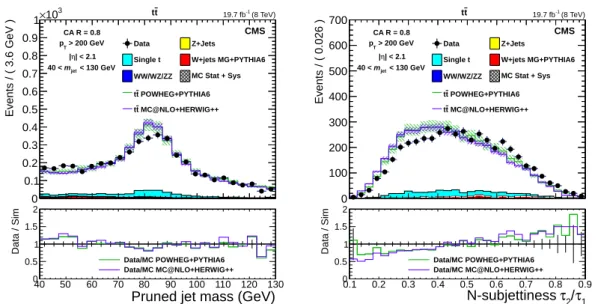
To probe the description of W jets, we use the control sample of pure W bosons in the data from the high pT lepton+jets tt sample. The pruned jet mass and τ2/τ1 distributions in the tt control sample are shown in Fig. 8 for the muon selection. The plots include systematic and statistical uncertainties, where the band of systematic uncertainty represents the normalization uncertainties on the VV, single top quark and W+jets cross sections. The systematic uncertainty is estimated to be 20% determined from the relative difference in the mean value between the
Events / ( 3.25 GeV ) 0 0.5 1 1.5 2 2.5 3 3.5 4 4.5 5 3 10 × Data Z+Jets Single t tt POWHEG+PYTHIA6 WW/WZ/ZZ MC Stat + Sys W+jets MG+PYTHIA6 W+jets HERWIG++ W+jet CA R = 0.8 > 350 GeV T 250 < p | < 2.1 η |
Pruned jet mass (GeV)
0 20 40 60 80 100 120 Data / Sim 0 0.5 1 1.5 2 Data/MC MG+PYTHIA6 Data/MC HERWIG++ (8 TeV) -1 19.7 fb CMS Events / ( 0.026 ) 0 100 200 300 400 500 600 700 Data Z+Jets Single t tt POWHEG+PYTHIA6 WW/WZ/ZZ MC Stat + Sys W+jets MG+PYTHIA6 W+jets HERWIG++ W+jet CA R = 0.8 < 350 GeV T 250 < p | < 2.1 η | < 100 GeV jet m 60 < 1 τ / 2 τ N-subjettiness 0.1 0.2 0.3 0.4 0.5 0.6 0.7 0.8 0.9 Data / Sim 0 0.5 1 1.5 2 Data/MC MG+PYTHIA6 Data/MC HERWIG++ (8 TeV) -1 19.7 fb CMS 0 50 100 150 Events / (3 GeV) 0 100 200 300 400 500 3 10 × Data QCD MG+PYTHIA6 QCD HERWIG++ QCD PYTHIA8 CA R=0.8 < 600 GeV T 400 < p | < 2.4 η | Dijets 19.7 fb-1 (8 TeV) CMS
Pruned jet mass (GeV)
0 50 100 150 Data / Sim 0 0.51 1.5 2 0 0.2 0.4 0.6 0.8 1 Events 0 20 40 60 80 100 120 3 10 × Data QCD MG+PYTHIA6 QCD HERWIG++ QCD PYTHIA8 CA R=0.8 < 600 GeV T 400 < p | < 2.4 η | Dijets < 100 GeV jet m 60 < (8 TeV) -1 19.7 fb CMS 1 τ / 2 τ N-subjettiness 0 0.2 0.4 0.6 0.8 1 Data / Sim 0 0.51 1.5 2
Figure 7: Pruned jet mass and N-subjettiness ratio τ2/τ1distributions in data and simulation for W+jets events in (upper left) and (upper right) and for dijet events in (lower left) and (lower right). MG denotes the MADGRAPH generator. Below each figure the relative deviations are
plotted between data and simulations.
recent cross section measurement at√s = 8 TeV at CMS and the SM expectation [60]. The agree-ment between simulation and data is reasonable, but there are discrepancies of the order of 10%. In Section 6.3 we describe the derivation of data-to-simulation scale factors to correct for these discrepancies. Generally,POWHEGinterfaced withPYTHIA6 provides a better description
of the tt sample thanMC@NLOinterfaced withHERWIG++.
Finally, we compare the jet charge distribution of W jets in data and in simulation using the tt sample. By selecting a negatively or positively charged lepton, we can effectively choose a W+ or W− jet. This can be seen in Fig. 9. While W+ and W− jets can’t be distinguished on an event-by-event basis, their contributions to the tt data sample can be separated with a significance larger than 5 standard deviations. The jet charge distribution is well described by
6.2 Mistagging rate measurement 15 Events / ( 3.6 GeV ) 0 0.1 0.2 0.3 0.4 0.5 0.6 0.7 0.8 0.9 1 3 10 × Data Z+Jets Single t W+jets MG+PYTHIA6 WW/WZ/ZZ MC Stat + Sys POWHEG+PYTHIA6 t t MC@NLO+HERWIG++ t t t t CA R = 0.8 > 200 GeV T p | < 2.1 η | < 130 GeV jet m 40 < (8 TeV) -1 19.7 fb CMS
Pruned jet mass (GeV)
40 50 60 70 80 90 100 110 120 130 Data / Sim 0 0.5 1 1.5 2 Data/MC POWHEG+PYTHIA6 Data/MC MC@NLO+HERWIG++ Events / ( 0.026 ) 0 100 200 300 400 500 600 700 Data Z+Jets Single t W+jets MG+PYTHIA6 WW/WZ/ZZ MC Stat + Sys POWHEG+PYTHIA6 t t MC@NLO+HERWIG++ t t t t CA R = 0.8 > 200 GeV T p | < 2.1 η | < 130 GeV jet m 40 < (8 TeV) -1 19.7 fb CMS 1 τ / 2 τ N-subjettiness 0.1 0.2 0.3 0.4 0.5 0.6 0.7 0.8 0.9 Data / Sim 0 0.5 1 1.5 2 Data/MC POWHEG+PYTHIA6 Data/MC MC@NLO+HERWIG++
Figure 8: Pruned jet mass and τ2/τ1distributions for the lepton+jets tt control sample for the muon selection. Below each figure the relative deviations are plotted between data and simu-lations.
the simulation.
6.2 Mistagging rate measurement
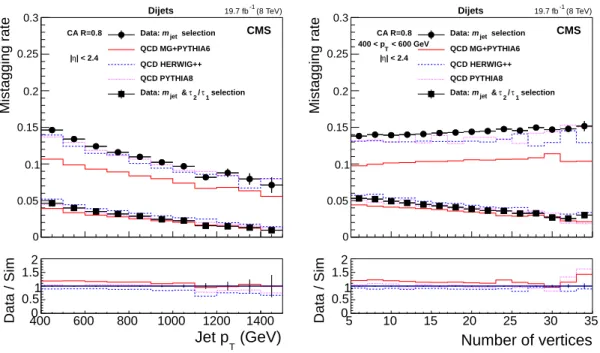
A dijet sample is used to measure the rate of false positive W tags, or mistags. The mistagging rate is measured in data and compared to simulation. As discussed previously, the W tagger selection requires 60 < mjet < 100 GeV and τ2/τ1 < 0.5. Figure 10 shows the fraction of jets passing just the mjet requirement, as well as the simultaneous mjet and τ2/τ1requirements, as a function of pT and of the number of reconstructed vertices. Similarly as in the case of the efficiency, the mistagging rate for the mjet and τ2/τ1 selections decreases as a function of pT.
The mistagging rate of only the mjet requirement in data is well reproduced by HERWIG++
andPYTHIA8, while MADGRAPH+PYTHIA6 underestimates it. When both the mjet and τ2/τ1
requirements are applied, the mistagging rate in data is reproduced better byPYTHIA8 than by
MADGRAPH+PYTHIA6 andHERWIG++. The pT dependence in data is well reproduced by all
generators.
As a function of pileup, the mistagging rate is stable within 1% for the mjet selection. The mistagging rate for the combination of the mjet and τ2/τ1 selections drops as a function of pileup as discussed in detail in Section 5.3. The PU dependence is well reproduced by the simulation.
6.3 Efficiency scale factors and mass scale/resolution measurement
The tt control sample is used to extract data-to-simulation scale factors for the W jet efficiency. These factors are meant to correct the description of the W-tagging efficiency in the simulation. They depend on the definition of the W-tagger as well as the MC generator used for simula-tion. We demonstrate the extraction of data-to-simulation scale factors for a simple selection on τ2/τ1 < 0.5, and jet mass scale, and resolution based on a simulation usingPOWHEG inter-faced withPYTHIA 6. We are concerned only with the efficiency for the pure W jet signal, and must therefore subtract background contributions to measure the scale factors. The pruned jet mass distribution is used to discriminate the pure W jet signal from background contributions. The generated W boson in the tt simulation provides a model of the contribution from the W
Events / (0.035) 0 50 100 150 200 250 Data: W + Data: W Simulation: W + Simulation: W (8 TeV) -1 19.7 fb CMS = 1.0) κ Jet charge ( -0.8 -0.6 -0.4 -0.2 0 0.2 0.4 0.6 0.8 Data / Sim 0.5 1 1.5 2
Figure 9: Jet charge distributions in the tt control sample in simulation and data for W+ and W−jets selected by requiring negatively and positively charge leptons, respectively. Simulated distributions reflect the sum of tt (POWHEGinterfaced withPYTHIA6) and all other background processes. Below each figure the relative deviations are plotted between data and simulations.
400 600 800 1000 1200 1400 Mistagging rate 0 0.05 0.1 0.15 0.2 0.25 0.3 selection jet m Data: QCD MG+PYTHIA6 QCD HERWIG++ QCD PYTHIA8 selection 1 τ / 2 τ & jet m Data: CA R=0.8 | < 2.4 η | Dijets 19.7 fb-1 (8 TeV) CMS (GeV) T Jet p 400 600 800 1000 1200 1400 Data / Sim 0 0.51 1.52 5 10 15 20 25 30 35 Mistagging rate 0 0.05 0.1 0.15 0.2 0.25 0.3 selection jet m Data: QCD MG+PYTHIA6 QCD HERWIG++ QCD PYTHIA8 selection 1 τ / 2 τ & jet m Data: CA R=0.8 < 600 GeV T 400 < p | < 2.4 η | Dijets 19.7 fb-1 (8 TeV) CMS Number of vertices 5 10 15 20 25 30 35 Data / Sim 0 0.51 1.52
Figure 10: Fraction of jets passing the mjet and τ2/τ1 selections in dijet data sample and simu-lation as a function of (left) pTand (right) the number of reconstructed vertices. The data over simulation ratio is shown for the combination of the mjetand τ2/τ1selections.
6.4 Systematic uncertainties 17
jet peak in the pruned jet mass. The contribution from combinatorial background is derived from tt simulation as well. This model is fitted directly in the distributions of data and in their simulation.
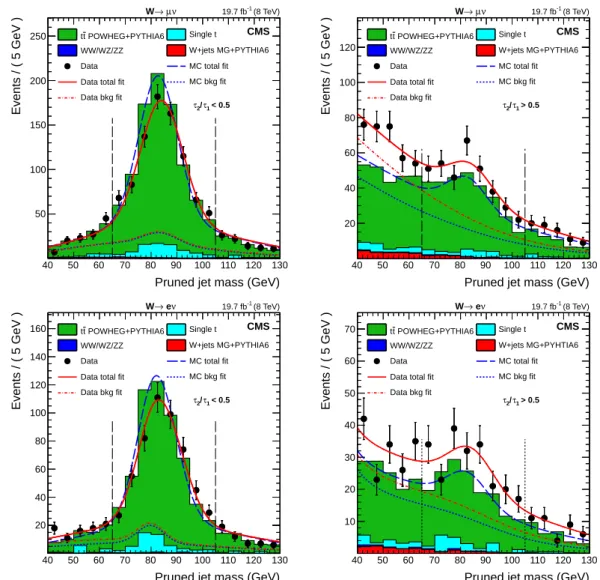
The scale factors (SF) for the selection on τ2/τ1 < 0.5 are extracted by estimating the selection efficiency on both data and simulation. The pruned jet mass distribution of events that pass and fail the τ2/τ1selection are fitted simultaneously to extract the selection efficiency on the pure W jet component as shown in Fig. 11. The ratio of data and simulation efficiencies are taken as the W-tagging efficiency SF. In the tt control region we use a mass window of 65–105 GeV, because of a slight shift in the mean mass of the W boson peak in tt events of ≈1.5 GeV. In simulation the slight shift in mass is found to be primarily due to extra radiation in the W jet from the nearby b quark. Additional requirements to reduce the combinatorial background from tt improve the precision of the determined scale factor. Therefore, the angular distance ∆R between the W jet candidate and the closest b-tagged AK5 jet is required to be less than 2.0, which is typical for highly boosted top quark decays [2]. This additional selection reduces the uncertainty on the scale factor by 21%. Further reduction of the combinatorial background can be achieved through requirements on top quark masses, but the limited number of tt events suggests that this can become relevant only with a larger data sample. The results of the fit are shown in Fig. 11. We find the “pass” sample agrees well between the data and simulation while the “fail” sample is not as well modeled, particularly when the failing jet is not a fully merged W boson but a quark or gluon jet. This is compensated in our computation of the data-to-MC scale factor. The scale factor is computed to be 0.93±0.06. The uncertainty in the SF is purely statistical. In Section 6.4, we discuss systematic effects to this scale factor. The pTdependence of the scale factor was also studied at a limited statistical precision. In two pTbins between 200– 265 and 265–600 GeV the scale factors were found to be 1.00±0.09 and 0.92±0.10, respectively. No significant pT dependence of the scale factor is observed.
To extract corrections to the jet mass scale and resolution, we use the meanhmiand resolution
σvalue of the Gaussian component of the fitted function of the W bosons in the passed sample.
Since we do not expect the jet mass scale and resolution to differ between electron and muon channels, the muon and electron data are fitted simultaneously, forcing the hmiand σ of the Gaussian component of the fit to be the same in the two channels. The fits are shown for the
τ2/τ1 < 0.5 selection in Fig. 11 (left column), and the resulting parameters are summarized in Table 1. We find that both the W jet mass scale and resolution in data are larger than that in simulation. In the simulationhmimust therefore be shifted by 1.7±0.6% and σ be enlarged by 11±9% to correct for the difference between data and simulation.
Table 1: Summary of the fitted W-mass peak fit parameters.
Parameter Data Simulation Data/Simulation
hmi 84.1±0.4 GeV 82.7±0.3 GeV 1.017±0.006
σ 8.4±0.6 GeV 7.6±0.4 GeV 1.11±0.09
6.4 Systematic uncertainties
We now discuss systematic uncertainties in the W tagging scale factor. Several important ef-fects, including the modeling of parton shower and the PDF, polarization of the W boson, the pileup, presence of nearby jets, the jet mass scale, jet energy scale, and resolution effects, as well as less dominant contributions from the uncertainties in lepton identification, b tagging and Emiss
T scale are considered. The effects from the modeling of the parton shower and the PDF are quantified by the difference between the efficiency in a tt sample generated withPOWHEG
Pruned jet mass (GeV) 40 50 60 70 80 90 100 110 120 130 Events / ( 5 GeV ) 50 100 150 200 250 tt POWHEG+PYTHIA6 Single t WW/WZ/ZZ W+jets MG+PYTHIA6
Data MC total fit
Data total fit MC bkg fit
Data bkg fit ν µ → W < 0.5 1 τ / 2 τ (8 TeV) -1 19.7 fb CMS
Pruned jet mass (GeV) 40 50 60 70 80 90 100 110 120 130 Events / ( 5 GeV ) 20 40 60 80 100 120 POWHEG+PYTHIA6 t t Single t WW/WZ/ZZ W+jets MG+PYTHIA6
Data MC total fit
Data total fit MC bkg fit
Data bkg fit ν µ → W > 0.5 1 τ / 2 τ (8 TeV) -1 19.7 fb CMS
Pruned jet mass (GeV) 40 50 60 70 80 90 100 110 120 130 Events / ( 5 GeV ) 20 40 60 80 100 120 140 160 tt POWHEG+PYTHIA6 Single t WW/WZ/ZZ W+jets MG+PYTHIA6
Data MC total fit
Data total fit MC bkg fit
Data bkg fit ν e → W < 0.5 1 τ / 2 τ (8 TeV) -1 19.7 fb CMS
Pruned jet mass (GeV) 40 50 60 70 80 90 100 110 120 130 Events / ( 5 GeV ) 10 20 30 40 50 60 70 tt POWHEG+PYTHIA6 Single t WW/WZ/ZZ W+jets MG+PYHTIA6
Data MC total fit
Data total fit MC bkg fit
Data bkg fit ν e → W > 0.5 1 τ / 2 τ (8 TeV) -1 19.7 fb CMS
Figure 11: Pruned jet mass distribution in the tt control sample that (left column) pass and (right column) fail the τ2/τ1 <0.5 selection for the (upper row) muon, and for the (lower row) electron channels. The result of the fit to data and simulation are shown, respectively, by the solid and long-dashed line and the background components of the fit are shown as dashed-dotted and short-dashed line.
6.4 Systematic uncertainties 19
from modeling the underlying event in the simulation are estimated by comparing three al-ternative tunes (Z2*, AMBT1 [61] and AMBT2 [62]) of the multiple parton interaction model in thePYTHIA6 simulation, and taking the maximal observed difference as an estimate of the
uncertainty.
As we have shown above, the polarization of the W boson has a significant impact on the W-tagging efficiency, which has to be taken into account when propagating the scale factor from tt events to other final states. The W boson polarization in tt events has been measured by CMS with a precision of 4% [63]. Although the agreement in this result between data and theory was found to be less than the quoted precision, we nevertheless use this number as an upper limit and include it into an uncertainty of the W tagging scale factor.
The effect from jet mass scale and resolution is evaluated by changing them by the uncertainty in the fitted mean and resolution, estimated in Section 6.3. Their impact on the W-tagging efficiency is small, since the W boson mass peak is well within the chosen pruned jet mass window.
The jet energy scale and resolution are changed within their pT- and η-dependent uncertain-ties [23, 64]. The impact of nearby jets on the scale factor is estimated by comparing it to a scale factor for an explicit requirement on the angular distance between the closest AK5 jet and
the W jet of ∆R > 1.3. The uncertainty from pileup is determined by moving the minimum
bias cross section within its measured uncertainty of 6% [65]. The scale factors for lepton and b jet identification are also changed within their uncertainties. Finally, uncertainties in the en-ergy and momentum scale and resolution of leptons and jets in the event are propagated to an uncertainty on the EmissT .
The results are summarized in Table 2. The dominant systematic effect on the scale factor for the efficiency is from modeling of the parton shower and PDF, with a systematic uncertainty of 6.0%. The quadratic sum of systematic uncertainties of 7.6% is comparable to the statistical uncertainty on the scale factor of 6.4%.
Table 2: Summary of uncertainties on the W jet identification efficiency scale factor.
Source Effect on the scale factor
Parton showering + PDF 6.0%
Underlying event <0.5%
W-polarization 2.0%
Pileup 1.8%
Nearby jets 2.4%
Jet mass scale <0.5%
Jet mass resolution 1.9%
Jet energy scale 1.9%
Jet energy resolution 0.9%
Lepton ID <0.5% b-tagging <0.5% EmissT <0.5% Total systematic 7.6% Statistical 6.4% Total 9.9%
7
Summary and outlook
In this paper we presented techniques for the identification of jets originating from highly boosted W bosons that decay into qq0, where the final decay products are reconstructed within a single jet, called a W jet. The pruned jet mass, used as the primary identifying observable for W jets, and several substructure observables that can provide additional signal to background discrimination, were evaluated for their impact.
The investigated substructure observables were three variants of the N-subjettiness τ2/τ1, the mass drop, the Qjet volatility, the double ratio of the energy-correlation function C2β, and the jet charge. Effects from pileup, detector resolution, polarization of the W boson, and the quark/gluon composition of QCD jets, as well as the performance of the discriminant at large pT were studied. The results were evaluated after applying a pruned jet mass selection, and the τ2/τ1with one-pass optimized kTaxes was found to be the single most discriminating ob-servable over a large range of signal efficiency. Combining all obob-servables into a multivariate discriminant, indicated a small improvement relative to just τ2/τ1.
The observables were compared in data and in the simulations, in both dijet and W+jet topolo-gies. Selecting these topologies provided complementary samples for the jet pT range, and for the background composition of light-quark- and gluon-initiated jets. Reasonable
agree-ment was found. In general, theHERWIG++ andPYTHIA8 generators provide better modeling
of jet substructure observables than PYTHIA 6. A lepton+jets tt sample was used to select W
jets in data, and this was compared to simulation. In this sample, we also demonstrated dis-crimination of the jet charge observable in data with W+ jets and W− jets, and we studied the performance of the W-jet tagging algorithm for a specific set of selections. The efficiency and mistagging rate were obtained as a function of pT. For a typical working point, an effi-ciency of 65% and a background rejection of 96% is achieved at pT =500 GeV. The mistagging rate for a broad range of pTagrees reasonably with simulation. Finally, a method using the tt sample was outlined for determining data-to-simulation scale factors for correcting differences between data and simulation of the τ2/τ1selection, the mass scales, and the resolution.
The methods introduced in this paper are directly applicable for identifying other massive objects that decay to hadrons. For identifying Z jets, the only difference is that the jet mass window is slightly higher. For identifying highly boosted Higgs bosons decaying to bottom quarks, the performance of these observables should be similar. An additional discriminating variable for Higgs that is not addressed in this study, is the possible tagging of b-jets. We leave to future studies the optimization of the method for the boosted Higgs bosons.
Acknowledgments
We congratulate our colleagues in the CERN accelerator departments for the excellent perfor-mance of the LHC and thank the technical and administrative staffs at CERN and at other CMS institutes for their contributions to the success of the CMS effort. In addition, we grate-fully acknowledge the computing centres and personnel of the Worldwide LHC Computing Grid for delivering so effectively the computing infrastructure essential to our analyses. Fi-nally, we acknowledge the enduring support for the construction and operation of the LHC and the CMS detector provided by the following funding agencies: the Austrian Federal Min-istry of Science, Research and Economy and the Austrian Science Fund; the Belgian Fonds de la Recherche Scientifique, and Fonds voor Wetenschappelijk Onderzoek; the Brazilian Fund-ing Agencies (CNPq, CAPES, FAPERJ, and FAPESP); the Bulgarian Ministry of Education and Science; CERN; the Chinese Academy of Sciences, Ministry of Science and Technology, and