ECONOMIC ANALYSIS OF MAIZE GROWN UNDER INCREASING NITROGEN DOSES IN SUCCESSION TO INTERCROPPED PASTURES
Abstract – The aim of this work was to carry out an economic analysis of production systems with the use of cold season pastures followed by maize cultivation with surface application of increasing doses of nitrogen fertilizer. The treatments were: black oat + 200 kg of N ha-1 (Bo+N); black oat + white clover (Bo+Wc); black oat + vetch (Bo+Ve); black oat + red clover (Bo+Rc); and black oat + forage peanut (Bo+Fp). Experimental randomized block design was used, with four replications. The forage species were evaluated as to dry matter production, chemical-bromatological composition, estimated milk production (kg ha-1) and gross income (R$ ha-1). Maize was cultivated in succession, with doses of 0, 100 and 200 kg of N ha-1, in a split-plot design. Among the profitability indices evaluated, the gross margin (R$ ha-1) stands outs. The data were submitted to analysis of variance and the means were compared through Tukey’s test at 5% probability. In the pasture phase, the Bo+N treatment presented higher gross income. In the cropping phase, the gross margin was higher in the Bo+Ve treatment, but it did not differ from the Bo+N treatment. In terms of system, the best economic result was obtained with the Bo+N treatment.
Keywords: Arachis pintoi, cover crops, profitability, gross margin.
ANÁLISE ECONÔMICA DE MILHO CULTIVADO SOB DOSES CRESCENTES DE NITROGÊNIO EM SUCESSÃO A PASTAGENS CONSORCIADAS
Resumo - O objetivo deste trabalho foi realizar uma análise econômica de sistemas de produção com o uso de pastagens de estação fria seguido do cultivo de milho com doses crescentes de adubação nitrogenada em cobertura. Os tratamentos foram: aveia preta + 200 kg de N ha-1 (Av+N); aveia preta + trevo branco (Av+Tb); aveia preta + ervilhaca (Av+Er); aveia preta + trevo vermelho (Av+Tv) e aveia preta + amendoim forrageiro (Av+Am). O delineamento experimental foi em blocos ao acaso com quatro repetições. As forrageiras foram avaliadas quanto a produção de matéria seca, composição químico-bromatológica, produção estimada de leite (kg ha-1) e renda bruta (R$ ha-1). O milho foi cultivado em sucessão, com doses de 0, 100 e 200 kg de N ha-1, em um delineamento de parcelas subdivididas. Dentre os índices de lucratividade avaliados, destaca-se a margem bruta (R$ ha-1). Os dados foram submetidos à análise de variância e as médias comparadas pelo teste de Tukey a 5% de probabilidade. Na fase pastagem, o tratamento Av+N apresentou maior renda bruta. Na fase lavoura a margem bruta foi maior no tratamento Av+Er, mas não diferiu do tratamento Av+N. Em termos de sistema, o melhor resultado econômico foi obtido com o tratamento Av+N.
Palavras-chave: Arachis pintoi, culturas de cobertura, lucratividade, margem bruta.
ISSN 1980 - 6477
Journal homepage: www.abms.org.br/site/paginas
Daniel Augusto Barreta(1)( ), Dilmar Baretta(1),
Flávio José Simioni(1) and Luiz Alberto Nottar(1)
(1)Universidade do Estado de Santa Catarina
E-mail: [email protected], [email protected],
[email protected], [email protected].
How to cite
BARRETA, D. A.; BARETTA, D.; SIMIONI, F. J.; NOTTAR, L. A. Economic analysis of maize grown under increasing nitrogen doses in succession to intercropped. Revista Brasileira de Milho e Sorgo, v. 19, e1137, 2020.
Brazilian Journal of Maize and Sorghum
In the agricultural science area, the scientific research is mostly targeted at assessment of response variables considering the technical aspect, so that evaluations that incorporate the economic aspect are less disseminated. However, it is worth pointing out that the economic aspect is the main attribute that ultimately defines the adoption or not of a specific technique /technology by rural producers (Soares et al., 2015).
With regard to the economic feasibility of pasture-based dairy farming, these systems are more flexible in relation to those with high supplementation and can be more or less intensified depending on the market’s economic condition. This happens because livestock feeding is the most important variable for the operating costs of dairy farming (Silva et al., 2008). Thus, when the aim is to increase the production of milk, the way to do that is definitely by increasing forage production, since high forage yield is required in order to maintain the economic viability of the system (Elgersma & Søegaard, 2018). In this case, one of the strategies to increase forage production is the use of nitrogen fertilizers.
Within this scope, selecting the forage species that is most suitable for the production system is a multidisciplinary task, since milk production and profitability are responses that vary as a function of the nutritive value and yield of the forage species (Doce et al., 2015). Despite that, there are few publications on milk production and economic responses as a function of the dose of nitrogen fertilizer applied in the context of the whole pasture-based production system (Macdonald et al., 2017).
In systems where cold season forage species are replaced with agricultural crops in the summer, the latter can be also regarded as cover crops, since they prepare the seedbed for implementation of the
next crop. Thereby, the system can be configured as an integrated crop-livestock production system, whose economic results are positive when compared to a system targeting at crop production only (Oliveira et al., 2013). Nevertheless, it is worth noting that those results are obtained with the sole use of grasses (Avena strigosa Schreb and Lolium multiflorum Lam.) in the pasture phase and soybean (Glicine max) in the cropping phase.
However, in systems where maize is included in the crop rotation, the sole use of grasses in the pasture phase can be disadvantageous, mainly due to N immobilization caused by the high C/N ratio of these materials (Finney et al., 2016). In this context, the use of grass-legume intercropping is an alternative to resolve the issue. In this regard, Cherubin et al. (2014) assessed the production of maize in Rio Grande do Sul-BR in succession to a variety of cover crops. The authors verified higher maize yield when the cereal was cultivated in succession to black oat and vetch mixture in relation to sole black oat or ryegrass. Nevertheless, the authors have not assessed the cutting effect on crops or the economic aspect of the work.
Within this scope, the objective of this work was to carry out an economic analysis of production systems that use cold season pastures followed by maize cultivation with increasing doses of surface-applied nitrogen fertilizer.
Material and Methods
The experiment was conducted in the municipality of Guatambu, Santa Catarina, in the Experimental Farm of the Higher Education Center (FECEO-UDESC), in an area with altitude of 510 m, pH previously corrected to 6.0, and free of weeds.
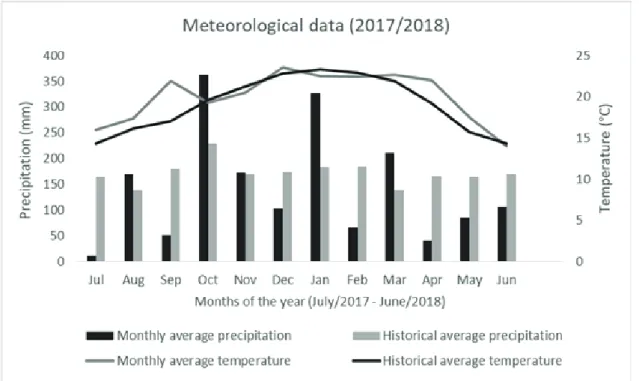
According to the Köppen classification, the climate in the region is temperate humid with hot summer (Cfa). The meteorological data for the experimental period are shown in Figure 1. The soil of the experimental area is classified as dystrophic Red Latosol. The experiment was divided in two stages: pasture phase and cropping phase.
Stage I
The first stage began in May 2017, consisting in the implementation of five different pasture arrangements: sole black oat (Avena strigosa cv. Embrapa 139) fertilized with 200 kg of N ha-1 (Bo+N); black oat + white clover (Trifolium repens cv. Zapican) (Bo+Wc); black oat + vetch (Vicia sativa cv. SS Ametista) (Bo+Ve); black oat + red clover (Trifolium pratense cv. Estanzuela 116) (Bo+Rc);
and black oat + forage peanut (Arachis pintoi cv. Belmonte) (Bo+Fp). The treatments were arranged in 80 m2 experimental plots, in a randomized block design consisting of five treatments, with four replications. The seeding rates were 70, 3, 50 and 8 kg ha-1 for black oat, white clover, vetch and red clover, respectively. In regard to the forage peanut, seedlings were planted so as to provide a stand density of 50,000 plants ha-1. The base fertilization (P & K) in the area followed the recommendations from CQFS – RS/SC (2016) for winter intercropping systems. In respect to N fertilization, only the sole black oat was fertilized with 200 kg N ha-1, subdivided into four dosages: 30 kg of N ha-1 at sowing, 56 kg of N ha-1 at tillering, and 57 kg of N ha-1 after the first and second cutting operations.
Cutting was mechanically done in the plots in three occasions: 66, 94 and 122 days after sowing
Figure 1. Meteorological data - monthly average precipitation (mm) and temperature (°C). Weather
(DAS). Before each cutting, sampling was carried out by using the “square method”, with cutting height of 10 cm from the soil. The material harvested in each replication, in the three cutting operations, was homogenized in proportion to their yield and sent for chemical-bromatological analysis through near-infrared reflectance spectroscopy (NIRS). The samples were evaluated as to crude protein (CP), ether extract (EE), neutral detergent fiber (NDF), acid detergent fiber (ADF), mineral matter (MM) and NDF digestibility in 48 hours (NDFD).
Based on the chemical-bromatological result of the samples, and with the use of Milk2016® spreadsheet (Undersander et al., 2013), the pasture potential for milk production was estimated per ton produced (kg of milk t-1 DM) and per area (kg ha-1). Currently, the use of this spreadsheet has become popular among the researchers as a pasture assessment tool, since it combines yield and nutritional quality in a single index (Bélanger et al., 2018).
After the third cutting, the plots were deferred for 37 days for biomass accumulation and subsequently desiccated with the use of non-selective herbicide, except in the plots with forage peanut, where selective herbicide was applied with the purpose to desiccate only the black oat crop.
Stage II
Maize (Agroceres 8088 VT PRO 2®) was planted in October 2017, in no-tillage system, with a seeding rate of 60,000 seeds ha-1, and fertilization
using 400 kg ha-1 of 9-33-12 fertilizer, according to the recommendations from CQFS – RS/SC (2016). Chemical control of weeds was performed 13 DAS in all plots, except for those plots with forage peanut, where the control was done manually in two
occasions: 13 and 48 DAS. The pest control was carried out in the entire area in two occasions: 13 and 34 DAS, while fungicide was applied 48 DAS.
The second variation factor of the experiment was implemented 23 DAS. The experimental plots were divided in three subplots of 26.7 m2, where
surface-applied doses of 0, 100 and 200 kg of N ha-1
were tested in two occasions: 23 and 39 DAS. As from that division, the experiment was regarded as a randomized block design with split-plots, five cover crops and three N doses, with four replications each. Harvesting was performed 159 DAS (March 2018) and five ears were harvested from the three central rows of each subplot. The grain weight was corrected to 13% of moisture and the results were extrapolated to the stand population of 57,000 plants, in order to obtain grain yield per hectare (kg ha-1).
Production costs and gross income
With regard to production costs, they were considered for an area of one hectare. The reference price for inputs was the nominal price practised by an agricultural company, located in the municipality of Chapecó, in two periods: April 2017 for inputs of stage I and September 2017 for inputs of stage II. That was the nominal value practised for the purchase of the products. In regard to the other costs, they were calculated based on the costs provided by Epagri/ Cepa (2017a; 2017b) that take into account the following components: labor, technical assistance, mechanical services, financial costs, general expenses and marketing costs.
With regard to those plots with forage peanut, the implementation cost was based on the price charged by one company located in the region, which is specialized in selling and planting seedlings
of perennial forage species. Nevertheless, that implementation cost was apportioned by ten, assuming the persistence of the forage peanut in the area for at least ten years (Fontaneli et al., 2012). In the areas with the presence of forage peanut, there was no application of herbicides for weed control. However, two manual cleaning operations were required. On average, 5 labor units ha-1 were estimated for each cleaning. The labor unit value was also based on the estimates provided by Epagri/Cepa (2017b).
Description of all operating costs for stage I is available in Table 1. The composition of costs for stage II is described in Table 2. Costs with urea, transportation and marketing for stage II depend on the applied dose, maize yield and gross income of the crop, respectively.
In regard to the selling price of the products, the milk price was determined based on the average price received by producers in Santa Catarina, in the months of July, August and September 2017 (months of pasture cutting operations), which was R$ 1.01 kg-1 of milk (Conseleite/RS, 2018). As to maize income, the base price used for calculation was R$ 33.89 bag-1 (60 kg), which corresponds to the average price received by producers in Santa Catarina in March 2018 (harvest) (Agrolink, 2018).
Economic analysis and statistical analysis
The milk2016® program does not take into account the production costs of dairy farming (electricity, labor, milking equipment, etc.), which does not allow the determination of some traditional economic indices of this activity, such as the gross margin. Nevertheless, the determination of the effective operating cost (EOC) for pastures (Martin et al., 1998) and the estimation of milk production per ton of DM (kg t-1 DM) are important indicators that help
determine the viability of the systems. In this sense, the following economic indices were determined, based on the available data:
a) Milk production per area (kg of milk ha-1); b) Gross income per area (R$ ha-1);
c) EOC for pasture production per kg of DM (R$ kg-1 of DM);
d) Production of milk in relation to EOC of pasture (kg of milk R$-1 invested);
e) Gross income of milk in relation to EOC of pasture (R$ R$-1 invested).
With respect to the second stage of the experiment, as it is essentially an agricultural crop, it was possible to quantify a larger number of production costs, such as the total variable costs (VC), according to the methodology proposed by Epagri/Cepa (2017a). In order to determine the total operating cost (TOC), an increment by 5% of the VC was considered for indirect costs, such as depreciation, social and financial costs (Martin et al., 1998). Based on that information, the following indicators of economic and technical efficiency were calculated, according to the methodology described by Simioni et al. (2017):
a)
Maize yield per area (kg ha-1);b)
Gross income (GI) per area (R$ ha-1), which is the quantity of maize produced (q), valued according to the market price (p) in March 2018 (GI = q * p);c)
Gross margin (GM) = GI-VC;d)
Net income (NI) = GI-TOC;e)
Portion of GI for payment of fixed costs (PPFC) = (GI-VC) / GI.Table 1. Unit cost and total cost of inputs and operations used for stage I (pastures), considering an area of
one hectare. Guatambu, SC.
Expenses Quantity Unit value (R$) Total value
(R$ ha-1)
Black oat seed (kg) 70.0 0.85 59.50
White clover seed (kg) 3.0 35.00 105.00
Red clover seed (kg) 8.0 32.00 256.00
Vetch seed (kg) 60.0 2.95 177.00
Forage peanut planting1 1.0 500.00 500.00
Fertilization P (kg) 190.5 1.08 205.74 Fertilization K (kg) 33.3 0.95 31.66 Urea (45%) (kg) 444.4 0.95 422.20 Non-selective herbicide (L) 3.0 19.15 57.45 Selective herbicide (L) 0.5 99.00 49.50 Machine-hour planting 1.0 138.70 138.70 Machine-hour desiccation 0.3 113.33 34.00 Machine-hour topdressing (3x) 1.2 67.24 80.69
1 For planting of forage peanut, a ten-year persistence in the area was considered, being the total implementation cost (R$
5,000.00) apportioned within the period.
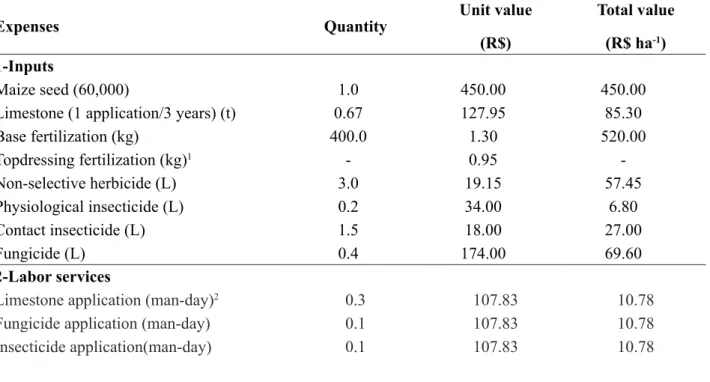
Table 2. Description of total variable cost (VC) of stage II (maize), considering an area of one hectare,
regardless of the treatments analyzed. Guatambu, SC.
Expenses Quantity Unit value
(R$)
Total value
(R$ ha-1)
1-Inputs
Maize seed (60,000) 1.0 450.00 450.00
Limestone (1 application/3 years) (t) 0.67 127.95 85.30
Base fertilization (kg) 400.0 1.30 520.00 Topdressing fertilization (kg)1 - 0.95 -Non-selective herbicide (L) 3.0 19.15 57.45 Physiological insecticide (L) 0.2 34.00 6.80 Contact insecticide (L) 1.5 18.00 27.00 Fungicide (L) 0.4 174.00 69.60 2-Labor services
Limestone application (man-day)2 0.3 107.83 10.78
Fungicide application (man-day) 0.1 107.83 10.78
1 Quantity corresponding to the dose used in treatments with application of 100 or 200 kg ha-1 of N; 2 The product obtained
by multiplying the quantity by the unit value must be divided by three because it is assumed one limestone application every three years; 3 Considered only for treatments where topdressing fertilization (100 or 200 kg ha-1 of N) was carried
out; 4 The manual weed control was done only in the plots with forage peanut; 5 Transportation cost was determined based
on the area yield; 6 Marketing expenses were calculated based on gross income of the crop.
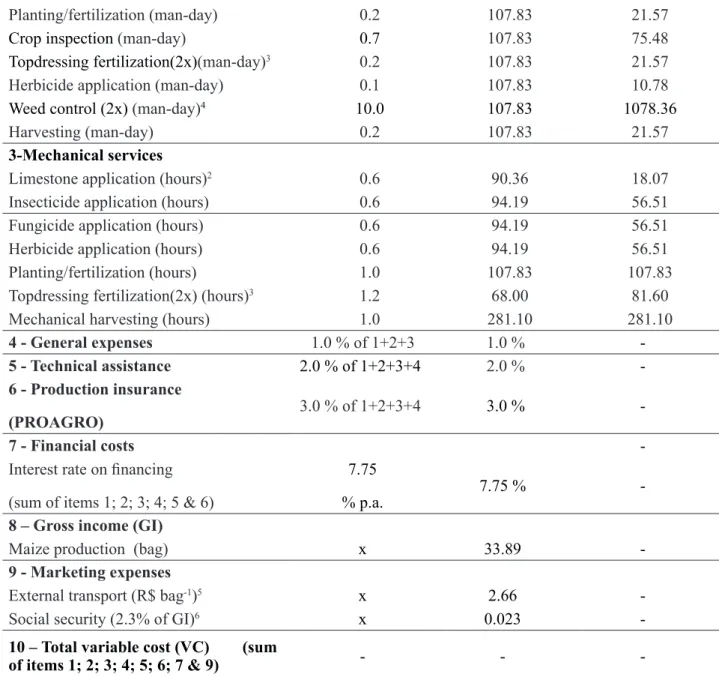
Table 2 continuation. Description of total variable cost (VC) of stage II (maize), considering an area of one
hectare, regardless of the treatments analyzed. Guatambu, SC.
Planting/fertilization (man-day) 0.2 107.83 21.57
Crop inspection (man-day) 0.7 107.83 75.48
Topdressing fertilization(2x)(man-day)3 0.2 107.83 21.57
Herbicide application (man-day) 0.1 107.83 10.78
Weed control (2x) (man-day)4 10.0 107.83 1078.36
Harvesting (man-day) 0.2 107.83 21.57
3-Mechanical services
Limestone application (hours)2 0.6 90.36 18.07
Insecticide application (hours) 0.6 94.19 56.51
Fungicide application (hours) 0.6 94.19 56.51
Herbicide application (hours) 0.6 94.19 56.51
Planting/fertilization (hours) 1.0 107.83 107.83
Topdressing fertilization(2x) (hours)3 1.2 68.00 81.60
Mechanical harvesting (hours) 1.0 281.10 281.10
4 - General expenses 1.0 % of 1+2+3 1.0 %
-5 - Technical assistance 2.0 % of 1+2+3+4 2.0 %
-6 - Production insurance
(PROAGRO) 3.0 % of 1+2+3+4 3.0 %
-7 - Financial costs
-Interest rate on financing (sum of items 1; 2; 3; 4; 5 & 6)
7.75
% p.a. 7.75 %
-8 – Gross income (GI)
Maize production (bag) x 33.89
-9 - Marketing expenses
External transport (R$ bag-1)5 x 2.66
-Social security (2.3% of GI)6 x 0.023
-10 – Total variable cost (VC) (sum
-All data were first evaluated using the Kolmogorov-Smirnov test for normality and Cochran’s test for homogeneity of variances. Subsequently, the data were submitted to analysis of variance and Tukey’ test for comparison of means at 5% probability.
Results and Discussion
The technical and economic indicators of stage I are shown in Table 3. Surface application of mineral fertilizer in the treatment with sole black oat promoted a significant increase of dry matter production. This treatment presented the higher effective operating cost for implementation, so that the urea represented about 41% of the pasture cost, which was a higher value than that verified by Restle et al. (2000) of 34.1% in a black oat and ryegrass pasture. Even so, due to the high yield, the cost of the kg of DM produced
was similar to the other combinations, except for the intercropping system using forage peanut, which was more expensive (R$ 0.38 kg-1 of DM).
Forage yield was also determinant for the milk production per area, that is, the nutritional quality of the pastures was equivalent (milk production t-1 DM), though they differ as to DM production. In practical terms, high forage yield means large number of animals per area and consequent increase of productivity (Elgersma & Søegaard, 2018). As a consequence of the higher milk production per area, the gross income followed the same trend and was higher in the sole crop when compared to the other treatments (Table 3).
The milk production per area was also used as assessment criteria to compare ryegrass vs. tall fescue (Lolium arundinaceum) pastures submitted to different stubble heights (mechanical cutting). The authors observed a clear effect of dry matter yield
Table 3. Effective operating cost (EOC) of pastures, milk production per area, gross income (GI) per area,
EOC of pasture yield per kg of DM, production of milk in relation to EOC of pasture, and gross income of milk in relation to EOC of pasture. Guatambu, SC.
Indices
Treatments
Bo+Fp
Bo+N
Bo+Ve
Bo+Wc
Bo+Rc
Prod. DM (kg ha
-1)
2839
b±607
3929
a±429
2656
b±498
2691
b±426
2730
b±90
MP (kg t
-1DM)
NS1059±38
1102 ±22
1122±50
111 ±28
1109 ±50
MP per area (kg ha
-1)
2996
b±580 4325
a±416 2977
b±570 3004
b±511 3029
b±193
EOC pastures (R$ ha
-1)
1019
1029
704
632
783
GI per area (R$ ha
-1)
3026
b±586 4368
a±420 3007
b±576 3034
b±516 3059
b±195
EOC (R$ kg
-1DM)
0.38
b±0.09 0.27
a±0.03 0.28
ab±0.06 0.24
a±0.03 0.29
ab±0.01
MP/EOC (kg R$
-1Inv.) 2.94
b±0.57 4.20
ab±0.40 4.23
ab±0.81 4.75
a±0.81 3.87
ab±0.25
GI/EOC (R$ R$
-1Inv.) 2.97
b±0.58 4.24
ab±0.41 4.27
ab±0.82 4.80
a±0.82 3.91
ab±0.25
Means followed by different letters in the row differ from one another according to Tukey’s test at 5% probability. NS – difference not significant. Abbreviations: Bo+Fp = black oat + forage peanut; Bo+N = black oat + 200 kg N ha-1; Bo+Ve
= black oat + vetch; Bo+Wc = black oat + white clover; Bo+Rc = black oat + red clover; MP = milk production; Inv= invested.
on milk yield per area and considered that the option for more productive forage species is an alternative to mitigate production costs (Hamilton et al., 2013).
In terms of investment security, the return per real invested is an important index to be evaluated, in this case the Bo+Fp mixture presented lower return in terms of kg of milk and GI per real invested when compared to the Bo+Wc mixture (Table 3). This scenario is a consequence of the high implementation cost of the perennial forage, which, in this case, was underused because it was not under its ideal climate condition (Fontaneli et al., 2012). The Bo+Ve, Bo+Rc and Bo+N combinations were similar to all treatments. Nevertheless, in the Bo+N treatment, as the invested value was higher and the return percentage is the same, in monetary terms, a higher gross margin is expected (Table 3).
However, caution must be exercised in the evaluation of this result, because it can lead to the false impression that the earnings with the use of N will be unlimited, which is not true. In addition, N
supplementation in increased doses may cause serious damages to human health and ecosystem services, that is, the objective must be to maximize the efficiency of that resource (Oita et al., 2016). Therefore, additional studies are necessary to compare the two scenarios (Bo+Ve and Bo+N), not only concerning technical and economic efficiency, but also as to the emission of greenhouse gases, with indices such as Kg of CO2 equivalent to Kg-1 of meat or milk solids.
With regard to stage II, there was no interaction between the cover crops and nitrogen fertilization for any of the indicators calculated. The agronomic performance of maize and the results of economic indices are available in Tables 4 and 5. Attention is drawn to grain yield, which was the only variable that has not presented significant difference as a function of cover crops, only as a function of N dose. The increase of N doses is directly related to productivity, so that Al-Naggar et al. (2015) verified
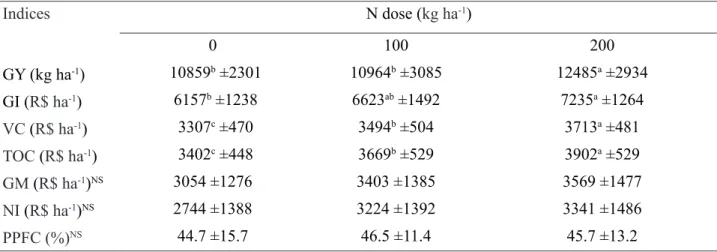
Table 4. Grain yield (GY), gross income (GI), total variable cost (VC) and total operating cost (TOC), gross
margin (GM), net income (NI) and portion of GI for payment of fixed costs (PPFC) of maize crop as a function of different topdressing mineral N doses. Guatambu-SC.
Indices N dose (kg ha-1) 0 100 200 GY (kg ha-1) 10859b ±2301 10964b ±3085 12485a ±2934 GI (R$ ha-1) 6157b ±1238 6623ab ±1492 7235a ±1264 VC (R$ ha-1) 3307c ±470 3494b ±504 3713a ±481 TOC (R$ ha-1) 3402c ±448 3669b ±529 3902a ±529 GM (R$ ha-1)NS 3054 ±1276 3403 ±1385 3569 ±1477 NI (R$ ha-1)NS 2744 ±1388 3224 ±1392 3341 ±1486 PPFC (%)NS 44.7 ±15.7 46.5 ±11.4 45.7 ±13.2
yield increment up to doses of 570 kg of N ha-1. Despite that, when trying to achieve the maximum yield potential of hybrids, the farmers may, without realizing, obtain lower crop profitability, due to the fact that the economic result is a combination of factors: climate, environment and crop management (Puntel et al., 2016). Those interferences justify the effect of N on the indices shown in Table 4. As expected, production costs (VC and TOC) significantly increased with higher N doses, as well as gross income, when compared to the control treatment with the dose of 200 kg of N ha-1. However, in terms of profitability, N doses had no influence on the GM, NI and PPFC indices (Table 4).
On the other hand, the profitability indices were influenced by cover crops (Table 5), that is, the high yields obtained with the use of mineral N have not necessarily guaranteed higher profitability. However, Sangoi et al. (2006) state, based on an experiment carried out in the municipality of Lages-SC with increasing levels of management and N doses (0, 40, 60 and 200 kg of N ha-1 in topdressing), that it is possible to associate maximum technical and economic efficiency.
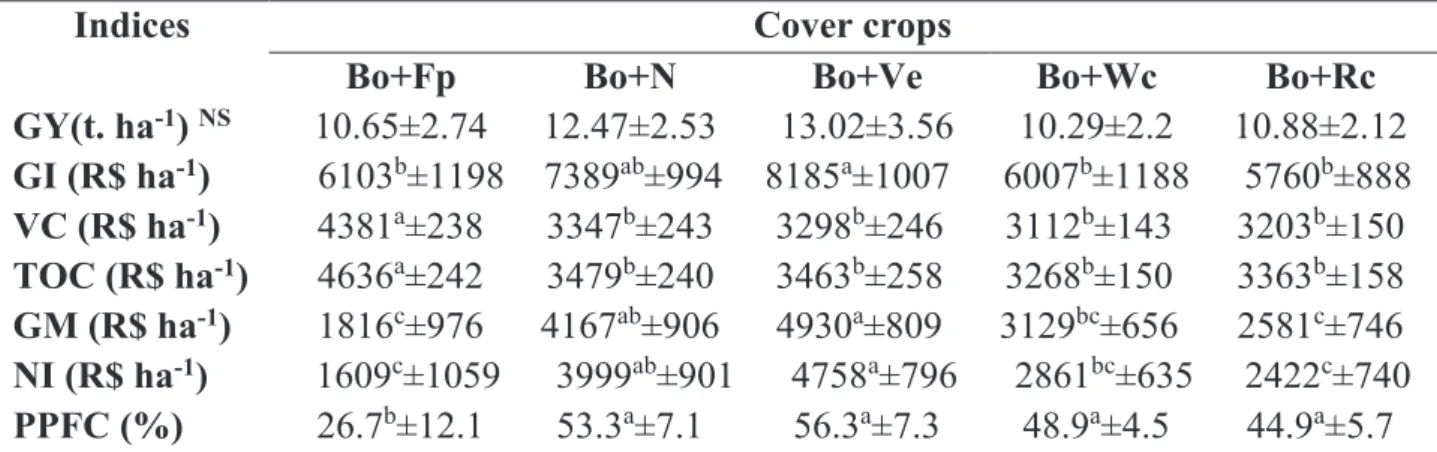
Still in regard to cover crop costs, they were similar among the treatments, except for the Bo+Fp mixture, that presented higher VC and TOC (Table 5). This fact is due to the need of manual weed control in that system, which increased the values by approximately 20%. However, it is worth pointing out that the benefits of the forage peanut in the area, after maize harvesting, were not taken into consideration. For the state of Santa Catarina, the VC estimated by Epagri (2017a) for maize production with high technology, in the agricultural year of 2016/2017, was R$ 3,840.53 ha-1, which is a higher value if compared to that verified in this study (Table 4), except for the
Bo+Fp mixture. On the other hand, the TOC verified for the treatments in this study were higher in relation to those appointed by Conab (2017) in the agricultural year of 2017/2018, for the states of Rio Grande do Sul and Mato Grosso do Sul, which represented R$ 2,860.17 and 2,964.28, respectively.
In Paraná, the TOC for maize production with high technology in the agricultural year of 2017/2018 was, on average, R$ 3,462.34 (Seab-Deral, 2018). This value is close to that verified in this work, except for the Bo+Fp mixture. This similarity concerning the results is associated with the similarity that exists between the states of Paraná and Santa Catarina in regard to climatic and productivity aspects (Conab, 2017).
In terms of profitability, the GM and NI results were higher in the Bo+Ve treatment in relation to the Bo+Wc, Bo+Rc and Bo+Fp combinations, though being similar to the indices of the Bo+N treatment (Table 5). Those indicators are important because they represent the income amount that actually remains with the producer after payment of the total variable costs (GM) and total operating costs (NI) and their ratio related to gross income (PPFC) (Simioni et al., 2017; Martin et al., 1998).
Even though the cover crops have not influenced maize yield, as verified in the present study, small yield increments may result in higher profitability due to the selling price (R$ 33.89 bag-1 of 60 kg). In this sense, due to the (historically) favorable price calculated in this work, the positive conditions generated by the Bo+Ve and Bo+N mixture were sufficient to provide increase in profitability (Table 5).
In the case of sole black oat, this effect can be explained as a result of both higher mass production and aggressiveness of the root system, which together
promote high cycling of the nitrogen applied in the pasture, thus favoring maize yield (Silva et al., 2014). In regard to the mixture, vetch can release up to 60% of N from its residues during the first month after desiccation (Aita & Giacomini, 2003), which coincides with a period when maize presents high nutritional demand, during which important yield components are defined. Despite that, a positive effect of the vetch crop on GM of maize was observed in Eldorado do Sul-RS, when very low N doses were applied. On the other hand, with doses between 100 and 180 kg of N ha-1, vetch crop, black oat crop or fallow period were similar (Silva et al., 2008).
Still in regard to profitability, in an experiment carried out in Selvíria-MS, evaluations were performed for the effects of four surface-applied N doses (0, 60, 90 and 120 kg N ha-1) and three different cover crops (millet, crotalaria and a mixture of both) on maize profitability. It is worth pointing out that the production cost of green manure crop in pre-cultivation was added to the crop costs, and the maize
selling price and urea buying price were R$ 0.42 kg-1 and 1.69 kg-1, respectively. Unlike the present study, the N dose influenced the profitability of the system, so that, under grass residues, the profitability increased with the increment of N doses. However, the most profitable system was the one cultivated under the mixture residues, with the application of a dose between 50 and 55 kg N ha-1. This result was associated with the high urea cost and the higher N availability provided by the mixture in relation to the sole grass species (Kappes et al., 2015).
The differences found in the results, which were described along the text, concerning production costs and profitability, illustrate the variability of grain and input prices and also of maize yield depending on the geographic region. Such fact justifies the need to have regional economic studies carried out, which take into consideration the local production factors, in order to determine the best management for the referred condition.
Table 5. Grain yield (GY), gross income (GI), total variable cost (VC) and total operating cost (TOC), gross
margin (GM), net income (NI) and portion of GI for payment of fixed costs (PPFC) of maize crop as a function of different cover crops. Guatambu-SC.
Indices
Cover crops
Bo+Fp
Bo+N
Bo+Ve
Bo+Wc
Bo+Rc
GY(t. ha
-1)
NS10.65±2.74 12.47±2.53
13.02±3.56
10.29±2.2 10.88±2.12
GI (R$ ha
-1)
6103
b±1198 7389
ab±994 8185
a±1007 6007
b±1188 5760
b±888
VC (R$ ha
-1)
4381
a±238
3347
b±243
3298
b±246
3112
b±143
3203
b±150
TOC (R$ ha
-1)
4636
a±242
3479
b±240
3463
b±258
3268
b±150
3363
b±158
GM (R$ ha
-1)
1816
c±976 4167
ab±906 4930
a±809 3129
bc±656 2581
c±746
NI (R$ ha
-1)
1609
c±1059
3999
ab±901 4758
a±796 2861
bc±635 2422
c±740
PPFC (%)
26.7
b±12.1
53.3
a±7.1
56.3
a±7.3
48.9
a±4.5
44.9
a±5.7
Means followed by different letters differ from one another according to Tukey’s test at 5% probability. Abbreviations: Bo+Fp = black oat + forage peanut; Bo+N = black oat + 200 kg N ha-1; Bo+Ve = black oat + vetch; Bo+Wc = black oat +
Conclusions
Nitrogen application is critical in the production system that integrates winter pasture and maize. Its application can be concentrated in the cold season in order to provide high pasture yield without compromising the profitability of the maize cultivated in succession. The use of vetch can be an alternative in integrated systems targeting at smaller addition of exogenous nitrogen.
Acknowledgments
To the Soils and Sustainability research group; to the University of the State of Santa Catarina; to the Coordination for the Improvement of Higher Education Personnel (Capes), for the Master’s Degree scholarship granted to the first author. D.B. thanks FAPESC (2019TR617) for the funding and CNPq (305939/2018-1) for the Scientific Productivity Scholarship.
References
AGROLINK. Cotações: milho seco Sc 60 kg.
Disponível em: <https://www.agrolink.com.br/ cotacoes/historico/sc/milho-seco-sc-60kg>. Acesso em: 19 out. 2018.
AL-NAGGAR, A. M. M.; SHABANA, R. A.; ATTA, M.M.M.; AÇ-KHALIL, T.H. Maize response to elevated plant density combined with lowered N-fertilizer rate is genotype-dependent. The Crop
Journal, v. 3, p. 96-109, 2015. DOI: 10.1016/j.
cj.2015.01.002.
AITA, C.; GIACOMINI, S. J. Decomposição e
liberação de nitrogênio de resíduos culturais de plantas de cobertura de solo solteiras e consorciadas. Revista Brasileira de Ciência do Solo, v. 27, p. 601-612,
2003. DOI: 10.1590/S0100-06832003000400004.
BÉLANGER, G.; TREMBLAY, G.F.; PAPADOPOULOS, Y.A.; DUYNISVELD, J.; LAJEUNESSE, J.; LAFRENIÈRE, C.; FILLMORE, S.A.E. Yield and nutritive value of binary legume– grass mixtures under grazing or frequent cutting.
Canadian Journal of Plant Science, v. 98, n. 2, p.
395-407, 2018. DOI: 10.1139/cjps-2017-0183.
CONSELHO PARITÁRIO PRODUTORES/ INDÚSTRIAS DE LEITE DO ESTADO DO RIO GRANDE DO SUL. Preços de referência-SC.
Disponível em: <http://conseleite.com.br/preco-referencia/index/estado/sc/ano/2017/>. Acesso em: 19 out. 2018.
CHERUBIN, M.R.; FABRIS, C.; WEIRICH, S.W.; ROCHA, E.M.T DA.; BASSO, C.J.; SANTI, A.L.; LAMEGO, F.P. Desempenho agronômico do milho em sucessão a espécies de cobertura do solo sob sistema plantio direto no Sul do Brasil. Global Science and Technology, v. 07, p. 76-85, 2014.
DOI:10.14688/1984-3801/gst.v7n1p76-85.
CONAB. Companhia Nacional de Abastecimento.
Planilhas de custos de produção - culturas de 1ª safra: culturas de verão - março de 2017. Disponível
em: <https://www.conab.gov.br/info-agro/custos-de-producao/planilhas-de-custo-de-producao/itemlist/ category/406-planilhas-de-custos-de-producao-culturas-de-1-safra>. Acesso em: 12 dez. 2018.
swath-grazed carrying capacity from plot-scale data.
Canadian Journal of Plant Science, v. 95, n. 4, p.
647-651, 2015.
DOI: 10.4141/cjps-2014-353.
EPAGRI. Empresa de Pesquisa Agropecuária e Extensão Rural de Santa Catarina. Custo de produção:
milho e alta tecnologia: safra 2016/17-agosto/2017. Disponível em: <https://cepa.epagri.sc.gov.br/index. php/produtos/custos-de-producao/>. Acesso em: 19 out. 2018a.
EPAGRI. Empresa de Pesquisa Agropecuária e Extensão Rural de Santa Catarina. Custo de produção: trigo média tecnologia: safra
2016/17-maio/2017. Disponível em: <https://cepa.epagri. sc.gov.br/index.php/produtos/custos-de-producao/>. Acesso em: 15 out. 2018a.
ELGERSMA, A.; SØEGAARD, K. Changes in nutritive value and herbage yield during extended growth intervals in grass–legume mixtures: effects of species, maturity at harvest, and relationships between productivity and components of feed quality.
Grass Forage Science, v. 73, p. 78-93, 2018. DOI:
10.1111/gfs.12287.
FONTANELI, R.S.; SANTOS, H.P DOS.; FONTANELI, R. S. Forrageiras para Integração Lavoura-Pecuária-Floresta na Região Sul-brasileira. 2. ed. Brasília: EMBRAPA, 2012. 544p.
FINNEY, D.M.; WHITE, C.M.; KAYE, J.P. Biomass Production and Carbon/Nitrogen Ratio Influence Ecosystem Services from Cover Crop Mixtures.
Agronomy Journal, v. 108, n. 1, p. 39-52, 2016.
DOI: 10.2134/agronj15.0182.
HAMILTON, S.A.; KALLENBACH, R.L.; BISHOP-HURLEY, G.J.; ROBERTS, C.A. Stubble Height Management Changes the Productivity of Perennial Ryegrass and Tall Fescue Pastures. Agronomy
Journal, v. 105, n. 3, p. 557-562, 2013. DOI: 10.2134/
agronj2012.0293.
KAPPES, C.; GITTI, D.C.; ARF, O.; ANDRADE, J.A. DA C.; TARSITANO, M.A.A. Análise econômica do milho em sucessão a diferentes adubos verdes, manejos do solo e doses de nitrogênio. Biosciense Journal, v. 31, n. 1, p. 55-64, 2015.
DOI: 10.14393/BJ-v31n1a2015-18092.
MACDONALD, K.A.; PENNO, J.W.; LANCASTER, J.A.S.; BRYANT, A.M.; KIDD, J.M.; ROCHE, J.R.; Production and economic responses to intensification of pasture-based dairy production systems. Journal of Dairy Science, v. 100, n. 8, p. 1-18, 2017.
DOI: 10.3168/jds.2016-12497.
MANUAL de calagem e adubação para os estados do Rio Grande do Sul e de Santa Catarina. 11. ed. Porto Alegre: Sociedade Brasileira de Ciência do Solo, Núcleo Regional Sul, Comissão de Química e Fertilidade do Solo - RS/SC, 2016.
MARTIN, N.B.; SERRA, R.; OLIVEIRA, M.D.M.; ÂNGELO, J.A.; OKAWA, H. Sistema integrado de custos agropecuários “Custragri”. Informações Econômicas, v. 28, p. 7-28, 1998.
OLIVEIRA, C.A.O DE.; BREMM, C.; ANGHINONI, I.; MORAES, A DE.; KUNRATH, T. R.; CARVALHO, P.C. DE F. Comparison of an integrated crop– livestock system with soybean only: Economic and production responses in southern Brazil. Renewable
Agriculture and Food Systems, v. 29, n. 3, p. 230–
238, 2013. DOI: 10.1017/S1742170513000410. OITA, A.; MALIK, A.; KANEMOTO, K.; GESCHKE, A.; NISHIJIMA, S.; LENZEN, M. Substantial nitrogen pollution embedded in international trade.
Nature Geoscience, v. 9 p. 111-116, 2016. DOI:
10.1038/NGEO2635.
PARANÁ. Governo do Estado. Secretaria de Estado da Agricultura e do Abastecimento. Estimativa do custo de produção: milho 1ª safra. Disponível
em: <http://www.agricultura.pr.gov.br/modules/ conteudo/conteudo.php?conteudo=228>. Acesso em: 9 dez. 2018.
PUNTEL, L.A.; SAWYER, J.E.; BARKER, D.W.; DIETZEL, R.; POFFENBARGER, H.; CASTELLANO, M.J.; MOORE, K.J. THORBURN, P.; ARCHONTOULIS, S.V. Modeling Long-Term Corn Yield Response to Nitrogen Rate and Crop Rotation. Frontiers in Plant Science, v. 7, n. 11, p.
1-18, 2016. DOI: 10.3389/fpls.2016.01630.
RESTLE, J.; ROSO, C.; SOARES, A.B.; LUPATINI, G.C.; ALVES FILHO, D.C.; BRONDANI, I.L. Produtividade animal e retorno econômico em pastagem de aveia preta mais azevém adubada com fontes de nitrogênio em cobertura. Revista Brasileira
de Zootecnia, v. 29, n. 2, p. 357-364, 2000. DOI:
10.1590/S1516-35982000000200006.
SANGOI, L.; ERNANI, P.R.; SILVA, P.R.F DA.; HORN, D.; SCHMITT, A.; SCHWEITZER, C.; MOTTER, F. Rendimento de grãos e margem bruta de cultivares de milho com variabilidade genética contrastante em diferentes sistemas de manejo.
Ciência Rural, v. 36, n. 6, p. 747-755, 2006. DOI:
10.1590/S0103-84782006000300005.
SOARES, J.C.R.; BARCELLOS, J.O.J.; QUEIROZ FILHO, L.A.V.; OAIGEN, R.P.; CANOZZI, M.E.A.; CAMARGO, C.M.; DRUMOND, L.C.D.; BRACCINI NETO, J. Avaliação econômica da terminação de bovinos de corte em pastagem irrigada.
Arquivo Brasileiro de Medicina Veterinária e
Zootecnia, v. 67, n. 4, p. 1096-1104, 2015. DOI:
10.1590/1678-4162-7340.
SILVA, A.A DA.; SILVA, P.R.F DA.; MINETTO, T.; STRIEDER, M.L.; JANDREY, D.B.; ENDRIGO, P.C. Desempenho agronômico e econômico do milho irrigado em sucessão a espécies invernais de cobertura de solo e/ou para produção de grãos. Ciência Rural,
v. 38, n. 3, p. 620-627, 2008. DOI: 10.1590/S0103-84782008000300005.
SILVA, H.A DA.; KOEHLER, H.S.; MORAES, A DE.; GUIMARÃES, V.D.; HACK, E.; CARVALHO, P.C DE.F.; Análise da viabilidade econômica da produção de leite a pasto e com suplementos na região dos Campos Gerais – Paraná. Ciência Rural,
v. 38, n. 2, p. 445-450, 2008. DOI: 10.1590/S0103-84782008000200024.
SILVA, M.A.G.; MUNIZ, A.S.; BULL, L.T.; MANNIGEL, A.R.; MARCHETTI, M.E.; NOLLA, A. Manejo da adubação com sulfato de amônio no desempenho produtivo do milho cultivado após aveia e trigo. Semina: Ciências Agrárias, v. 35, n. 2, p.
577-588, 2014. DOI: 10.5433/1679-0359.2014v35n 2p577.
SPAGNOLLO, E.; VEIGA, M DA.; BARETTA, D. Indicadores de eficiência técnica e econômica do milho cultivado em sistema plantio direto no Estado de Santa Catarina, Brasil. Revista Ceres,
v. 64, n. 3, p. 232-241, 2017. DOI: 10.1590/0034-737x201764030003.
UNDERSANDER, D. L.; COMBS, D.; SHAVER, J.
R. Milk2016 (ALFALFA-GRASS): index combining
yield and quality. Madison: University of Wisconsin, 2013. Disponível em: <https://fyi.extension.wisc. edu/forage/milk2016-combining-yield-and-quality-into-a-single-term/>. Acesso em: 12 set. 2018.