Mergers and Acquisitions:
The Case of Cimpor and InterCement
Miguel Luís Andrade
Advisor: Peter Tsvetkov
Dissertation submitted in partial fulfillment of requirements for the degree of MSc in Business Administration, at Católica-Lisbon School of Business and
Economics
2 Miguel Andrade M&A: The Case of Cimpor and InterCement
ABSTRACT
In June of 2012 Camargo Corrêa, the Brazilian Family Group that controlled the Brazilian cement producer InterCement, acquired 61% of the Portuguese cement production leader, Cimpor, with an offer price of 5.5 Euros, allowing Camargo Corrêa to take full control of Cimpor by owning 94% of the company.
Cement is an industry characterized by huge production scales and high initial investments, with an enduring trend of consolidation among cement’s biggest international producers, and this deal comes at the tail-end of the 2008 financial crisis, which marked the European macroeconomic environment, particularly the sovereign treasury of the PIGS (Portugal, Ireland, Greece and Spain).
According to the model used in this work, Cimpor’s share price at the time of the acquisition announcement is found to be undervalued, with 14.8% upside potential. Moreover, adding the forecasted synergies to the model implies a fair offer price of 6.14 Euros, which results in a 23% premium over Cimpor’s closing price.
Miguel Andrade M&A: The Case of Cimpor and InterCement 3
ACKNOWLEDGMENTS
The author would like to express his sincere gratitude to: Professor Peter Tsvetkov, the Dissertation Advisor, for the constant availability and helpful feedback; to his friends who supported him during all of his academic path; and to his family, for all the unconditional contribution and support.
4 Miguel Andrade M&A: The Case of Cimpor and InterCement
Table of Contents
List of Abreviations ... 8
1. Introduction ... 9
2. Literature Review ... 10
2.1. Discounted Cash Flow Approach ... 10
2.1.1. Weighted Average Cost of Capital ... 11
2.1.2. Capital Asset Pricing Model ... 12
2.1.2.1. Risk-Free Rate ... 12
2.1.2.2. Risk Premium ... 13
2.1.2.3. Beta... 14
2.1.3. Cost of Debt ... 15
2.1.4. Terminal Value ... 16
2.1.5. Adjusted Present Value ... 16
2.2. Multiples ... 17
2.3. Synergy ... 19
2.4. Other Issues ... 21
2.4.1. Mergers and Acquisitions’ Implied Strategies ... 21
2.4.2. Cross-Border Valuation ... 21
2.4.3. Geographic Diversification and Multi-Nationality ... 22
2.4.4. Fire-Sale ... 23
2.4.5. Market for Corporate Control ... 23
2.4.6. Cash vs. Stock ... 24
3. Industry Review ... 24
3.1. Intro to Cement ... 24
3.2. Production Process ... 25
Miguel Andrade M&A: The Case of Cimpor and InterCement 5
3.4. Prices ... 26
3.5. Intro to Brazil Market ... 27
3.6. Intro to European Union Market ... 28
3.6.1. Europe ... 28
3.6.2. Portugal ... 29
3.6.3. Spain ... 29
3.7. Intro to Emerging Markets ... 30
3.8. Volumes Sold, Revenues, Biggest Players and Trends ... 31
3.8.1. Production by Region and Biggest Players ... 31
3.8.2. Crisis and Post-Crisis ... 32
3.8.3. Globalization and Consolidation ... 33
3.8.4. Speculative Bubble in the Brazilian Residential Real-Estate Market ... 34
4. Companies’ Description ... 34 4.1. Cimpor ... 35 4.1.1. Overview ... 35 4.1.2. Financials ... 38 4.1.3. Shareholder Structure ... 41 4.2. InterCement ... 41 4.2.1. Overview ... 41 4.2.2. Financials ... 43 4.2.3. Shareholder Structure ... 44 5. Companies’ Valuations ... 44 5.1. Cimpor ... 45 5.1.1. Installed Capacity ... 45 5.1.2. Revenues ... 46 5.1.3. Prices ... 48 5.1.4. Costs ... 49
6 Miguel Andrade M&A: The Case of Cimpor and InterCement
5.1.5. Capex, D&A and Working Capital ... 51
5.1.6. WACC ... 52 5.1.7. Terminal Value ... 53 5.2. InterCement ... 54 5.2.1. Revenues ... 54 5.2.2. Costs ... 55 5.2.3. WACC ... 55
5.2.4. Capex, D&A and Working Capital ... 55
5.3. Multiples Valuation ... 55
5.4. Analysis of results obtained ... 57
5.4.1. Cimpor ... 57
5.4.2. InterCement ... 60
6. Valuation of the Merged Entity ... 60
6.1. Valuation of the merged entity without synergies ... 61
6.2. Analysis of Synergies ... 61 6.3. Synergies Sharing ... 63 7. The Acquisition ... 64 7.1. Mode of acquisition ... 64 7.2. Underlying Strategy ... 65 7.2.1. Overcapacity M&A ... 65 7.2.2. Geographic diversification ... 66 7.2.3. Undervaluation ... 66 7.2.4. Financial Structure ... 67
7.3. The Offer Price ... 68
7.4. Method of Payment ... 69
7.5. Brazilian Competition Authority ... 70
Miguel Andrade M&A: The Case of Cimpor and InterCement 7 9. Bibliography ... 72 10. Appendixes ... 76
8 Miguel Andrade M&A: The Case of Cimpor and InterCement
List of Abreviations
APV Adjusted Present Value
BCP Banco Comercial Português
CAPM Capital Asset Pricing Model
CAGR Compound Annual Growth Rate
CGD Caixa Geral de Depósitos
CAPEX Capital Expenditures
CAPM Capital Asset Price Model
Tc Corporate Tax Rate
Rd Cost of Debt
Re Cost of Levered Equity
D&A Depreciations and Amortizations
DCF Discounted Cash Flow
EBIT Earnings Before Interests and Taxes
EBITDA Earnings Before Interests Taxes Depreciations and Amortizations
EV Enterprise Value
FCFF Free Cash Flows to the Firm
GDP Gross Domestic Product
HTLs High Leverage Transactions
Rm-Rf Market Risk Premium
M&A Merger and Acquisition
NOPAT Net Operating Profit After Taxes
NWC Net Working Capital
P/E Price to Earnings ratio
PEG Price to Earnings to Growth ratio P/Sales Price to Sales ratio
R&D Research and Development ROIC Return on Invested Capital
Rf Risk-free Rate
TGR Terminal Growth Rate
TV Terminal Value
US United States
Miguel Andrade M&A: The Case of Cimpor and InterCement 9
1. Introduction
The focus of this dissertation is on Mergers and Acquisitions (M&A). Its goal is to analyze the deal between Camargo Corrêa and Cimpor in June of 2012 and to present the possible financial and strategic reasons that may have justified it.
First of all, this work will begin with a deep analysis of the current academic literature concerning valuation issues and frameworks. Additionally, still in the same section, I will address other issues concerning some M&A trends and this deal in particular. Therefore, the literature review will provide the theoretical foundation to the work that will then follow.
Secondly, the most important features of the cement industry as a whole, and of Cimpor and InterCement in particular will be addressed, with particular emphasis on the consolidation trend that is currently driving the industry and on the companies’ historical financials.
With these two sections serving as a base, I will present a model to value both companies, as well as the merged one (with and without synergies), with the proper fundamentals. This work will devote special attention to revenues forecasts as well as to the computation of the discount rates that will be used. Having presented the model, the work will bring numbers to the table when providing enterprise values, market capitalizations and share prices both for the standalone companies and for the merged one. The focus, however, will be on Cimpor’s valuation with and without synergies, since it is the most important issue to be analyzed and discussed in this deal.
I will end with a comparison between the values implied by the model used and those that featured this deal, as well as with other analysts’ valuations; I will also analyze the underlying strategies and financial incentives behind this deal, and will finish with a general conclusion trying to summarize all the relevant issues regarding this acquisition.
10 Miguel Andrade M&A: The Case of Cimpor and InterCement
2. Literature Review
As Damodaran (2006) puts it "Valuation lies at the heart of much of what we do in finance", albeit it is not rocket science. In fact, Carabias and Fernández (2006) argue that valuations are more built on opinions than on scientific facts because they are conditioned by the set of expectations of whoever is conducting them. Moreover, Young’s et al. (1999), “all roads lead to Rome” means that the final result obtained by different valuation approaches may actually be the same, while in turn, the choice of the model is the result of one's decision about which aspects to make clear and which ones to obscure.
Due to the vastness of existing research on valuation, it is wiser to summarize and separate the main methodologies in four (with a variety of derivations) (Damodaran, 2006): Discounted Cash Flows (DCF); asset-based valuations; contingent claim valuations and relative valuations. In this work, I will only address DCF and relative valuations, both because they are the most commonly used and also due to the existing extensive literature about them.
2.1. Discounted Cash Flow Approach
Discounted Cash Flow (DCF) methods comprise two possible approaches: the equity one ─ where the dividend stream is the basis for the valuation ─ and the firm one ─ which values the business as a whole (enterprise value). In this work I will focus only on the latter, since I believe it is more pertinent to first value the whole company and only then separate between the firm's market capitalization and its debt value.
Damodaran (2006) states that in order to estimate the value of an asset, one should calculate its cash flows’ present values and to obtain the value of the entire business forecasting the Free Cash Flows to the Firm (FCFF) is the more appropriate approach:
Operating Income (EBIT)
- Normalized tax on EBIT
= NOPAT (EBIAT)
Miguel Andrade M&A: The Case of Cimpor and InterCement 11
- Investments in Working Capita
- Capital Expenditures
=Free Cash Flow to the Firm
The DCF model is a function of the forecast it relies on. Thus the appropriateness of using this method depends on how accurately the cash flow projections and risk measures are calculated, and of how real the assumptions are when computing the cost of capital. This is why errors in estimating Return on Invested Capital (ROIC), growth rates and Weighted Average Cost of Capital (WACC) can sometimes lead to severe errors in valuation (Goedhart, Moller and Wessels, 2005).
Having said that, there have been several debates on whether to use DCF or relative valuations when valuing a company. Within this discussion range, Kaplan and Ruback (1996) compared the DCF model with the Multiples’ method using High Leverage Transactions (HTLs)1 and concluded that DCF’s estimates “were ‘clustered’ more tightly around the actual values”.
2.1.1. Weighted Average Cost of Capital
The DCF model implies that future cash flows be discounted according to their riskiness, which consequently is the same as saying that they should be discounted using a rate that describes the “opportunity cost of investing capital in assets of similar risk and duration” (Kester and Morley, 1997).
In order to calculate this opportunity cost of the business, one needs to first estimate the required rates of return for debt and equity, and then weight them with each’s respective proportional claims before adding the two components together. As a result, WACC is the most common tool to discount the future cash flows of a firm according to its capital structure, and it will be the tool used in this work. The formula can be displayed as follows:
1 The use of HLTs in the study is based on the fact that in this type of transactions the participants are
12 Miguel Andrade M&A: The Case of Cimpor and InterCement 𝑊𝐴𝐶𝐶 = 𝑅𝐸× 𝐸
𝐷 + 𝐸+ 𝑅𝐷× 𝐷
𝐷 + 𝐸 × (1 − 𝑇𝑐)
2.1.2. Capital Asset Pricing Model
Although there are several methods to calculate the cost of equity of a project, the Capital Asset Pricing Model (CAPM) tends to be the one that generally gathers more consensus. CAPM is a model that specifies expected returns for use in capital budgeting, valuation, and regulation, and considers risk premium on an individual security as a function of it systematic risk, measured by the covariance with the market.
However, some authors disagree on the latter. In fact, in their 1992 well-known study, Fama and French (1992) argued that stock returns were correlated with firm size and book-to-market rations instead of with measures of systematic risk, as the CAPM implies.
On the other hand, Kaplan’s and Ruback’s study (1996) valued the HLTs’ cash flows using a discount rate based on CAPM and their work can be viewed as a test to this model. Contrary to Fama and French, they concluded that the implied risk premium was positively related to firm and industry betas. It is important to repeat that this study was based on HLTs mostly because their participants were required to disclose their own cash flow projections, which gives some robustness to the model in question.
To conclude, and taking into account what was already said in this section, I will use CAPM to calculate the cost of equity. Its computation requires the use of a risk-free rate, a “beta” and a risk premium.
2.1.2.1. Risk-Free Rate
A risk-free investment implies, first of all, its actual returns to be equal to its expected returns, and secondly, that there is no reinvestment risk associated with it (Damodaran, 2008). Although the theoretical importance of the second condition cannot be ignored, its practical application seldom makes any difference in the final value. Notwithstanding, it is advisable that the duration of the risk free asset matches the duration of the cash flows being analyzed. As a result, for long-run projects, 10-Year government bond rates seem to be the most appropriate to discount these project’s cash flows.
Miguel Andrade M&A: The Case of Cimpor and InterCement 13 However, special attention is necessary if long-term, traded government bonds are not available for a specific currency. This being the case, a different currency should be use or, if possible, risk-free rates from forward markets should be estimated.
Regarding the first suggestion, if one choses to use the risk-free rate of the mature market long-term government bond, the cash flows have to be converted to the respective currency. This is done by estimating future exchange rates.
When it comes to convert the local discount rate to the foreign one, the formula is the following:
𝑅𝑓𝑙𝑜𝑐𝑎𝑙 𝑐𝑢𝑟𝑟𝑒𝑛𝑐𝑦= (1 + 𝑅𝑓𝑓𝑜𝑟𝑒𝑖𝑔𝑛 𝑐𝑜𝑟𝑟𝑒𝑛𝑐𝑦) ×
1 + 𝐸𝑥𝑝𝑒𝑐𝑡𝑒𝑑 𝐼𝑛𝑓𝑙𝑎𝑡𝑖𝑜𝑛𝑙𝑜𝑐𝑎𝑙 𝑐𝑢𝑟𝑟𝑒𝑛𝑐𝑦 1 + 𝐸𝑥𝑝𝑒𝑐𝑡𝑒𝑑 𝐼𝑛𝑓𝑙𝑎𝑡𝑖𝑜𝑛𝑓𝑜𝑟𝑒𝑖𝑔𝑛 𝑐𝑢𝑟𝑟𝑒𝑛𝑐𝑦
− 1
In addition, when there is a default risk associated with a certain government bond, the rate that should be used must be net of the default spread2. As in this work it will be
possible to estimate future exchange rates, cash flows from foreign projects will be converted to the local currency on a yearly basis.
2.1.2.2. Risk Premium
Damodaran states that “the expected return on any investment can be written as the sum of the risk-free rate and an extra return to compensate for the risk”. The most common method to estimate the latter, known as equity risk premium, is the use of historical premium earned by stocks over default-free securities throughout long periods of time in mature markets (Damodaran, 2008). However, some issues still rise in contemporary literature regarding the use of this method. The first one concerns how far backward analysts should go in choosing a time frame to retrieve the historical risk premium from - the less the number of years taken into account, the more update estimations will be, albeit at the same time registering larger standard errors. Furthermore, to compute the premium, the risk free rate chosen must be consistent with the one used
14 Miguel Andrade M&A: The Case of Cimpor and InterCement to compute expected returns. The last issue regarding the use of historical premiums is whether to use arithmetic or geometric averages.
Having in mind testing whether the use of the arithmetic average historical risk premium was appropriate, Kaplan and Ruback (1996) “inverted” the DCF analysis to come up with an implied discount rate (i.e., the discount rate that would make the DCF forecasts yield the exact transaction value). The value they came up with was 7.8% in the median case, which is significantly close to the historical arithmetic average risk premium (7.4%). Taking this study into consideration, I will use the arithmetic average when computing the historical risk premium.
There is, however, a problem when estimating the risk premium for emerging markets due its short and volatile data. Damodaran gathered historical risk premiums for major non-United States (US) markets and concluded that some countries had risk premiums below 1%, and in some cases even negative ones. Consequently, and has historical premiums for emerging markets are not valid when applying risk models, the approach to be used has to include the country risk premium:
Assuming that the degree of exposure to the country risk is equal to the degree of exposure to systematic risk (Damodaran, 2008), this country risk premium would simply be added to the original equity risk premium.
𝐸𝑞𝑢𝑖𝑡𝑦 𝑅𝑖𝑠𝑘 𝑃𝑟𝑒𝑚𝑖𝑢𝑚 = 𝐵𝑎𝑠𝑒 𝑃𝑟𝑒𝑚𝑖𝑢𝑚 𝑓𝑜𝑟 𝑀𝑎𝑡𝑢𝑟𝑒 𝐸𝑞𝑢𝑖𝑡𝑦 𝑀𝑎𝑟𝑘𝑒𝑡 + 𝐶𝑜𝑢𝑛𝑡𝑟𝑦 𝑃𝑟𝑒𝑚𝑖𝑢𝑚
Considering the US equity market as a mature one, one can gather sufficient historical data to make a correct estimate of the risk premium. Then, through estimations of country premiums available on Damodaran website it is possible to compute a foreign project’s total equity risk premium.
2.1.2.3. Beta
CAPM implies the estimation of a “beta” (B) which is a measure of the risk that a certain investment adds to the market portfolio (Damodaran, 2002). An asset’s beta can be estimated through two different methods: the first one consists in regressing the returns
Miguel Andrade M&A: The Case of Cimpor and InterCement 15 on an asset against the returns of an index representing the market portfolio. Different choices of a Market Index, time period, and return interval may result in different beta values for the same asset.
Despite all this issues, the most important one concerns the fact that this beta estimation is based upon historical data, thus not taking into account firm’s changing features over time, particularly when recent leverage changes have occurred.
The second method consists in using the average beta for the industry since market expectations are already included in it. Damodaran (2002) suggests the use of Bottom-Up Betas, which takes into account the updated degrees of operating and financial leverage. Plus, it assumes that if all of the firm’s risk is borne by the stockholders, the beta of debt is zero. Therefore, to estimate the unlevered beta for the business the firm is involved in, Copeland et al. (2000) recommend using the published estimates of the unlevered beta for the industry – which already includes market expectations. Assuming that the relative risk of firms is similar across markets, one is allowed to use bottom-up betas for companies in the same business in the United States (Damodaran, 2002). In addition, by assuming that all firms in a sector have the same operating leverage one can directly use these betas without adjusting for eventual differences between the average firm in the industry and the firm being valued.
𝐵𝐿 = 𝐵𝑈× (1 + (1 − 𝑇𝐶) ×𝐷 𝐸)
2.1.3. Cost of Debt
The cost of debt is used to calculate the cost of debt financing for a certain project (Damodaran, 2006). It is computed adding the risk-free rate to the company’s default spread (related to the company default risk). In order to estimate the latter, Damodaran (2002) proposes linking the interest coverage ratio3 and the financial rating. Additionally, to use the cost debt in the WACC calculation, one needs to know the market value of debt. Brigharm and Ehrhardt (2011) state that “if the company’s debt is not publicly traded, then it is reasonable to use the book value of debt” because “book and market
3 The interest coverage ratio is used to access how easily or not is a company able to pay interest on its
16 Miguel Andrade M&A: The Case of Cimpor and InterCement values of debt are usually close to one another”. However, such method cannot be used if the company has debt trading in the market in the form of bonds.
2.1.4. Terminal Value
The terminal value of a project represents a significant part of its present value and always has to be included (Kester and Morley, 1997). Before computing the terminal value, the length of the forecasting time frame must be calculated. Then, assuming that the last periods’ cash flows will be generated as a growing perpetuity is the most appropriate method regarding concerns with the indefinite life of the project (Ohlson and Zhan, 1999).
The growth rate to be applied should determine the annuity requirements for working capital and investment. Steiger (2008) stressed that the terminal growth rate should be similar to the nominal GDP growth, since in the long-run a company is not expected to grow faster than the country’s economy where it has its business. Also, during the stable stage of the business capital expenditures (CAPEX) should be equal to depreciations and amortizations (D&A) (Kaplan and Ruback, 1996). Finally, since the final enterprise value is mostly driven by WACC and the terminal growth rate, sensitivity analysis are often recommended.
Some argue that, because the perpetuity method depends too much on the growth rate used, applying an EBITDA multiple to the last year EBITDA is more advisable. However, according to Kapan and Ruback (1996), “by using the cash flows forecast over the forecast period and then applying the current EBITDA multiple at the end of the period, the hybrid approach effectively double-counts the higher growth during the forecast period”.
2.1.5. Adjusted Present Value
Although only the WACC method is going to be used in this work, one cannot ignore the existence of its main alternative: according to Luehrman (1997), “Adjusted Present Value works when WACC does, and sometimes when WACC doesn’t, because it requires fewer restrictive assumptions”. The main assumption when applying the WACC method
Miguel Andrade M&A: The Case of Cimpor and InterCement 17 is a constant ratio of debt to total capital. Although it is possible to recalculate the WACC for every period taking into account the leverage evolution, this work is difficult and tedious and it may generate some confusion regarding where the value of the company is coming from.
In addition, the weights attributed to equity and debt when computing WACC are based on their market values. Luehrman emphasizes this issue by saying that “if we knew the true market value of the assets, we wouldn’t need to do the analysis in the first place”. Having this in mind, one could say that APV is a better tool when addressing the origin of value creation, as it distinguishes between the value of the project alone and the inherent financing side effects:
𝐴𝑃𝑉 = 𝐵𝑎𝑠𝑒 𝐶𝑎𝑠𝑒 𝑉𝑎𝑙𝑢𝑒4 + Value of all Financing Side Effects5
If on the one hand it is rather consensual that APV is a better method when the companies are highly levered and their financial structure is projected to vary significantly during the forecasted periods, the same does not apply when choosing which rate to use to discount the financial effects’ cash flows.
By using APV, one ensures that the discount rates only contains the time value of money (risk-free rate of interest) and a risk premium (according to the riskiness of the cash flows being discounted). Any other value generated by financial maneuvers (e.g. tax savings, risk management, etc.) has its own cash flow consequences.
The reason behind the use of WACC instead of APV is the assumption of a constant leverage ratio in the forecasted time period, for both companies, which makes APV useless for valuation purposes in this work.
2.2. Multiples
As stated earlier, in addition to DCF, I will also use the multiples’ approach which, instead of relying on forecasts, requires a look at how the company’s peers are valued by the market. However, two conditions must be verified for the sake of accuracy: the comparable companies used should bear the same level of risk and should have similar
4 Value of the project as if it was financed entirely with equity.
18 Miguel Andrade M&A: The Case of Cimpor and InterCement expectations for growth and Return on Invested Capital (ROIC). Secondly, one has to assume that the value of the company varies in the same direction and proportion as the performance measure (i.e., if expected Net Income increases by 5%, expected value also rises by 5%).
If these assumptions are valid and these conditions fulfilled, the multiples approach will prove to be a more rigorous measure of value, since the multiple itself already incorporates updated market expectations of future cash flows and discount rates (Kaplan and Ruback, 1996).
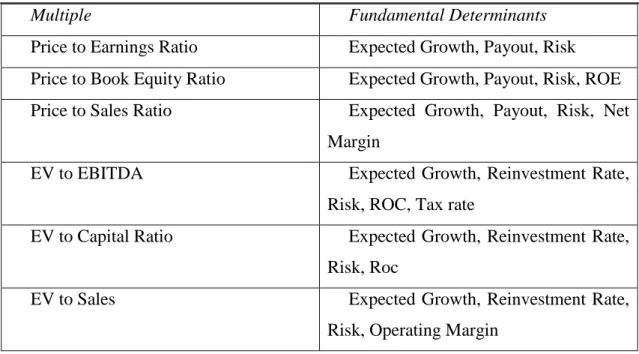
In addition, it is still possible to divide these multiples in two types: market and transaction (Vernimmen 2005). The market one has its focus on a sample of comparable companies, while the transaction one is based on a sample of past company transactions. Furthermore, according to Damadoran, one can also separate the market multiples based on their fundamental determinants:
Table 1: Fundamentals determining equity multiples (Damodaran, 2006)
Multiple Fundamental Determinants
Price to Earnings Ratio Expected Growth, Payout, Risk Price to Book Equity Ratio Expected Growth, Payout, Risk, ROE Price to Sales Ratio Expected Growth, Payout, Risk, Net
Margin
EV to EBITDA Expected Growth, Reinvestment Rate,
Risk, ROC, Tax rate
EV to Capital Ratio Expected Growth, Reinvestment Rate, Risk, Roc
EV to Sales Expected Growth, Reinvestment Rate,
Risk, Operating Margin
With so many multiples to choose from, Goedhart, Koller and Wessels (2005) highlight main two points to follow when valuing a company:
The use of individual companies’ multiples – since the average industry ignores the fact that even though companies belong to the same business area, their growth rates, ROIC and capital structures may vary drastically;
Miguel Andrade M&A: The Case of Cimpor and InterCement 19 The use of Enterprise-value multiples instead of Market Capitalization ones – since the latter are systematically affected by capital structure.
The most common type, P/E, includes many nonoperating items, which are also very specific to each individual company. EV/EBITDA is the most recommended not only because it is less susceptible to variations in the capital structure, but also because it does not take into consideration nonoperating expenses. The P/Sales assumes that the companies chosen have the same operating margins as the one being valued. PEG is similar to the P/E multiple, except it adjusts for the different growth expectations across companies. However, it still has all the other limitations as the P/E multiple.
In conclusion, although the multiples method poses a very good valuation method, the choice between it and the DCF approach depends on “whether the benefits of using firm-specific information in the DCF method are greater than the costs of ignoring the contemporaneous measures of market expectations contained in the comparable methods” (Kaplam and Ruback, 1996). However, one should not forget that an integrated analysis comprising both DCF and multiples valuation “can hold useful discussions about whether the company is strategically positioned to create more value than other industry players” and also “generate insights into the key factors creating value in an industry” (Goedhart et al., 2005).
2.3. Synergy
According to Damodaran (2005), synergy is the “additional value that is generated by combining two firms, creating opportunities that would not have been available to these firms operating independently”.
There are two types of synergies: operating synergies and financial synergies. Operating synergies include economies of scale (mainly through cost savings, usually resulting from horizontal mergers, which are the most reliable source of synergy), stronger pricing power (due to reduced competition and higher market share), combination of different functional strengths and higher growth in new or existing markets. These type of synergies affect the value of the firms involved in a merger or acquisition by affecting margins, returns and growth.
20 Miguel Andrade M&A: The Case of Cimpor and InterCement Financial synergies, on the other hand, can influence not only the cash flows, but also the cost of capital: a combination between a firm with excess cash and a firm with high-return projections but scarce cash can generate synergies – the value of these synergies would be the projects that a firm with high-return projections would set aside due to not having sufficient money to finance them. If the cash flows of the combined firm become more stable and predictable, the debt capacity of the new firm is expected to increase. In addition, Lewellen (1971) states that these benefits should be analyzed in terms of reduced default risk. Tax benefits may be gained by taking advantage of tax laws to write up the acquired company’s assets or from using its net operating losses to smooth income. At last, diversification is often doubted because investors in the firms can diversify on their own, thus firm diversification should not generate any value creation.
Synergies can be calculated by forecasting the cash flows of the combining firm, discounting them at the appropriate rate (i.e., respective to the new firm and not to the acquirer/target one) and then subtracting the sum of the two standalone companies before the merger takes place. After calculated, these synergies must be split between the acquiring and the acquired firms according to the share of unique strengths that contribute to these synergies. For instance, if costs savings are available in other peer group firms besides the acquiring one, the target shareholders would be “likely to receive a larger share of the benefits” (Damodaran, 2005).
The history around synergy sharing allows us to conclude that almost all of the synergy value goes to the acquired firm’s shareholders (Jensen and Ruback, 1983). As a result, it is not surprising that the most common error when valuing synergy is providing items or strengths to the target firm’s stockholders that these stockholders had no role in creating. Notwithstanding, a study from Boston Consulting Group showed that sellers collect, on average, 31 percent of the average capitalized value of expected synergies.
In sum, it is important to distinguish between the value of synergy and the value of control in order not to incur in double-counting errors: the value of control is the incremental value of the target firm assuming a new and better governance by the new management team. This value should be attributable to the acquiring firm shareholders, since they are the only ones who contribute to this value creation.
Miguel Andrade M&A: The Case of Cimpor and InterCement 21
2.4. Other Issues
2.4.1. Mergers and Acquisitions’ Implied Strategies
The categorization of a Merger and Acquisition (M&A) deal depends on the strategic intent that underlies it. According to Bowler (2001), “M&A actually represent very (five) different strategic activities”, these being: overcapacity, geographic roll-up, product/market extension, M&A as R&D and industry convergence.
Overcapacity M&A is the most common one6 and it usually occurs when an industry
is at its maturity stage in its life-cycle and thus tending to consolidation. The main goals underlying this strategy are elimination of excess capacity, a bigger market share and more efficient operation by closing less competitive facilities, elimination of less effective managers and rationalization of administrative processes. The biggest issue with this type of merger is the cultural clash between the participants, since both are well-established large companies that have their processes and values deeply entrenched. The geographic roll-up M&A occurs when two firms in the same geographically fragmented industries merge, usually in an early stage of the industry’s life cycle. The product/market extension M&A consists of the extension of a company into new markets or products, thus increasing its international coverage or its product line. The M&A as R&D is usually used in the presence of companies producing products with short life cycles and which production requires fast high-tech developments – in these scenarios, acquisitions are used in lieu of in-house R&D to quickly build a market position. Finally, the industry convergence M&A takes place when the eroding boundaries between two industries act as an incentive for a company to acquire another, thus creating a new pioneer in this new industry.
2.4.2. Cross-Border Valuation
Since the early 1990s, the relaxation of capital controls, elimination of barriers to trade, European economic integrations and the economic opening and growth of emerging countries in Eastern Europe, Asia, Africa and Latin America enabled the beginning of
6 It accounts for 37% of the M&A deals in the breakdown of the article “Not All M&As Are Alike –
22 Miguel Andrade M&A: The Case of Cimpor and InterCement mergers and acquisitions between companies around the world, thus leading to the strengthening of the globalization7 trend (Kester and Morley, 1997).
The current crisis had a negative impact in the GDP growth in the USA and in the majority of the developed countries in Europe. The stagnation of their local economies hampered the development of several business in these countries, which forced companies to expand themselves to emerging markets in order to look for more growth opportunities. On the other hand, having in mind the need to reduce “sovereign exposure”, emerging-markets firms soon began to diversify their business through the purchase of foreign assets (especially developed-market assets) (Zennet, Mathews, Marks and Mago, 2008).
Nevertheless, despite the growth of free-market based economies, there are still some forces hindering cross-border transactions, namely protectionist sentiments: for instance, the existence of “national champions” may result in some resilience by the local governments to sell them to foreign entities.
2.4.3. Geographic Diversification and Multi-Nationality
Although literature about the relationship between multi-nationality and firm performance has mostly rejected the hypothesis of being positively correlated, Driffields, Du and Girma (2005) proved that, after controlling for firm level and industry factors, that relationship is positive.
The benefits of geographic diversification are significant, and one of them is the protection against exchange rate swings, and faster responses to changes in local demands (Barlett and Ghoshal, 1986). Kogut (1985), Benvignati (1987), Grant (1987), Gomes and Ramaswamy (1999) and Contractor (2003) have also argued for several others advantages inherent to multi-nationality such as dampening the impact of domestic business fluctuations by using foreign market outlets, taking advantage of factor cost differentials across multiple locations and greater geographic dispersion which facilitates the
7 “Globalization is the increasing inter-connectedness of people and places as a result of advances in
Miguel Andrade M&A: The Case of Cimpor and InterCement 23 undertaking of domestic ventures that are high-risk but also highly profitable. In addition, firms with low tech requirements are able to choose between a larger set of host countries where they want to expand to.
Finally, it is important to explain why most of the literature on this subject does not consider positive the relationship between geographic diversification and firm performance: one factor suggested by Dfriffields, Du and Girma (2005) is that some firm exposure to specific countries may take time to pay-off, and due to the short time series and small samples available, these hypothetical pay-offs did not have the time to appear, thus hampering their inclusion in previous studies.
2.4.4. Fire-Sale
Krugman (2000) argues that “foreign acquisitions of target firms from crisis countries surge amid a financial crisis” and that “these target firms are sold at prices below fundamental values”. Wetizel, Kling and Gerritsen (2014) test the fire-sale hypothesis for the European financial crisis and conclude that “countries affected by a crisis attract foreign buyers selling assets at a discount”. One critical example is the sale of Portuguese assets to Swiss and French companies, which was also influenced by the fact that the Troika demanded Portugal to sell €5bn of state companies as part of the deal from which the country received a €78bn bailout in May 2011.
2.4.5. Market for Corporate Control
According to Fama (1980) there is a market for corporate control if one assumes financial markets are efficient. As a consequence, if a company underperforms, that will jeopardize its value and consequently its shareholders will see their wealth decreased. In line with this rational, this market can be described as an external mechanism, composed by firms and individuals who buy equity positions in potentially undervalued corporations, that is activated in the event of failure of a firm’s internal control (Hit et. al, 2007). This leads to the discipline of managers who are ineffective or act opportunistically (Sinha, 2004).
24 Miguel Andrade M&A: The Case of Cimpor and InterCement
2.4.6. Cash vs. Stock
Despite having covered several issues regarding valuation, there is still need to mention the different payment methods acquirers can chose from when buying another company: cash offers and stock offers. While the first one is a simple trade In between shares and cash, the second requires the acquirer to offer their shares as a way of payment for the respective target shares. Rappaport and Sirower (1999) state that the main distinction between the two methods is how the risks and the potential benefits are shared: in a cash offer all the risks and expected synergies are borne by the buyer while in the stock transaction the target is also allowed to profit for the potential synergies, as well as to share the inherent risks.
However, other criteria aside from this risk/return analysis may be used. In fact, the acquirer assessment of whether its shares are overvalued or not plays an important role in the decision making, as the buyer will be more prone to a stock transaction if he believes its shares are overvalued.
Finally, Rianda (n.d.) states that “if the purchaser is privately held, the ability to sell any shares in the company is very limited” since it is difficult to find buyers willing to purchase those shares.
3. Industry Review
3.1. Intro to Cement
Cement is considered to be the main input of the building industry. Within this sector, cement can be used in different segments of heavy building, house construction, and construction services. Given its importance, one could then argue that analyzing the
evolution of cement's demand means analyzing the evolution of the building industry itself which, in turn, is highly subjected to economic cycles (namely the construction and building materials industry): it grows sedately in mature economies and faster in developing countries. This makes cement producers and their respective shareholders highly exposed to the volatility of their returns.
Miguel Andrade M&A: The Case of Cimpor and InterCement 25 As far as competition is concerned, there is not a straightforward substitute of cement. It is a homogeneous product, which as a result does not allow for product differentiation. Instead, companies in this industry try to overcome competition through prices and operational efficiency.
3.2. Production Process
Cement is produced mostly from limestone and clay in a roughly 5:1 weight proportion; for each ton of cement 1.4 ton of limestone are needed. For this reason, and also to reduce transportation costs, factories are often located near limestone’s fields. As far as clay goes, it is relatively easy to find it in the nature.
Besides limestone and clay, the other main necessary inputs to produce cement are: energy – which represents the largest (40% on average) variable cost; water – 100 liters per ton of cement; additions – which provide a significant reduction in CO2 emissions; and fuel – which, as some other raw materials, has been recently substituted by residues.
3.3. Scale and Production Costs
Forge is the most important production input in the cement industry. It is inside the forge that the most vital transformation of all the cement production process takes place. Given the chemical feature of the process, there is a small interval between a minimum and a maximum quantity at which the forge is able to produce within a determined efficiency pattern. This makes the cement production extremely vulnerable to market fluctuations, as it is directly dependent on the forge’s capacity.
Cement demands a significant cost of entry as the construction of a new plant costs around US$200 per ton of capacity. This brings about three main issues: first of all, it results in a high minimum efficiency scale – which has been growing in the last decades, as companies have been driven to periodically invest in the enlargement of their scale in order to increase productivity and face competition; secondly, the difficulty companies have in incrementing marginal productivity, since increases of supply occur through huge jumps in quantity produced, being these supply increases conditioned by an expected
26 Miguel Andrade M&A: The Case of Cimpor and InterCement usage of at least thirty years ; finally, the strong weight of fixed costs in the production of cement allows for the extremely costly existence of idle capacity in the industry.
3.4. Prices
Cement features, already described, make its transportation through long distances extremely expensive. As a result, its prices are determined locally – allowing for a big difference between cement prices in different regions of the word - according to four variables: population growth, GDP per capita, degree of competition and capacity utilization rates.
The first two determine the volumes consumed within each country. The degree of competition is highly influenced by the business scale, already mentioned, since it creates great advantages for the players already established in the market, while at the same time acting as significant entry barriers for beginners (as the amount of capital required to enter in this industry is considerably high). Finally, as far as capacity utilization rate is concerned, if the volumes sold are not in line with the ones expected when new capacity was built, prices usually decrease to face the supply/demand inbalance, failing to keep pace with cost inflation and sometimes reaching levels below the average costs.
The following graphs show predictions concerning utilization rates and cement prices’ variation through 2015. 60% 65% 70% 75% 80% 85%
2004 2005 2006 2007 2008 2009 2010 2011 2012 2013E 2014E 2015E 2016E 2017E
Graph I: Global Capacity Utilization Rate
World ex-China Emerging markets ex-China
Miguel Andrade M&A: The Case of Cimpor and InterCement 27
Table I: Cement Price Change Ex-Inflation YoY
2012 2013E 2014E 2015E 2016E 2017E
Western Europe 1,0% -1,3% -1,0% 0,1% 0,2% 0,0%
Eastern Europe -1,0% -1,2% -0,2% -0,7% 0,5% 0,0%
Former Soviet Union 8,2% -2,3% -1,1% -0,2% 0,9% 0,0%
North America 0,9% 3,0% 1,5% 2,2% 1,7% 0,9% Latin America 0,6% -2,7% 0,7% 0,3% 0,1% 0,0% MENA -1,8% -0,4% -2,3% -0,7% 0,4% 0,0% Sub-Saharan Africa -2,0% -3,9% -1,4% -1,5% -0,2% 0,0% China -18,5% -3,1% 1,2% 0,5% -0,5% -0,5% India 1,7% -11,1% 0,1% 2,0% 2,4% 0,0% North Asia 6,2% -0,7% -0,4% -0,2% 0,0% 0,0% South Asia -2,3% -3,0% -1,2% -0,8% 0,0% -0,1% Australia/Pacific -1,3% -2,4% -1,5% -1,1% -0,5% 0,0% World (ex-China) 0,6% -2,9% -0,8% 0,0% 0,7% 0,0%
3.5. Intro to Brazil Market
The evolution of the cement industry in Brazil has been driven by the development of the country's production forces and its' increasing integration in the international markets. The different cement consumption cycles are connected with the economic and demographic growth, while investments are related both with the consolidation and diversification of the main firms in the country and with the capital inflows coming from the main developed markets.
The government support of the country’s industrialization enabled the main local economic agents to diversify their business and apply resources to the cement sector, which in turn led to a decrease in the importance of foreign capital in Brazil. Consequently, strategic investments in new plants were made, the current ones were modernized and companies began to merge and to acquire competitors; this shaped the industry into an oligopoly, with fewer groups being responsible for considerable portions of the national market, under the lead of local business communities (e.g. Ermírio de Moraes, Camargo Corrêa e João Santos). However, the interchange between periods of consumption and periods of stagnation, together with the intensification of the oligopolistic fights, led the main national groups such as Votorantim and Camargo Corrêa to diversify their playing fields, through more acquisitions, new investments and partnerships abroad.
28 Miguel Andrade M&A: The Case of Cimpor and InterCement The recent local consumption development has been intensifying oligopolistic competition inside the country namely through investments from the main already installed foreign players (e.g., Lafarge and Holcim) and entrance attempts by other important global producers (e.g., Cemex, Titan). Thus, the expected actions of the main local companies in the medium run concern investments aimed at ensuring the possession of local market shares and attempts to take advantage of the increase in local consumption, by challenging both locally the main international firms established in Brazil and globally the ones present in markets where Brazilian groups have already invested in.
3.6. Intro to European Union Market
3.6.1. Europe
By the end of 2010, EU27 countries were still facing a decrease in the production of cement: excluding Turkey, the drop in production was – 5.4%, which followed a downward trend of -20% in the previous year, and the fact that only eleven out of twenty-eight countries had experienced a positive trend. This drop was mainly caused by the decrease in domestic demand, which can also explain the drop in imports by -6.7%, albeit member countries exports rising by 5.3%.
150 170 190 210 230 250 270 290 310 330 350 2 0 0 0 2 0 0 1 2 0 0 2 2 0 0 3 2 0 0 4 2 0 0 5 2 0 0 6 2 0 0 7 2 0 0 8 2 0 0 9 2 0 1 0 EU27 CEMBUREAU mt
Source: CEMBUREAU Activity Report 2010 Var 2010/09
-0,7%
-5,4%
Miguel Andrade M&A: The Case of Cimpor and InterCement 29
3.6.2. Portugal
The tight financial conditions and the additional consolidation measures needed in order to meet the demanding fiscal targets resulted in a deceleration of all the domestic demand components, especially private consumption. In addition, some measures, including the suspension of some public work projects, were specifically aimed at reducing public spending. All of this had negative consequences in the construction sector, as the sector’s activity fell -6.5% in 2010 followed by -5% in 2011.
3.6.3. Spain
Gigh unemployment rates and credit restrictions caused by the economic crisis affected both construction enterprises and consumers. By the end of 2010, there was a decrease in investment in public civil engineering works and a delay in the completion of public and private projects as the local government’s special investment plan for building construction was put to an end. Furthermore, the housing subsidies were cut, which meant no more tax reductions for house purchases and for annual mortgage payments.
Figure 1: Evolution of Cement Consumption in CEMBUREAU countries (%Variation 2010/2009)
30 Miguel Andrade M&A: The Case of Cimpor and InterCement
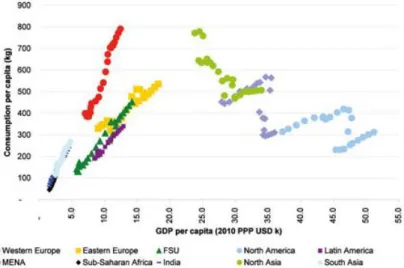
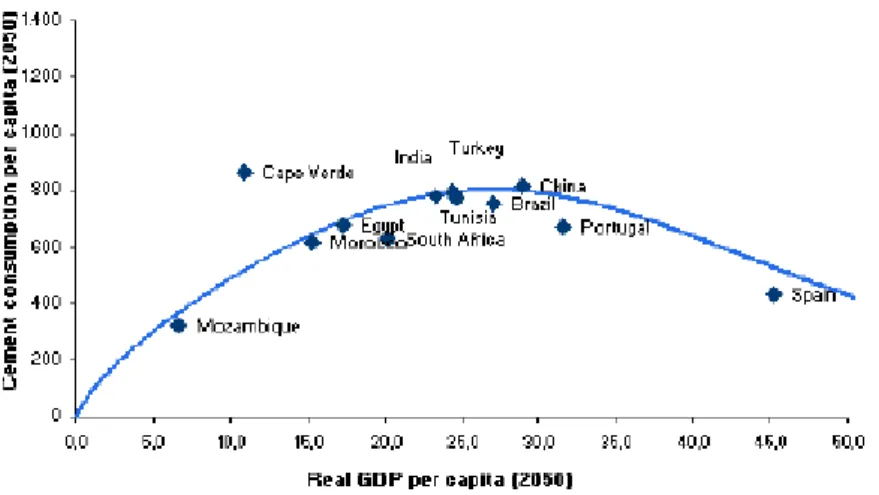
3.7. Intro to Emerging Markets
Contrary to what happened with developed countries, most of the emerging economies are still on the rising part of the cement consumption bell curve, suggesting that consumption per capita tends to rise in early stages of economic development and ceases to do so when GDP per capita reaches advanced levels (Figure2). However, the future path is expected to be both more moderate and sustainable.
Figure 2: Cement Consumption per capita vs GDP
Source: Industry and national sources, CEMBUREAU, Global Cement Report, IMF, Morgan Stanleu Research
Figure 3: Development of Global Cement Volumes Between 2006 and 2011
Miguel Andrade M&A: The Case of Cimpor and InterCement 31
3.8. Volumes Sold, Revenues, Biggest Players and Trends
3.8.1. Production by Region and Biggest Players
In the year 2010, total cement production around the world was 3.3 billion tons, with China representing more than half of this number. Excluding China, the top main producers according to installed capacity were Lafarge, Holcim and Heidelberg.
China 56% India 6% Japan 2% Others Asia 13% CEMBUREAU 8% CIS 3% USA 2% Other America 5% Africa 5%
Graph III: 2010 World Cement Production
Source: CEMBUREAU Activity Report 2010
Total = 3.3B tons 0 50 100 150 200 250 300
Graph IV: World Ranking by Cement Capacity mt
32 Miguel Andrade M&A: The Case of Cimpor and InterCement
3.8.2. Crisis and Post-Crisis
Unless the paradigm has shifted, recovery will follow slump. World Bank forecasts showed GDP growth in developed world at 2.2% in 2011, followed by growth rates of 2.6% to 2.7% in 2012-13, with developing nations growing at 6.3% in 2011-2013.
During the crisis, while emerging markets were mostly stable with some growth, developed markets saw catastrophic reversals. Overall, the estimated decline for cement prices was around 15% in the 2009-10 periods. The costs eased initially, but then rose steadily through 2010, and at the moment are growing more than 30% yearly. All of this had a negative impact in the supply/demand balance, leading to overcapacity in a number of markets including emerging ones, with drops below 60% in Europe and USA.
Several people in the business world argue that there is an opportunity in adversity (i.e. in periods of crisis), as managers seek out to eliminate waste and reconfigure the shape of the business. In times like these, CEOs of cement companies begin to give priority to effective cash management and preservation of Free Cash Flows by reducing maintenance and operational improvement projects, cutting growth initiatives (organic and acquisitions) and tightening working capital. In addition, SG&A and revenue-driven costs are reduced, as well as targeted debt (i.e. deleveraging), through restructuring and issue of equity.
Generally, main indicators show that the industry is in a mature stage of development, where growth expectations exist, although lower than in pre-crisis years. The global industry revenue is slowing, with CAGR of 7.3% in 2005-10 and expected 5.3% for the years 2010-2015. The industry is now expected to be driven by increasing competition, with more and more firms focusing on cost-cutting as a way of remaining competitive. Brazil should continue to expand, albeit there are risks after the World Cup preparation. In the MENA8 region, one should observe better trends mainly since Egypt and Morocco are now recovering from past drops. Sub-Saharan Africa should be the fastest growing region during the next years given the still very low levels of cement use.
8 Set of countries belonging to the Middle East and North regions of Africa. The biggest ones are Ehypt,
Miguel Andrade M&A: The Case of Cimpor and InterCement 33
3.8.3. Globalization and Consolidation
Worldwide cement production is characterized by the presence of big business groups, most of them with family property origins, who have operations spread across several countries.
A significant process of consolidation in the global cement industry has been running its course since the mid-1980s. At the same time family-run and state-owned firms have been put up for sale and a few MNCs have been on a buying spree – moving aggressively into new markets and expanding to markets where they had previously operated. Without taking China into account, the combined production share of the world’s six largest firms9
is 44% at the moment, up from 25% in 200010.
Eastern Europe was the first region to verify a burst of acquisition activity, after the collapse of communism in the early 1990s and the privatization spree that ensued. This was followed by a merger and acquisitions surge in Latin America, as one-third of total capacity changed ownership between 1994 and 1999. In Asia, as a consequence of the financial crisis, from 1998 onwards many foreign-currency debt-laden Asian manufacturers sold off their assets to larger global enterprises. Finally, in the Mediterranean European countries, the combined capacity share of the six largest companies went up to 48% in 2000 from 33% in 1993. Still in Europe, of the twenty firms operating in France in 1970, just four of them remained operating in 2000.
More recently, players from emerging markets are becoming more ambitious and starting to influence the business landscape. They are playing an increasingly large part in the current M&A trend and in the sector’s capacity expansion. Well established and rational cement producers are expected to increase their returns in emerging markets via consolidation.
This trend towards consolidation has structural reasons behind it: the tendency of growing production scales mentioned earlier is one of causes of concentration in the supply structure in the global cement industry, since the initial investment cost is becoming bigger and bigger.
9 Holderbank, Lafarge, Cemex, Heidelberger, Taiheiyo, Italcementi. 10 It was 23% in 1995 and 14% in 1985.
34 Miguel Andrade M&A: The Case of Cimpor and InterCement Besides scale, being transnational also plays an important role in valuation, as both generate economies of scale, reduce cyclicality and lower volatility of earnings. In addition, size is also able to bring benefits in terms of reduced cost of capital. Thus, mergers and acquisitions not only bring about multiple synergies and huge cost reduction benefits, but are also the fastest route to growth.
3.8.4. Speculative Bubble in the Brazilian Residential Real-Estate Market
The heavy building industry is connected with the real-estate market. Consequently, any development in the latter would significantly affect the former. Fears of a bubble in the Brazilian real-estate market have been subject to rumors. According to Oliveira & Almeida (2014), the dramatic increase in Brazil’s house prices lead to “speculative bubbles in the residential real estate market for the two main Brazilian cities, São Paulo and Rio de Janeiro, during the recent years”.
4. Companies’ Description
The industry review section showed that cement is an extremely homogeneous product and that there is practically no margin for differentiation. Both Cimpor and InterCement are driven by the same types of volumes, prices and cost pressures. In addition, their businesses focus on the sale of cement and clinker (which is the most profitable product in the industry), and on concrete and aggregates at a lower level regarding revenues and margins influence. Cement companies can be differentiated based in the markets they are exposed to, their degree of leverage, the operational efficiency and their shareholder structure. Since the first have already been addressed in the previous section, I will focus on market exposure, operational efficiency and financial and shareholder structure when describing Cimpor and InterCement main features.
Miguel Andrade M&A: The Case of Cimpor and InterCement 35
4.1. Cimpor
4.1.1. Overview
With its headquarters in Portugal, Cimpor lies amongst the top ten biggest cement groups operating globally, and it ranks 7th in Europe. The 26 factories with 16 cement millings have currently an installed production capacity of 36.5 million tons of cement per year.
Cimpor operates in Portugal, Spain, Cabo Verde, Brazil, Morocco, Tunisia, Egypt, Turkey, Mozambique, South Africa, China and India, employing around 8.250 workers of 33 nationalities. Approximately 60% of Cimpor’s EBITDA derives from Brazil, Portugal and South Africa. In addition, Cimpor produces and commercializes concrete, aggregates and mortars, as a result of a vertical integration strategy, albeit it is less vertically integrated than groups such as Lafarge, Cemex, HeidelbergCement and Holcim. Moreover, Cimpor still makes most of its revenues in cement.
Figure 4: Cimpor Sales Breakdown (2011)
36 Miguel Andrade M&A: The Case of Cimpor and InterCement Portugal 15% South Africa 10% Egypt 8% Morroco 7% Spain 6% Turkey 5% Tunisia 4% Mozambique 4% Other 3% China 3% Cape Verde 1% India 1% Brazil 33%
Graph V: Cimpor EBITDA Breakdown by Country (2011)
Source: Exane BNP Paribas estimates from company data
Portugal 19% South Africa 4% Egypt 11% Morroco 4% Spain 9% Turkey 8% Tunisia 5% Mozambique 3% China 16% India 3% Brazil 18%
Graph VI: Installed Capacity Breakdown by Country (2011)
Miguel Andrade M&A: The Case of Cimpor and InterCement 37 From 2006 to 2009, Cimpor’s ambitious acquisitions and capex program resulted in a 45% increased capacity, mainly in India, Turkey, Latin America, Canary Islands and China.
Figure 4: Cimpor cement capacity evolution since 2002
Source: Cimpor, Exane BNP Paribas estimates
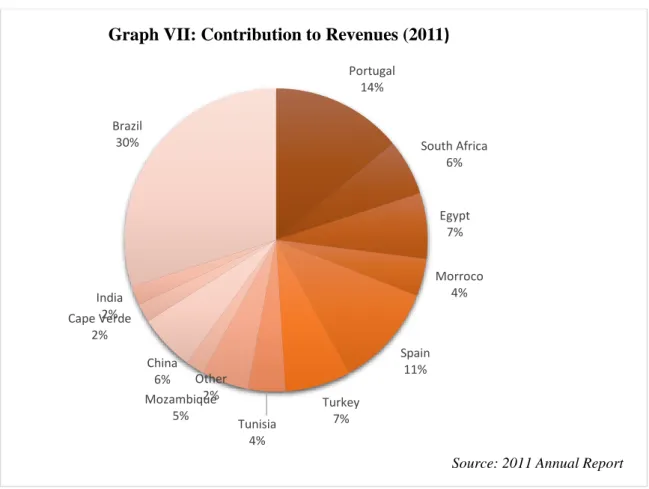
Portugal 14% South Africa 6% Egypt 7% Morroco 4% Spain 11% Turkey 7% Tunisia 4% Mozambique 5% Other 2% China 6% Cape Verde 2% India 2% Brazil 30%
Graph VII: Contribution to Revenues (2011)
38 Miguel Andrade M&A: The Case of Cimpor and InterCement Due to the financial crisis, in 2009 and 2010, Cimpor’s strategy was characterized by investment restrictions to consolidate solid financials and gain credit in the markets. Following this strategic slowdown, in 2011 Cimpor returned to a sustainable growth plan, with significant investments aimed at achieving increased capacity, operational efficiency, environmental conditions and safety. Consequently, net operating investments totaled EUR 294.5Million in 2011, about 80% more than the amount invested the previous year.
4.1.2. Financials
Despite the external financial and economic context, Cimpor’s main financials remained strong between 2009 and 2011. Its recognition as an emerging markets’ company, its exposure to these growing economies, the reduced presence in Europe and the fact that it is not present in the United States of America justify the important advantage over its competitors, especially regarding operational return. This has allowed Cimpor not only to keep the highest EBITDA margin among international cement producers, but also to grow above its peers in the past three years.
606 630 616 29% 28% 27% 0% 5% 10% 15% 20% 25% 30% 35% 40% 0 100 200 300 400 500 600 700 800 900 1000 2009 2010 2011
Graph VIII: EBITDA and EBITDA Margins
EBITDA EBITDA margin Source: 2011 Annual Report
Miguel Andrade M&A: The Case of Cimpor and InterCement 39 In what concerns the financial structure, Cimpor has been delivering its D/V ratio, mostly because of the unfavorable economic climate. This change in the debt structure contributed significantly to the fact that Cimpor has kept a stable rating in spite of the very adverse Portuguese credit conditions.
28% 24% 22% 21% 19% 17% 16% 15% 7% 0% 5% 10% 15% 20% 25% 30% Cimpor Secil Lafarge Holcim Heidelberg Cement Italcement Group Cemex Buzzi Unicem Taiheiyo Cement
Graph IX: EBITDA Margins per Company
Source: 2011 Annual Report
16,2 17,4 11,8 10,6 2,2 1 0,8 0,5 -15% -10% -5% 0% 5% 10% Lafarge Holcim Heidelberg CEMEX Cimpor Valderrivas Molins SECIL
Graph X: Evolution of Revenues (CAGR 2006-2011)
40 Miguel Andrade M&A: The Case of Cimpor and InterCement
Figure 5: Rating Evolution (Dec 2010 – Dec 2011)
Source: 2011 annual report
Within a context of great instability in the capital markets, particularly in the Eurozone, Cimpor’s share price increase of 4.9% in 2011 has clearly contrasted with the drops of 28% of the Portugal’s Index, 14% of Nest100 and 36% of its industry peers.
Figure 6: Stocks’ price evolution
Source: 2011 annual report
Overall, one can say that the key factors of success of Cimpor are its operational efficiency, its market exposure and its low degree of indebtedness.
Miguel Andrade M&A: The Case of Cimpor and InterCement 41
4.1.3. Shareholder Structure
Cimpor’s shareholder structure is very small, with five shareholders controlling the firm’s share and free floating at only 15.6%.
4.2. InterCement
4.2.1. Overview
InterCement Participações S.A. is a holding company formed by InterCement Brazil, a firm present in the business of producing and distributing cement, concrete and aggregates, and by Loma Negra, an Argentine cement producer. InterCement Brazil and Loma Negra have alignment of business areas and standardized procedures. At the beginning of 2012, InterCement Brazil was the third largest cement producer in the country. The holding company is controlled by Camargo Corrêa Group, which also holds 33% of the stock of Cimpor.
Camargo Corrêa 33% Votoratim 21% CGD 9% Manuel Fino 11% BCP 10% Free Float 16%
Graph XI: Cimpor's Shareholder Structure
42 Miguel Andrade M&A: The Case of Cimpor and InterCement With an installed capacity of 16 million metric tons of cement a year, InterCement is one of the biggest players in Latin America. The company sold 12.7 million metric tons of cement in 2011, 6.4 of which accounted for the Brazilian market, where it holds a 10% market share, and 6.1 for the Argentinian market, where the firm has the market leadership through Loma Negra.
Votorantim 37% Nassau 12% Camargo 10% Lafarge 9% Cimpor 8% Holcim 6% CSN 5% Others 13%
Graph XII: Brazil Cement Industry - Market Shares
Source: Exane BNP Paribas estimates from company data
3,5 4,7 5,1 5,9 6,4 5,3 5,5 5 5,5 6,1 0,1 0,2 0 2 4 6 8 10 12 14 2007 2008 2009 2010 2011
Graph XIII: Sales of Cement
Brazil Argentina Paraguay
mt
Miguel Andrade M&A: The Case of Cimpor and InterCement 43 Following an international expansion strategy, in 2011 InterCement announced investments of US $ 400 million aimed at expanding its facilities in Argentina.
Moreover, strong domestic economies with high consumption rates together with programs aimed at stimulating the construction and housing sectors as well as large infrastructure works have led to the growth of the cement industry in emerging markets, where Brazil holds a highlight position. In order to take advantage of these opportunities for growth, since 2005 InterCement has invested over R$ 8 billion in organic growth projects and in acquisitions.
4.2.2. Financials
As a consequence of InterCement’s total exposure to Latin America, its EBITDA has been growing for the past five years, with significant EBITDA margins around 25%. Furthermore, the company achieved record sales in 2011 as 12.6 million tons were sold, up 9.1% over 2010. Despite the positive outlook of InterCement’s operational performance, the financial structure of its controlling group is highly leveraged, with a D/V ratio of 0.61, which is reflected by a BB rating assigned by the rating agencies.
Overall, what drives the value creation of InterCement is its operational efficiency and the fact that the main country were they operate – Brazil – is one of the biggest emerging ones (if not the biggest) with very positive future prospects in the construction industry.
920 1410 1641 1905 2166 1026 1250 1395 1219 1399 8 19 0 500 1000 1500 2000 2500 3000 3500 4000 2007 2008 2009 2010 2011
Graph XIV: Gross Income by Country
Brazil Argentina Paraguay
R$ million
44 Miguel Andrade M&A: The Case of Cimpor and InterCement
4.2.3. Shareholder Structure
InterCement is 100% controlled by Camargo Corrêa, a solid family group with an international profile. This Brazilian conglomerate operates in twenty countries through six divisions: Cement, Engineering and Construction, Footwear, Textiles and Steel, Concessions, and Real Estate Development, Environment and Corporate. The cement one is represent exclusively by InterCement, which accounts for 33% of the group EBITDA in 2011.
5. Companies’ Valuations
Before starting to describe the methodology used in this work, it is pertinent to state that since the deal in question was completed on the 29th of May 2012, all the projections and computations will be made as if today was the first of January of 2012. All the data obtained was based either on what happened prior to 2012 or on what was projected to happen from 2012 onwards. The forecasted period will therefore start in 2012 and end in 2017, followed by an estimation of the terminal value.
In addition, the valuation will be made according to a Sum-of-the-Parts of all of the companies’ assets spread across the world, since their risk and growth profiles vary immensely from country to country.
Finally, a few months after the deal was made, there was a split of assets between the merged company and Votorantim, as a result of anti-trust concerns regarding competition in Brazil. However, taking this operation into account in this valuation would not only be too complex, but also ineffective for the purpose of the valuation, which is to determine how valuable InterCement and Cimpor, as well the merged company were at the time.