Leasing in low-cost carriers
José Frederico Pais Aleixo
152112029
Supervisor: Professor Ricardo F. Reis
Dissertation submitted in partial fulfillment of requirements for the degree of MSc in Business Administration, at Universidade Católica Portuguesa, January 2014.
ii
Leasing in low-cost carriers
José Frederico Pais Aleixo
152112029
Abstract
The aim of this paper is to explore the use of aircraft leasing as a financing instrument in the low-cost carriers’ sector. These airlines have been showing a huge growth in the customers’ preferences, while aircraft leasing plays a relevant role in the financing options of airlines. In this study we determined that lease future commitments represent on average 80% of other debt commitments in low-cost carriers. Furthermore, we discovered that the leasing rate in low-cost airlines (49%) is superior to the global average (39%), partly explained by the lower capital requirements that a lease offers comparing to a purchase. We found a high negative correlation between average fleet age and use of leasing. The reason is that leases allow the airlines to renew the fleet more easily and get younger aircraft (in fact, 67% of the leased aircraft are newly-manufactured, something unlikely to happen with purchases). Negative correlations were also found between use of leasing and the variables of fleet size, on-time performance, profit margin and debt ratio, but without statistical evidence. Use of leasing is best explained by average fleet age and fleet size, meaning that variables related to the constitution of the fleet are better in explaining the use of leasing by low-cost carriers than performance or financial measures.
Keywords: aircraft leasing, financing instruments, airlines,
low-cost carriers
iii
Acknowledgements
Foremost, I would like to acknowledge my thesis supervisor Professor Ricardo F. Reis for his coaching, optimism and continuous availability to help me during the process of execution of my thesis. In addition, I would like to express my gratitude to Católica Lisbon, the university where I spent my Undergraduate and Master’s degrees, which offered me a very high quality of teaching, allowing me to become knowledgeable and ready to enter the job market.
I would like to thank my girlfriend Mihaela for her attention and concern about the development of my thesis, for encouraging me all the time and for helping me with her experience of having already delivered a successful dissertation. I would also like to take this opportunity to thank my family, who remarkably supported my academic life since I was four years old. Their effort has been impressive and without them nothing would be possible. Therefore, I would like to dedicate this thesis to my family.
iv
Table of contents
1. INTRODUCTION 1
2. LITERATURE REVIEW AND HYPOTHESES DEVELOPMENT 3
2.1. Low-cost carriers’ features 3
2.2. Low-cost carriers’ performance 6
2.3. Operating and finance lease 8
2.4. Leasing as debt substitute or complement 9
2.5. Aircraft leasing 10 2.6. Financial performance 14 2.7. Service quality 15 3. METHODOLOGY 18 3.1. The industry 18 3.2. Data collection 21 3.3. The measures 21 3.4. Data analysis 23
4. RESULTS’ ANALYSIS AND DISCUSSION 25
4.1. Descriptive statistics 25
4.2. Pearson's product-moment correlation coefficients 26
4.3. Regressions 27
4.4. Characteristics of leasing in low-cost carriers 30
4.5. Discussion on the evolution of aircraft leasing 33
5. CONCLUSION 37
APPENDICES 39
v
List of abbreviations
LCC – Low-cost carriers FSC – Full service carriers
RPK – Revenue Passenger-Kilometers ASK – Available Seat-Kilometers
LIBOR – London Interbank Offered Rate AAII – Ascend Aircraft Investment Index
1
CHAPTER 1: INTRODUCTION
The aim of this paper is to explore the topic of aircraft leasing in low-cost carriers, hereafter referred to as LCC. Leasing embodies the alternative that airlines have to the typical aircraft purchasing option. Decisions concerning aircraft asset management are within the most crucial ones that airlines need to make, representing a huge relevance in the definition of their strategy.
Aircraft leasing has become an important tool for the airline industry. There are several reasons that explain airlines’ preference for this alternative source of financing. Firstly, lease gives them a higher flexibility to adapt the fleet to market demand. To have the possibility of changing size and composition of the fleet is something that attracts airlines and the more owned airplanes they have the harder this becomes. Secondly, leases allow airline companies to save money that otherwise would need to be invested in the acquisition of airplanes. This is particularly relevant, as a purchase demands high capital requirements that LCCs cannot afford. Thirdly, because this kind of leasing is an asset based financing, the airlines are able to generate cash flows from the business operations and asset exploitation (asset turnover), allowing them to afford the lease payments. These are three important benefits that lease offers, but more are going to be explored throughout the paper.
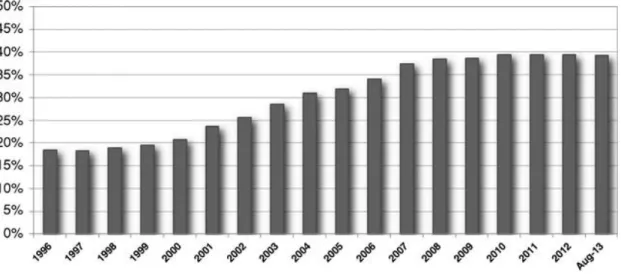
With all these advantages it is not hard to understand why aircraft leasing penetration rate is nowadays 39% (according to Ascend, a leading provider of expert advisory and valuations services to the global aviation industry), meaning that, on average, airlines fully own 61% of their fleet. However, the same source reveals that the leasing rate has never been this high. For example, back to the early 1980s only 2% of the global fleet was leased.
The air transport has been evolving and its numbers show a remarkable evolution. (See Appendix I) World’s revenue passenger-kilometers (RPK) have exponentially grown since 1950. For flying to become a more regular activity a whole set of historical developments in the airline industry had to happen.
Liberalization of air transport and signing of multilateral agreements contributed to the removal of administrative barriers that have been blocking
2 the development of air transport. The airline deregulation began in the U.S. in 1978, with the Airline Deregulation Act, and spread across other regions of the world. In 1993 the European aviation market was deregulated and more recently, in 2009, ten members of ASEAN (Association of Southeast Asian Nations) approved a multilateral open sky agreement.
As a goal of liberalization there were no more restrictions for founding companies, the airlines were free to establish new routes and free pricing. The recently-founded LCCs adopted the point-to-point system and started their operation with a unique business model (Cento, 2009). The liberalized market allowed LCCs to pick up the price-sensitive market share offering cheaper tickets (Pels, 2008). Therefore these deregulations encouraged the creation of new carriers, particularly those following a low cost strategy.
The LCC concept was pioneered by Pacific South West and copied in 1973 by Southwest Airlines, becoming this way the oldest LCC still in activity and consequently a business model followed by dozens of new airlines. In 1995, the LCC concept arrived to Europe with the adoption of that model by Ryanair (Decker, 2004).
With the generalization of flying, more and more passengers prefer LCCs over others in order to save considerable amounts of money. Flying low-cost is not restricted to the leisure sector, since even businessmen are targeted (Mason, 2001). It is in this context that LCCs are playing a growing influence in the airline industry.
As we will see later, Southwest Airlines, Ryanair, JetBlue Airways, easyJet and Gol lead the ranking of the most successful LCCs. Together with other big LCCs, they are nowadays crucial in the airline industry, and their success indicates that customers seem to be happy with their existence. For instance, the leaders of both domestic and international travels by number of passengers are LCCs.
In that sense, this paper deals with a current hot topic and is surely relevant as part of the study of this phenomenon of success which are the LCCs. The paper will let us understand what strategies are being taken by LCCs’ managers towards aircraft leasing.
3 Further, the use of aircraft leasing throughout the 125 existing LCCs will be analyzed. We will observe which variables show higher correlation with use of leasing and which ones explain it more accurately. Variables such as fleet size, average fleet age, on-time performance, profit margin and debt ratio will be analyzed. Comparisons with full service carriers (FSC) industry will be made throughout the paper.
The upcoming section is destined to literature review on the important topics to this paper. Here, concepts will be explored and the hypotheses for our research will be shown. Methodologies and ways of conducting the research are describing in the following section. Afterwards, chapter 4 is where the results on the research topic will be displayed, together with an analysis on them. This section also includes an overview as well as forecasts for the leasing market, which are followed by the concluding thoughts.
4
CHAPTER 2: LITERATURE REVIEW AND HYPOTHESES
DEVELOPMENT
2.1. Low-cost carriers’ features
Sometimes common knowledge misunderstands the concept of LCC, connecting an airline that offers cheap flights to an LCC. This point of view is only one-sided thus it is important to explore the whole concept.
Gábor (2010) provides a thorough description of the LCC concept. The LCC is defined as an airline designed to have a competitive advantage in terms of costs over the FSC. An LCC relies on a simple firm organization and logistic principles. In contrast to traditional carriers, LCCs offer connections from secondary airports, i.e., smaller airports which are less expensive in terms of landing tax and handling fee. In addition, LCCs avoid airport congestion, which causes costly delays at hubs. By choosing secondary airports, LCCs can achieve fast turnarounds (20-30 minutes) and pay less for leasing airport facilities. Low airport lease rates and gate costs also contribute to the lower cost structure of LCCs. The fleet generally includes one type of aircraft that operates more hours a day comparing to FSCs in order to maximize the utilization on a daily basis. Furthermore, the LCC product is much less differentiated (extra services, when available, are charged) and distribution is as simple as possible, by making use of electronic tickets and Internet direct sales. This option was something impossible in the past, so Internet represented a catalyst for the spread of LCCs. The lower cost structure can be quantified by aggregating the cost savings of point-to-point networks, savings from not providing numerous add-on services and wage savings (LCCs have less employees per ASK - Available Seat Kilometer - and these have lower wages).
Dobruszkes (2006) gives a summary about how LCCs operate. These companies have the strategy to increase output and productivity. Besides the lower costs stated above, LCCs achieve density economies by maximizing flying time. In 2004, Ryanair, easyJet or Norwegian airplanes have flown 11 hours/day on average, against 9.2 for British Airways or 7.7 for Brussels Airlines. Also, LCCs show better occupation rates: the low prices ensure good load factors to the airlines which make the most of a demand-adapted network. Another aspect referring to the working methods are the incremental
5 revenues: LCCs have set up reservation centers via Premium Rate Services from which the airlines profit. They offer direct or indirect services such as car rentals or hotel reservation. Finally, they rent advertising possibilities on board or on Internet sites.
Doganis (2006), after deducting all the cost reductions that an LCC achieves relatively to an FSC, estimated that unit costs for LCCs are 51% below that of FSCs. Higher seating density clearly represents the most relevant of all the cost advantages that LCCs possess. (See Appendix II)
Trubbach (2013) studied that leading LCCs with enough funds to cover the acquisition costs of newly built aircraft mostly are using their aircraft for a few years before selling them again given they originally got major discounts by the manufacturers. This allows them to operate at the lowest possible operating costs. Most LCCs do not have the financial resources though and are often not yet able to execute a similar fleet strategy when they start-up. They have to buy or lease second-hand aircraft. This obviously generally leads to higher operation costs compared with carriers with brand-new fleets. In some exceptional circumstances, airlines with older fleets can operate more efficiently than those with newer fleets because of average sector lengths and fleet utilization. But these carriers often are more hybrid and leisure carrier than LCCs. As the LCC sector continues to grow, smaller carriers with older fleets will be at a disadvantage. The competition, which gets tougher and tougher each year, will squeeze smaller carriers out of the markets. According to the author, large LCCs like Ryanair will dominate the market, which in addition to their cost savings in aircraft costs also have other cost advantages (larger and unique fleet allows lower training and maintenance costs as well as purchasing aircraft in bulk). Still it will be no death warrant to be a small carrier, but the times where the world had many small LCCs are definitely over, in the author’s opinion.
Recently, with the economic crisis, Vidovic, Štimac, and Vince (2013) studied whether LCCs changed their business model, becoming hybrid carriers and concluded that these airlines started moving towards that direction. They started offering seat reservation, audio and video entertainment, loyalty programs or transfer flights, among others. Other aspects like transportation of passengers and cargo on the same flight,
6 introduction of long-haul flights or cooperation with travel agencies also help support this argument. In addition, the study considers that differences between original LCCs and FSCs will become smaller and smaller.
A survey by Sarker, Hossan, and Zaman (2012) found out that industry specialists and consumers both believe that LCCs have benefited the industry by providing low fares and made air travel affordable. Industry specialists believe therefore that LCCs should revolve around the LCC basic model rather than transforming into FSC. The research also recommends that LCCs should formulate cost differentiation strategy for future growth and sustainability as well as identifying new sources of ancillary revenue or setting up innovative student promotional offers for student customers as they extensively use LCCs owing to their budget control issues.
2.2. Low-cost carriers’ performance
Air transport has always been considered as a very special sector in the international context. It has been a dominant factor in the process of globalization. Market deregulation and open skies agreement contributed for its growth. In particular, deregulation nurtured the growth of LCCs in the domestic market (Hannon, 2009).
CAPA Centre for Aviation displays the exact data about LCC penetration, measured by seat capacity. (See Appendix III) LCCs now account for around 26.2% of global capacity. In 2001 the penetration was only 8% but a continuous growth of 227% in only 11 years’ time gave relevance to the low-cost sector within the global airline industry. The same source also provides the share of LCC in different geographies. (See Appendix IV) It is observable two different types of influence of LCCs. In West Europe, South-East Asia, Latin America and North America, the influence is high (30% to 38%), while in Africa, Middle East, North-East Asia and East Europe, the influence is low (3% to 12%). Consequently there are plenty of opportunities for LCCs to grow their influence in the last group. On the other hand, West Europe represents the biggest increase since 2001 and is now the region with the highest share.
Now we will look at the biggest LCCs and observe their capacity growth between 2011 and 2012. In order to measure the size of the airlines Available Seat Kilometers (ASK) per week will be used:
7 ASK = Available seats x Kilometers flown by the seat
The ranking provided by CAPA Centre for Aviation (source: Innovata) determines the 25 biggest LCCs in terms of ASK. (See Appendix V) On the top of the table comes the reference airline of the sector, Southwest Airlines, which remains comfortable in the lead of the ranking with 1.8 billion ASK ahead of their pursuer, the Irish-based airline Ryanair. Southwest Airlines accounted for an annual growth of 7.3% in 2012, while Ryanair shows a similar, but negative change. The latter sees its position threatened by both JetBlue Airways and easyJet that show a slight increase and come in third and fourth places respectively. The Brazilian airline GOL saw its capacity decrease 9.3%, but still enough to retain the fifth position. The two following places are occupied by two LCC that showed relevant progresses on their ASK: the Indonesian Lion Air and the Australian-based Jetstar, overtaking AirTran Airways and Westjet. Other annual growths above 10% come a bit from everywhere: United States, Mexico, India, Malaysia, United Arab Emirates, Spain and Norway.
Even though the top-25 LCCs achieved a relevant ASK growth of 5.9% last year, the truth is that the low-cost sector decreased 0.3%. These figures show the existing disparity within LCCs, where bigger carriers are doing well in general (from the top-25 only 6 showed negative annual change), while smaller carriers seem to be struggling. Therefore smaller carriers are pulling the LCCs’ performance downwards, especially when we compare to the average growth from all the aviation industry (3.6%).
Furthermore, only 8 LCCs perform amongst the world’s top-50 airlines, measured by ASK, and only 2 amongst the top-25. This shows that, despite of the several advancements done in the low-cost sector, the airline industry still offers good opportunities for LCCs to grow and to steal customers from FSCs.
As LCCs operate generally operate short-haul flights, it is important to take a look at another ranking, this time measured by number of passengers carried. (See Appendix VI) Here, LCCs occupy the leading positions in both domestic and international travel: Southwest for domestic flights and Ryanair for international flights, the American LCC being the overall leader with more than 110 million passengers carried during 2012. These rankings demonstrate the importance of LCCs nowadays and again show that even though the sector
8 is not homogeneous concerning success, there are a few airlines doing very well.
Finally, Hüschelrath and Müller (2011) found that FSCs and LCCs each entered about 1,200 non-stop routes between 1996 and 2009. While entry activity of FSCs was much more pronounced between 1996 and 2003, LCCs have entered more markets per year since 2004. On the other hand, exit activity is much more pronounced for FSCs with in sum about 2,250 route exits, compared to only 391 exits on the side of the LCCs.
2.3. Operating and finance lease
International Accounting Standard (IAS) 17 dating from 2010 states that “a lease is an agreement whereby the lessor conveys to the lessee, in return for a payment or series of payments, the right to use an asset for an agreed period of time”. Leasing agreements can be divided into two major categories, finance leases and operating leases. Finance lease is defined by the IAS 17 as “a lease that transfers substantially all the risks and rewards incidental to ownership of an asset. Title may or may not eventually be transferred”. Ownership risks and costs include accountability for loss, wear and tear, and obsolescence, whereas ownership benefits encompasses the right of use, gains from asset value appreciation and possession of the property title. On the contrary, as lessors retain ownership, operating leases separate the legal ownership of an asset from its economic use and so the asset is an inherent form of collateral in that type of contracts (Graham, Lemmon, and Schallheim, 1998; Sharpe and Nguyen, 1995).
There is another important difference between these two types of leasing, which is the fact that operating lease is not capitalized by the lessee, meaning that it does not appear on the balance sheet of the companies, i.e., off-balance sheet financing (though the finance obligations associated continue to be present). For this reason, and according to Gritta, Lippman, and Chow (1994), between 1969 and 1991 the percentage of operating leases in total leases in the US increased from 13% to 82%. Other benefits such as no residual value risk or lower financial outlay requirements help explain this growth.
9
2.4. Leasing as debt substitute or complement
Hypothesis 1: Leasing is negatively correlated with debt ratio
The relationship between lease and debt has generated a lot of discussion. Many authors go against the traditional finance theory and raised the argument that leases complement debt, which is the case of Eisfeldt and Rampini (2009) who proved that, due to the ability to repossess the asset, the debt capacity of leasing is higher than the capacity of security lending.
Likewise, Lewis and Schallheim (1992) show that leasing can increase a firm's debt capacity by selling excess non-debt tax shields. They conclude that leasing and borrowing can be complementary within the firm's optimal capital structure.
Consistent with these predictions, Ang and Peterson (1984) find leasing to be positively related to the firm's debt ratio: lessee firms used more long-term debt than did non-leasing firms.
Yan (2006) presents a model to incorporate different theories on the substitutability and complementarity between leases and debt. The findings suggest that leases and debt are substitutes instead of complements. The paper also investigates the variation in the substitutability between leases and debt, and finds that in those firms with more growth options or larger marginal tax rates, or in those firms paying no dividends, the substitutability is more pronounced, i.e., the cost of new debt increases to a larger degree with extra leases.
Oum, Zhang, and Zhang (2000) concluded that the debt capacity of the firm is not increased by operating leases, thus in such cases debt and leasing seem to be substitutes. Marston and Harris (1988) also found empirical evidence of substitutability between leases and debt by focusing on changes in lease ratios rather than on levels. Results from Deloof, Lagaert, and Verschueren (2007) too provide strong support for the substitution hypothesis: more debt is associated with fewer leases.
Beattie, Goodacre, and Thomson (2000) determined that leasing and debt are partial substitutes, with £1 of leasing displacing approximately £0.23
10 of non-lease debt, on average, consistent with the argument that lessors bear some risks which are not inherent in debt contracts.
Erickson and Trevino (1994), this time through an exclusive analysis of the airline industry, achieved results indicating that leasing is significantly and negatively related to the current debt to asset ratio. In other words, leases and debt are substitutes.
It is difficult to decide for one of the sides since both arguments seem reasonable but one aspect is true for any case: as operating lease hides future obligations, companies present lower leverage ratios, which usually leads to an increase in the share price. The traditional finance theory and the last paper (since it studied about the airline sector) were taken into account. This way, we are going to test the hypothesis of substitutability between leasing and debt. According to the literature, we are going to observe the effect of leasing on the debt ratio of an airline.
2.5. Aircraft leasing
Regarding the topic of aircraft leasing, which is central in this paper, there is relevant literature describing its patterns.
Gritta and Lippman (2010) give an historical perspective of the evolution of the aircraft leasing since 1960s. Back then, many carriers employed finance lease as an alternative source of funds to acquire aircraft. It had a major advantage over purchasing the aircraft, since it was off-balance sheet financing: the obligations under this type of lease appeared only in the footnotes to carrier balance sheets. Little use was made of short-term lease agreements during this period. The situation has changed radically over the past three decades. Since 1976 finance lease are required to be reported as both a leasehold asset and a long-term liability. In response, the carriers substantially altered the way they finance airplanes. Airlines began to use more shorter-term operating leases, which are not reported on companies’ balance sheets. By strategically violating the criteria for capital leases, the airlines once again pushed the leases off the balance sheet.
Mancilla (2010) reviews aircraft asset management strategies and programs implemented by airlines in today’s difficult business environment. Aircraft asset management tools could be an important factor to be taken into
11 account as part of the airline strategy and management decisions, notably during downturns. Indeed, empirical data suggests that airlines changed their approach during the recent economic crisis. The author found a decrease in demand for leased aircraft which supports the idea that operating leases are a key management tool during market downturn because it permits airlines to decrease capacity without bearing the aircraft asset value risk. This decrease was more notorious in the most affected regions by economic crisis such as Europe and North America. Conversely, in emerging markets such as Asia Pacific (notably China) and Latin America airlines fleet grew and the number of aircraft under operating lease either increased or did not change.
Oum, Zhang, and Zhang (2000) performed a study about the optimal demand for operating lease of aircraft, an instrument which gives the airlines flexibility in capacity management. However, airlines pay a risk premium to the leasing companies for bearing part of the risks. Thus, the airlines face a trade-off between flexibility of capacity and higher costs. This paper develops a model for the airlines to determine their optimal mix of leased and owned capacity, taking into consideration that the demand for air transportation is uncertain and cyclical. Empirical results based on the model suggested that the optimal demand by 23 major airlines in the world would range between 40% and 60% of their total fleet, for the reasonable range of premiums of operating lease. For leasing companies, this indicates huge potential of the market given strong forecast for the growth of air transportation in the next decade.
Clark (2007) explains a relevant advantage of aircraft lease against a loan. Under a loan structure the repayments are made with constant principal and declining interest, whereas under a lease structure the repayments are of a mortgage style, with constant payments. The disadvantage of the loan structure is that it places a burden on the airline cash flow in the early years, thus the constant payment stream of the lease structure is often the preferred option.
Gavazza (2010) empirically analyzed how the liquidity of the asset - in this case, aircraft - affects whether or not carriers lease the aircraft they operate, the optimal maturity of lease contracts and the markups of lease rates over aircraft prices. The evidence suggests that more-liquid aircraft are
12 more likely to be leased, particularly through operating leases; have shorter operating leases; have longer capital leases; and command lower markups of operating lease rates.
In a different paper, Gavazza (2010) constructed a dynamic model of transactions in used capital to understand the role of leasing when trading is subject to frictions. The model determined that leased assets trade more frequently and produce more output than owned assets, for two reasons. First, high-volatility firms are more likely to lease than low-volatility firms, since they expect to adjust their capacity more frequently. Second, ownership’s larger transaction costs widen owners’ inaction bands relative to lessees’. The author also found that leased aircraft have holding durations 38% shorter and fly 6.5% more hours than owned aircraft.
Gilligan (2004) found an inverse relationship between depreciation and trading volume for less reliable brands of used business aircraft. Conversely, the author found an increase in the direct relationship between depreciation and trading volume for aircraft models with relatively high lease rates. Together these findings suggest that adverse selection is a prominent feature of the market for contemporary used business aircraft and that leasing mitigates the consequences of asymmetric information about the quality of used durable goods.
Hypothesis 2: Leasing is negatively correlated with fleet size
Erickson and Trevino (1994) used the airline industry in order to examine what determines the importance of leasing in a company. The paper found that operating leases are used by smaller firms, non-tax paying firms and firms experiencing more rapid sales growth.
Eisfeldt and Rampini (2009) came to the conclusion that the fraction of capital that firms lease is significantly related to firm size, decreasing from 46% for small firms to 11% for large firms.
Sharpe and Nguyen (1995) also found that the use of operating leases is negatively related to firm size, since firm size is likely correlated with financial, but also other, factors that influence the lease-versus-buy decision. The authors, who took turnover as measure of size, claimed that more asymmetric information lies between the firms and its debt holders in case of smaller than
13 do larger firms. Resulting in asset substitution problem for smaller firms more than larger firms and ultimately tends the smaller firms to lease more assets.
Adams and Hardwick (1998) further added that smaller firms may use certain assets only partially and may find these assets un-useful in future and therefore leasing could compensate the acquiring and disposing costs of those assets for smaller firms. Investigation explored a controversial relationship of leasing and size of firm as a deterministic variable.
Lasfer and Levis (1998) too reported a negative relationship between firm size and leasing while suggesting that smaller firms are much more in need for leasing than do larger firms.
All these papers head towards the same direction, leading us to test a negative correlation between use of leasing and airline size, measured by total fleet. In our tests it is going to be determined how the size of the airline affects its use of leasing.
Hypothesis 3: Leasing is negatively correlated with average fleet age Gilligan (2004) analyzed the relationship between leasing percentage and age of aircraft and observed that the leasing percentage is fairly constant in the data over the age of aircraft.
Later on, Gavazza (2010) empirically showed that leased aircraft are, on average, about 1.5 years younger than owned aircraft.
This way, it is going to be tested whether airlines with older fleets own a bigger proportion of their aircraft than airlines with younger fleet. The rationale is that leasing activity is more pronounced in young aircraft, i.e., the decision between owning or leasing an airplane is explained by its age. We hypothesize that airlines with older aircraft either own them for a long time, without being active in the leasing market recently, or purchase old, second-hand aircraft at much lower rates. On the other second-hand, airlines with younger fleet are thought to be more active concerning aircraft replacements, thus making a higher number of leasing agreements.
14
2.6. Financial performance
A good financial performance is sought by every airline. Although this industry does not historically give the highest returns, this is always the goal of a company, and aircraft leasing should be adjusted in order to meet that target. Below some literature is presented concerning airlines’ financial performance.
Feng and Wang (2000) show the importance of using financial ratios to make a complete, unbiased performance evaluation of an airline. The study divided total performance into three major departments of an airline: production, marketing and management. The conclusions revealed that transportation indicators are more suitable to measure the production efficiency than financial ratios and mixed indicators, and the execution efficiency is best measured by financial ratios.
Dempsey (2008) researched on financial performance of the airline industry post-deregulation. Since then there has been more volatility, deeper troughs in the market cycle, prolonged losses and widespread bankruptcies. Industry net profit margins averaged 2.8% before deregulation and fell to a -0.6% under deregulation. Profitability and returns on investment have become both more volatile and significantly worse, since deregulation.
Hüschelrath and Müller (2011) analyzed the differences in financial performance between carriers in the U.S. Between 2000 and 2009, FSCs realized an operating loss of $35,418 million with only two years (2000 and 2007) displaying an operating profit. In the same time frame, LCCs earned in sum $8,038 million, with Southwest Airlines contributing the largest share of $5,570 million. Curiously, while none of the FSCs managed to realize a net operating profit in the period from 2000 to 2009, all LCCs can report such a net operating profit.
Hypothesis 4: Leasing is negatively correlated with profit margin
Ang and Peterson (1984), besides finding that leases and debt are complements, concluded that profitability is a significant negative explanatory factor for the level of leasing. This result is consistent with Kare and Herbst’s (1990) survey evidence that more profitable firms, having easier access to low cost debt, prefer debt to leasing.
15 Likewise, empirical findings from Deloof, Lagaert, and Verschueren (2007) indicate that leasing is negatively correlated with profitability: firms with low profits and high growth need more external financing and will therefore have higher fixed-claim financing.
Within airline industry, Erickson and Trevino (1994) expected there would be negative correlation. The authors criticized that previous leasing literature ignores the effects of profitability on leasing which results in model misspecification. After performing the tests, lease ratios were found to be statistically unrelated to profitability.
Gritta and Lynagh (1973) show that airline companies that experience financial difficulties are the ones that show higher rates of aircraft leasing. For these companies, the paper suggests that leasing may be the solution today but it also may be tomorrow’s problem. Airlines appear to be damaging their financial structure, by carrying long-term obligations of leasing arrangements which accounting authorizes to hide.
Taking these papers into account, we will confirm if less profitable airlines show higher indices of aircraft leasing, or in other words, if profitability explains use of leasing.
2.7. Service quality
Another aspect that this paper covers is the service quality provided by airlines. There is some interesting literature regarding this topic, which is extremely important for the airlines’ success.
There are many models to evaluate service quality, being SERVQUAL one of the most used. This model has five main dimensions to measure service quality: tangibles, reliability, responsiveness, assurance, and empathy (Zeithaml, Berry, and Parasuraman, 1996). Many scholars have created other measures with various quality dimensions. Gourdin (1988) categorized airline service quality in terms of three items: safety, timelines and price. Truitt and Haynes (1994) used the processing of luggage, seat cleanliness, and the check-in process, the convenience of transit, timelcheck-iness, and handlcheck-ing of customer complaints as the standards of service quality.
16 Regardless of which model to use, Parasuraman, Zeithaml, and Berry (1988) showed that customer satisfaction with a service can be defined by comparing perception of service received with expectations of service desired. This can be particularly helpful to LCCs due to possible lower expectations of customers on them.
Bowen and Headley (2013) claim on-time performance to be the greatest determinant of service quality. For them this criterion is the most important followed by denied boarding, mishandled baggage and customer complaints. The report analyzed 14 U.S. airlines, and last year‘s top-3 is remarkably constituted only by LCCs, proving the idea that LCCs manage to outperform the traditional carriers in terms of service quality. The study also concluded that the industry performance for all four measurements improved substantially in 2008 and 2009, remaining stable since then.
Bhat (1995) considers that on-time performance is of significant concern to an airline traveler. The author did a multivariate analysis of airline flight delays and detected that the likelihood of a flight being delayed increases with airline size and operating revenue per employee, with statistical significance. The fact that this kind of airlines operates in congested airports seem to explain these findings. However, this is not an issue that LCCs face as they avoid such hubs.
Kim and Lee (2011) studied the Korean domestic LCC market and achieved results indicating that the significant dimensions of customer satisfaction are tangibles, defined as the physical facilities of the aircraft, and responsiveness, related to the willingness to help passengers solve service problems. In addition, the study confirms the significant consequences of customer satisfaction including word-of-mouth communication, purchase intentions, and complaining behavior. On-time performance was found to be an important factor for LCCs’ customer satisfaction. It ranked fifth (after employee appearance, accuracy, helpfulness and courteousness), among 17 different factors.
Mazzeo (2003) provided another interesting analysis on service quality in U.S. airline industry, particularly its relation with competition. The author indicates that both the prevalence and duration of flight delays are
17 significantly greater on routes where only one airline provides direct service, thus additional competition brings better on-time performance.
Hypothesis 5: Leasing is negatively correlated with on-time performance From the existing literature we conclude that on-time performance is a key measure to determine an airline service quality. It was not found any literature trying to relate the use of leasing with service quality, perhaps because these variables do not directly influence each other. Although we are going to test this correlation, we understand that it could be spurious since, in between leasing and service quality, profitability can be playing the determinant role. Continuous investment in service quality, which is not always cost-related, may result not only in direct improvements in service quality but also increase the company’s profits through a competitive advantage (Reichheld and Sasser, 1990). This way, in our calculations we will test if airlines that provide better service quality show higher profitability levels, and consequently (according to hypothesis 4) make less use of leasing. This way we hypothesize that leasing shows a negative correlation with service quality, which in our study comes as on-time performance.
18
CHAPTER 3: METHODOLOGY
This chapter presents a detailed description of the methods used to gauge the main research question in the present study.
3.1. The industry
We will start by discussing the identification process of the LCCs. Although we use the LCC expression for a homogenous category researches verify that there is no consistent low-cost strategy (Pels, 2008). The business strategies used by LCCs differ from each other in what condition they were formed (Francis et al., 2006).
Due to this, several variations of business models were set up inside the low-cost category. Five ways of developing the low-cost business model were identified (Francis et al., 2006):
Southwest Airlines copy-cats
This category consists of the airlines that were founded from scratch by independent entrepreneurs. These carriers stand closest to the Southwest model (Ryanair, easyJet).
Subsidiaries
Typically those LCCs presenting this category, which are subsidiaries of national carriers, and they were established to gain market share from the already existing LCCs (Iberia with Iberia Express; Qantas with Jetstar Airways).
Diversified charter carriers
These are low-cost subsidiaries founded by charter carriers to provide scheduled LCC flights (TUIfly).
Cost cutters
These airlines are usually considered as hybrid carriers. The members of this group are such FSCs which are trying to imitate the LCCs by cutting the operational costs. They continue to operate to a hub-and-spoke system while attempting to rationalize their fleet and stop in-flight catering (Aer Lingus).
19 Flights in this category can not be considered as real LCCs due to the fact that they can only maintain their low prices with state subsidy (Emirates).
This paper only considers the pure LCCs. Therefore only airlines belonging to the first three business models are taken into account. Cost cutters are airlines that usually represent a separate business strategy that is neither FSC nor LCC. These airlines are normally identified as the new hybrid carriers. In addition, some LCCs are also becoming hybrid carriers, as mentioned by Vidovic, Štimac, and Vince (2013). For that reason it was hard to determine whether an airline is a LCC or a hybrid career since the border between each model is very thin and there are many airlines having features from more than one.
After researching about the features of the airlines one by one, we came to a final list of LCCs, displayed in Table 1. According to our definition, as of October 31st, 2013 there are a total of 125 LCCs in the world.
Another issue that demanded detailed research was the fact that mergers, acquisitions, discontinuations and bankruptcies are a constant in the airline industry. Between 2007 and 2012, 136 airlines ceased operations and the industry witnessed three major airline bankruptcies and re-organizations with Japan Airlines, AMR and Kingfisher (Allen, 2013). It is likely therefore that tomorrow this list is not accurate, either by the appearance/disappearance of an LCC or by the change on its business model.
It is worth mentioning the reason why some airlines do not participate in the study. Airberlin comes in many studies, papers and databases as LCC or hybrid, however in its annual report, the German airline assumes a clear identity of FSC and for that reason will not join our study. Virgin Australia, after several years operating as an LCC, improved its services to become a (self-described) "New World Carrier": essentially a business model which offers the passenger the choice of purchasing a ticket with aspects of the "no frills" approach of LCCs or paying a little more to receive services more in line with FSCs. Airbrussels is an airline that operates as FSC, but started recently offering travels at a lower price, with fewer extras. Finally, Aer Lingus, whose characteristics are presented above and whose annual report clearly describes the carrier as hybrid, does not come in the paper either.
20
Table 1: List of LCCs
Europe JetBlue Airways UNITED STATES PAL Express PHILIPPINES
Belle Air ALBANIA Southwest Airlines UNITED STATES Philippines AirAsia PHILIPPINES Intersky AUSTRIA Spirit Airlines UNITED STATES Tigerair Philippines PHILIPPINES NIKI AUSTRIA Sun Country Airlines UNITED STATES Jetstar Asia Airways SINGAPORE
Jetairfly BELGIUM Virgin America UNITED STATES Scoot SINGAPORE
SmartWings CZECH REP. South America Tigerair SINGAPORE
Flybe Finland FINLAND Amaszonas BOLIVIA Air Busan SOUTH KOREA
Transavia France FRANCE Azul Brazilian Airlines BRAZIL Eastar Jet SOUTH KOREA
Germanwings GERMANY GOL BRAZIL Jeju Air SOUTH KOREA
TUIfly GERMANY PAL Airlines CHILE Jin Air SOUTH KOREA
Astra Airlines GREECE Sky Airline CHILE T'Way Air SOUTH KOREA
Wizz Air HUNGARY Easyfly COLOMBIA Mihin Lanka SRI LANKA
WOW Air ICELAND VivaColombia COLOMBIA City Airways THAILAND
Ryanair IRELAND Peruvian Airlines PERU Nok Air THAILAND
Air One ITALY Star Peru PERU Nok Mini THAILAND
Belle Air Europe ITALY Asia Pacific Orient Thai Airlines THAILAND
Blu-Express ITALY Jetstar Airways AUSTRALIA Thai AirAsia THAILAND
Meridiana ITALY Tigerair Australia AUSTRALIA Jetstar Pacific VIETNAM
AirBaltic LATVIA United Airways BANGLADESH VietJet Air VIETNAM
Corendon Dutch Airlines NETHERLANDS Juneyao Airlines CHINA Middle East
Transavia NETHERLANDS Lucky Air CHINA Arkia ISRAEL
Norwegian Air Shuttle NORWAY Spring Airlines CHINA Israir ISRAEL
Blue Air ROMANIA Dragonair HONG KONG Jazeera Airways KUWAIT
Iberia Express SPAIN GoAir INDIA AirBlue PAKISTAN
Volotea SPAIN IndiGo INDIA PIA PAKISTAN
Vueling SPAIN JetKonnect INDIA Nas Air SAUDI ARABIA
easyJet Switzerland SWITZERLAND SpiceJet INDIA Anadolu Jet TURKEY
Helvetic Airways SWITZERLAND Citilink INDONESIA Corendon TURKEY
Wizz Air Ukraine UKRAINE Indonesia AirAsia INDONESIA Onur Air TURKEY
EasyJet UK Lion Air INDONESIA Pegasus TURKEY
Flybe UK Tigerair Mandala INDONESIA SunExpress TURKEY
Jet2 UK Air Do JAPAN Air Arabia UAE
Monarch Airlines UK JAL Express JAPAN Flydubai UAE
North America Jetstar Japan JAPAN RAK Airways UAE
Air Transat CANADA Peach JAPAN Africa
Sunwing Airlines CANADA Skymark Airlines JAPAN Air Arabia Egypt EGYPT
Westjet CANADA Solaseed Air JAPAN Fly 540 KENYA
Interjet MEXICO AirAsia MALAYSIA Air Arabia Maroc MOROCCO
Magnicharters MEXICO AirAsia X MALAYSIA Dana Air NIGERIA
VivaAerobus MEXICO Firefly MALAYSIA Kulula.com SOUTH AFRICA
Volaris MEXICO Malindo Air MALAYSIA Mango SOUTH AFRICA
AirTran Airways UNITED STATES Golden Myanmar MYANMAR Fastjet TANZANIA
Allegiant Air UNITED STATES AirAsia Zest PHILIPPINES Nouvelair TUNISIA
21
3.2. Data collection
In order to collect the data it was used secondary research. Airlines’ annual reports and online databases were the means through which information was collected. The most important online databases were PlaneSpotters and FlightStats.
All the information about the size of the fleet, age of the fleet, leased and owned aircraft, and on-time performance are updated as of October 31st, 2013. Remaining information was collected from the last available annual report of each airline company.
Unfortunately for research purposes, not all the airlines released annual reports. This fact limited the data collection in a way that sample size (N) became distinct between variables. In addition, another reason why N varies is because several annual reports consolidate the figures from more than one subsidiary (e.g. Air Arabia Group owns Air Arabia, Air Arabia Maroc and Air Arabia Egypt). This causes that in some variables subsidiaries are treated separately while in others are treated together. A final limitation was the case of those LCCs that are subsidiaries of an FSC or of an unrelated entity to aviation. For some of them individual financial data is not provided, which again imply a variation of N.
3.3. The measures
According to the hypotheses created, there is one variable that is present in every correlation test, which is use of leasing by LCCs. A total of five variables will be tested against use of leasing. Below, follows an explanation on these variables:
Use of leasing
This measure gives the percentage of leased aircraft in the total fleet, in other words, it is the leasing penetration rate in each airline. Here, both operating and finance leases are included. Mention that neither stored aircraft nor ordered ones count. Moreover, aircraft sub-leased to another airline only count in the airline that act as lessee in order to avoid duplication. The data was collected from PlaneSpotters in accordance to official annual reports.
22 The total number of aircraft that an LCC possesses gives an accurate measure in order to determine the size of the airlines. To compare the size of the airlines this is believed to be the most adequate way of doing it, since airlines belong to different countries and the use of different currencies would raise issues when performing comparisons. Mention that neither stored aircraft nor ordered ones count. Moreover, aircraft sub-leased to another airline only count in the airline that act as lessee in order to avoid duplication. The data was collected from PlaneSpotters in accordance to official annual reports.
Average fleet age
This measure defines how old an airline fleet is, on average, and is also comparable between companies. This is the best way to assess the modernity of an airline. Mention that neither stored aircraft nor ordered ones count. Moreover, aircraft sub-leased to another airline only count in the airline that act as lessee in order to avoid duplication. The data was collected from PlaneSpotters in accordance to official annual reports.
On-time performance
It determines the historical percentage of on-time arrivals of an airline. Literature shows this measurement is considered relevant as for the assessment of an airline service quality. The data was taken from FlightStats, an online database which provided results for 80% of the existing LCCs.
Profit margin
This financial indicator is the ratio between net income and revenues. It can be interpreted as the percentage of selling price that turned into profit. Thus profit margin is an important measure of profitability which evaluates the financial performance of a company.
Debt ratio
The debt ratio is defined as the ratio of total debt to total assets, expressed in percentage, i.e., the proportion of a company's assets that are provided via debt. This is a financial measurement that assesses the financial health of an airline, but also assesses its risk profile. Here it was used the accounting figures, where operating leasing commitments are not included.
23 After the correlations and regressions analyses this paper includes other unique findings about the leasing profile of LCC. Namely:
Leasing penetration in LCCs and industry-wide
This statistic measures the average aircraft leasing rate in the LCC sector, which will be further compared to the aviation industry average, given by Ascend, a leading provider of expert advisory and valuations services to the global aviation industry.
Leasing by regions
Here the leasing penetration will be split by regions and again a comparison between LCCs and the global aviation industry (given by Ascend) is going to be done. Regions are split as follows: Europe, North America, South America, Asia Pacific, Middle East and Africa.
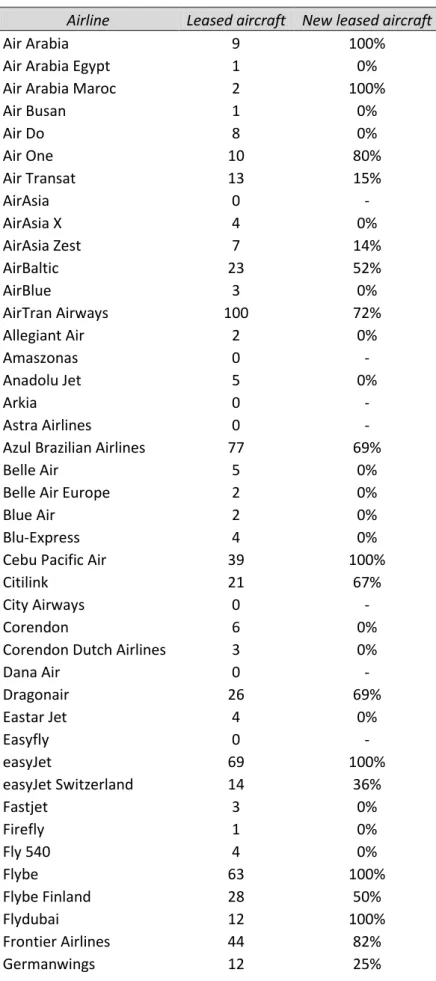
Proportion of newly manufactured leased aircraft
The aim is to find out, between all the airplanes leased by LCCs, the percentage of them that are new at the moment they join the lessee’s fleet. The data was collected from PlaneSpotters in accordance to official annual reports.
Proportion of operating and finance leases
According to the data available in LCCs’ annual reports (and that explicitly mentions how many aircraft are being leased under each category), it will be done a calculation in order to determine the proportion of aircraft under operating and finance lease.
Relevance of leasing commitments
Collected from the data available in LCCs’ annual reports, this statistic assesses the exact relevance of financing through leasing in the airlines’ financial structure. A comparison will be made between future lease commitments and other debt commitments. Mention that the lease commitments refer to both operating and finance leases, including also spare engines and simulators leasing. The remaining debt commitments are all the debt obligations net of leasing.
3.4. Data analysis
Data analysis was done by using SPSS statistical software. Once the data had been collected, the hypothesis testing began with Pearson's
product-24 moment correlation coefficients. A table has been created, allowing us to understand the direction and significance of each correlation between the six variables in the study. Afterwards, regressions were computed in accordance to literature review and hypotheses development, allowing us to understand how much use of lease is affected/affects the other five variables in analysis.
25
CHAPTER 4: RESULTS’ ANALYSIS AND DISCUSSION
In this chapter the statistical results related to main research question will be presented as well as an analysis on them.
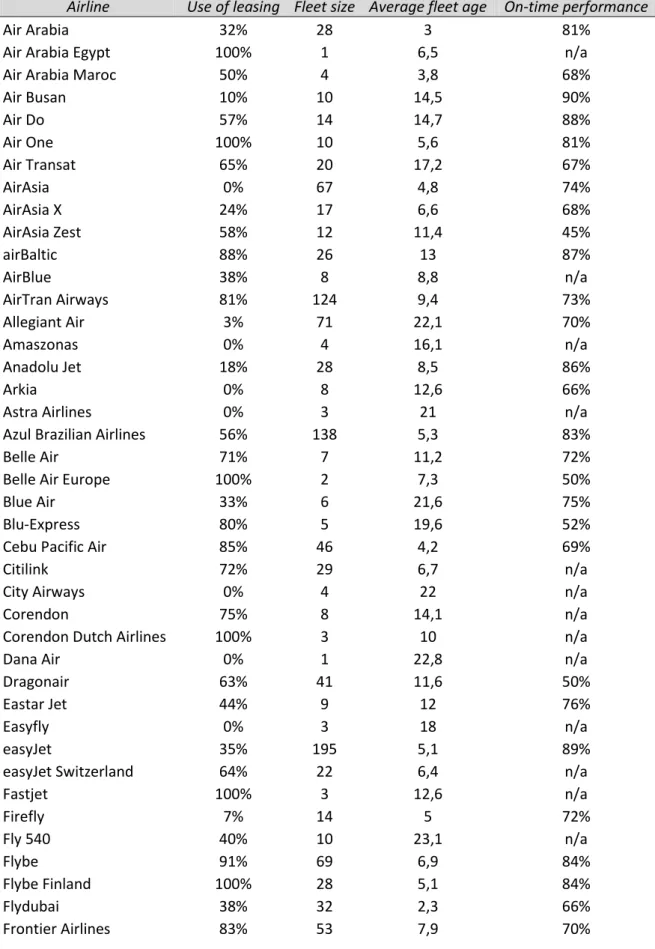
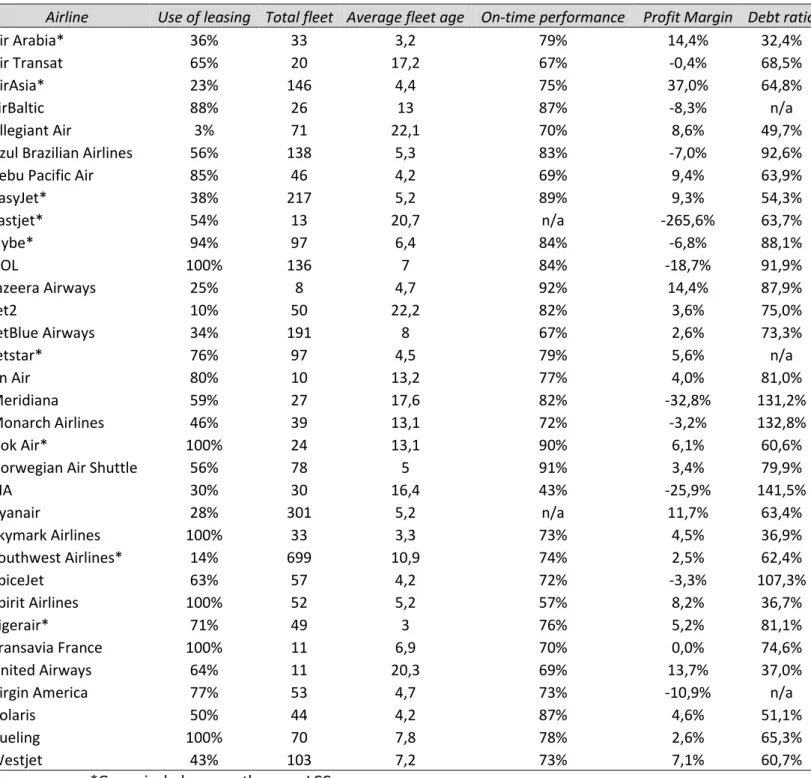
In our analysis six variables are included: use of leasing, fleet size, average fleet age, on-time performance, profit margin and debt ratio. According to the available information, we gathered data about LCCs for the six variables. (See Appendices VII and VIII)
The use of aircraft leasing in the LCC industry is the key variable in the study and this chapter is entirely destined to carefully explain its characteristics. Also in this chapter there will be a discussion about the evolution, features and challenges on the aircraft leasing market.
4.1. Descriptive statistics
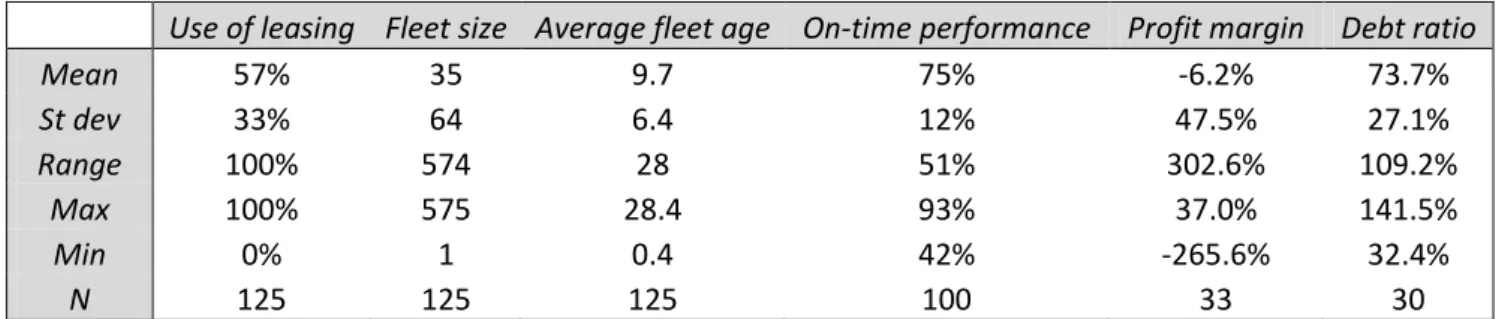
Descriptive statistics, presented in Table 2, allow us to get an initial perception on each of the variables.
Table 2: Descriptive statistics
Use of leasing Fleet size Average fleet age On-time performance Profit margin Debt ratio
Mean 57% 35 9.7 75% -6.2% 73.7% St dev 33% 64 6.4 12% 47.5% 27.1% Range 100% 574 28 51% 302.6% 109.2% Max 100% 575 28.4 93% 37.0% 141.5% Min 0% 1 0.4 42% -265.6% 32.4% N 125 125 125 100 33 30
In a brief analysis of the descriptive statistics we observe that there are LCCs whose fleet is entirely leased and others without any leased aircraft. Fleet size shows a high standard deviation. Its mean is 35 aircraft and its maximum is an impressive number of 575 aircraft from Southwest Airlines. Interestingly enough, the average fleet age varies as much as 28 years in our population, being its mean 9.7 years. On the other hand, on-time performance does not vary as much within the population. Its mean is 75% and its maximum of 93% belongs to TUIfly and Iberia Express. Relevant is the fact that the average profit margin is negative (-6.2%), meaning that on average LCCs experience loss at the end of the year. Here the range is impressively over 300%, being Air Asia the most profitable company. Regarding debt ratio,
26 Air Arabia presents the lowest and PIA the highest, with a range of 109.2% between both. On average, debt accounts for almost three fourths of the balance sheet (73.7%).
4.2. Pearson's product-moment correlation coefficients
In our five hypotheses there is a common variable which is the use of leasing in LCCs. We will test the correlation of this variable with five others: fleet size, average fleet age, on-time performance, profit margin and debt ratio. Yet all the correlations between the six variables will be displayed in order to make a full analysis and look for interesting results. That way, Table 3 was computed.
Table 3: Pearson's product-moment correlation coefficients
The correlations table demonstrates negative correlations between use of leasing and all the other five variables, going in the same directions of the hypotheses created. However, only average fleet age has a significant level of correlation (-0.321), with significance at the 0.01 level. Therefore, only one of our hypotheses was confirmed: H3. This implies that LCCs with newer fleets tend to make more use of leasing. On the other hand, old fleets have more owned aircraft, either purchased a long time ago or more recently at low values. Through the use of leasing airlines are able to renew the fleet more
27 easily, allowing them to have a younger fleet and thus improving the image and quality of the airline.
Although no significance has been found in the correlation with use of leasing, the closest variable to that was the fleet size (-0.141), hinting that airlines with a bigger fleet lease fewer aircraft, which is consistent with H2, namely if we consider the fleet size to be a proxy for the firm size.
We found that airlines with higher leasing penetration rates show worse profit margins, consistently with H4, although this correlation is very weak (-0.032). Furthermore, airlines with higher leasing penetration rates have a smaller debt ratio. However, the low correlation coefficient (-0.071) does not allow us to statistically confirm that debt and lease are substitutes in the LCC sector, though the sign of the correlation is consistent with H1, as tested by the papers reviewed in Chapter 2.
Another important assumption this paper verifies is that lower service quality explains lower profitability, which leads to higher use of leasing, even though we do not find statistical significance on these two correlations. The direct correlation between use of leasing and on-time performance is not significant either (-0.059), though the sign is again consistent with H5.
Another statistically significant correlation was found between average fleet age and profit margin. The negative correlation proves that Trubbach (2013) was right when affirming that LCCs with older fleets have a clear disadvantage on their operating costs.
As a general idea, aircraft leasing seems to be associated with smaller airlines and airlines with lower performance and quality. In addition, start-up carriers often prefer leases because they lower the capital costs for market entry. The option of leasing comes therefore as an important rescue option to all these airlines. Many times, they are credit-squeezed being unable to afford purchasing an aircraft, thus leasing embodies the chance for them to keep operating.
4.3. Regressions
After the Pearson’s correlations analysis we will proceed to the regression analysis. We are going to start with use of leasing as dependent
28 variable, since we aim to understand what causes its variations. This way, we suggest that the use of leasing by LCCs depends on the fleet size, the age of the fleet, quality of service (as measured by on time performance) and profitability of the firm. For this initial model, which can be found in Table 4, multicollinearity is not an issue in this case since we got relatively low correlations.
Table 4: Use of leasing as explained by Fleet Size and Age, On-time performance and profit margin
Dependent variable: Use of leasing N: 33 Adjusted R2: 0.039 F: 1.305
Variable Expected causality Coefficient p-value
(Constant) 0.997 0.022
Fleet size (-) -0.001 0.356
Average fleet age (-) -0.021 0.044
On-time performance (-) -0.248 0.628
Profit margin (-) -0.107 0.430
Keep in mind, that given the data availability on profit margin, we can only run this regression for 33 observations. This is likely the main reason for the low adjusted R2, meaning that this model does not describe the profile of an airline in terms of leasing strategy accurately. It was fairly expected due to the low correlations between some variables and use of leasing found in the previous chapter.
Still, the variable that showed lower p-value was average fleet age (0.044), meaning that it described the use of leasing fine. The reasoning is that older fleets have fewer leased airplanes, while younger fleets make more aircraft replacements through leasing. The remaining variables, while showing the expected negative causality too, were not significant.
Next, due to the sample size varying so much according to the different variables, we are going to test limited versions of the original regression, i.e., sets of variables will be tested alone against use of leasing.
29
Table 5: Use of leasing as explained by Fleet Size and Age, and On-time performance
Dependent variable: Use of leasing N: 100 Adjusted R2: 0.120 F: 5.497
Variable Expected causality Coefficient p-value
(Constant) 1.005 0.000
Fleet size (-) -0.001 0.057
Average fleet age (-) -.0.018 0.000
On-time performance (-) -0.284 0.289
Table 5 presents a higher N and a higher adjusted R2. In this model, fleet size and age as well as on-time performance confirmed the negative expected causality. Fleet size and age demonstrate high significance levels, thus small and younger fleets are likely to show higher leasing penetration rates.
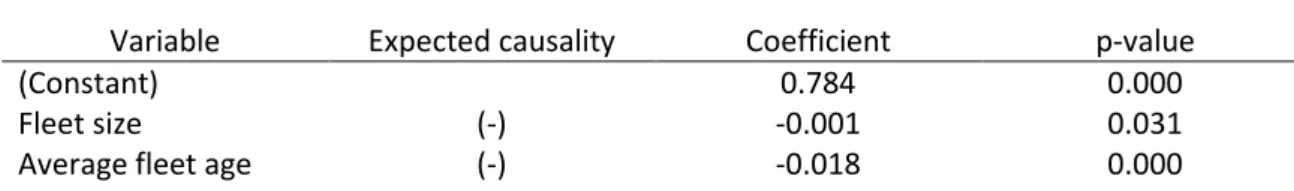
Table 6: Use of leasing as explained by Fleet Size and Age
Dependent variable: Use of leasing N: 125 Adjusted R2: 0.122 F: 9.642
Variable Expected causality Coefficient p-value
(Constant) 0.784 0.000
Fleet size (-) -0.001 0.031
Average fleet age (-) -0.018 0.000
By excluding on-time performance we are able to achieve the model, show in Table 6, with the highest possible N in our study, and a higher adjusted R2. Again the negative expected causality is confirmed in the variables of fleet age and size. Both variables give p-values under 0.05, meaning that they are statistical significant in explaining use of leasing by LCCs.
A final regression is the one that contains debt ratio as dependent variable and use of leasing as independent, as it comes in Table 7. Literature review and hypotheses development lead us to test the substitutability between debt and lease, or in other words, by using leases airlines need less debt in their capital structure.
30
Table 7: Debt ratio as explained by Use of Leasing
Dependent variable: Debt ratio N: 30 Adjusted R2: -0.083 F: 0.257
Variable Coefficient p-value
(Constant) 0.0793 0.000
Use of leasing -0.075 0.651
Fleet size 0.000 0.586
Profit Margin -0.056 0.621
Use of leasing is found to make a negative contribution of debt ratio, yet with lack of statistical significance. Once more, explanatory power is potentially explained by the small N. These results suggest substitutability between lease and debt but we are unable to confirm this hypothesis. Notice we are limiting ourselves to a small set of three independent variables, because of data availability.1
Regression results go according with those from Pearson’s correlation section, which showed that the two strongest explaining variables of use of leasing are fleet size and average fleet age, with the latter demonstrating higher significance. From the multiple regression analysis we are able to conclude that variables related to the constitution of the fleet are better in explaining the use of leasing by LCCs than performance or financial measures.
4.4. Characteristics of leasing in low-cost carriers
Still in the area of aircraft leasing there are other statistics that this paper covers and that are important on the analysis of the LCC industry.
A crucial statistic is the one that presents the average of leased airplanes from the 125 LCCs existing in the study: leased aircraft represent
1
Many authors reviewed in the Chapter 2 on this issue suggest numerous other variables in this regression. Yan (2006) regress the debt ratio against the use of leasing and market-to-book ratio, employment, no-dividend, marginal tax rate, abnormal earnings, operating income, total assets and PPE; Deloof, Lagaert, and Verschueren (2007) add profitability, variability, log of total assets, growth, current assets and financial assets to the use of leasing; Beattie, Goodacre, and Thomson (2000): expected growth, liquidity, size, tax rate, profitability, total asset growth and fixed asset proportion; and Erickson and Trevino (1994): profitability, marginal tax rate, non-debt tax shields, earnings volatility and probability of financial distress. The only paper that just uses debt ratio against use of leasing is Marston and Harris (1988). For data availability and time constraint we are restricting ourselves to the most simple regression with the available data.
31 0% 10% 20% 30% 40% 50% 60% 70% 80% Total Fleet Europe North America South America Asia Pacific Middle East Africa Global LCCs
48.8% of the total fleet concerning LCCs. This figure is close to half of the fleet which attests the importance of leasing nowadays.
We aim to compare this result with the aviation sector’s average. Ascend, a leading provider of expert advisory and valuations services to the global aviation industry, provides the current average of leased aircraft from every airline in the world. The advisory service estimates it to be 39%, meaning that LCCs make a more intensive use of leasing as a way of financing aircraft. This disparity of about 10% in aircraft leasing penetration rates shows that there is a key difference in the business strategies between LCCs and FSCs.
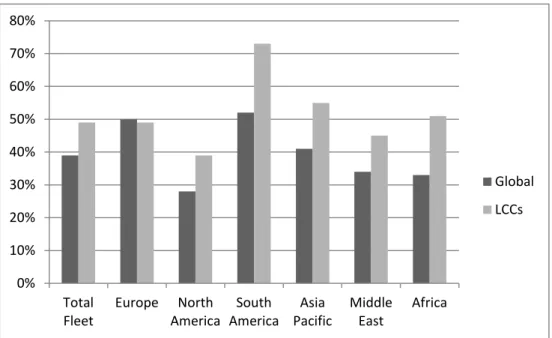
Figure 1 gives a regional comparison on this statistic. Again, Ascend
was the source for the global industry data, which is going to be compared to our results. Concerning LCCs only, we observe lease rates above 50% in South America (the leading region), Asia Pacific and Africa. North America, on the other hand, registers the lowest percentage. Interestingly enough, North America maintains the lowest lease rate when we refer to all the airlines, while South America also continues to be the leading region. This shows the different relevance that managers give to aircraft leasing in the two hemispheres of the continent. Europe registers values close to 50% in both indices.