Key words: airline industry, merger/consolidation, legacy airlines, low-cost carriers, antitrust.
Palavras-Chave: indústria do transporte aéreo, fusão/consolidação, companhias aéreas "legacy", companhias aéreas "low cost".
Recommended Citation Resumo
A indústria do transporte aéreo vem desempenhando inconsistentemente desde a desregulação de 1978 e tem havido uma discrepância significante de lucros entre companhias aéreas "legacy" e companhias aéreas "low cost" nos Estados Unidos. Desde o começo dos anos 2000, quatro das maiores companhias aéreas "legacy" escolheram a consolidação, em um esforço para aumentar a eficiência e a lucratividade. As empresas Delta Air Lines e Nortwest Airlines entraram em fusão em 2008, tornando-se a maior companhia aérea do mundo. Este artigo examina o efeito da fusão nas tarifas aéreas das 1.000 maiores rotas de pares de cidades doméstica norte-americanas com relação ao número de passageiros, a distância, e o market share, bem como questões potencialmente anticoncorrenciais. Todas as companhias aéreas foram categorizadas em três grupos - companhias aéreas "Legacy", "Delta-Northwest" e "Low Cost" - e as interações entre as tarifas e as variáveis foram examinadas dentro de cada grupo de empresas e entre os diferentes grupos. Descobriu-se que as tarifas das companhias companhias aéreas "Legacy" e "Delta-Northwest" caíram a uma taxa mais rápida do que as empresas "Low Cost", enquanto que a sua participação de mercado aumentou simultaneamente independente de terem oferecidos os preços mais baixos ou terem a maior participação em cada rota.
Park, S. S. (2014) A merger effect on different airline groups: empirical study on the Delta-Northwest merger in 2008. Journal of Transport Literature, vol. 8, n. 2, pp. 73-99.
Sora Park*
Abstract
The airline industry has performed inconsistently since deregulation in 1978 and there has been a significant profit discrepancy between legacy airlines and low-cost carriers. Starting from the early 2000s, four of the largest legacy airlines chose to consolidate with an effort to increase efficiency and profitability. Delta Air Lines and Northwest Airlines have consolidated in 2008, becoming the largest commercial airline in the world. This paper examined the merger effect on the airfares on top 1,000 U.S. domestic city-pair routes in relation to the number of passengers, the distance, and the market share as well as its potential anticompetitive issues. All airlines were categorized into three groups – Legacy Airlines, Delta-Northwest, and Low-Cost Carriers – and the interactions between the airfares and the variables were examined within each airline group and across different airline groups. It was found that the airfares of legacy airlines and Delta-Northwest decreased at a faster rate than the low-cost carriers while their market shares increased simultaneously irrespective of whether they offered the lowest prices or had the largest market share on each route.
* Email: [email protected].
Research Directory
Submitted 31 Jan 2013; received in revised form 7 Mar 2013; accepted 23 Jun 2013
A merger effect on different airline groups:
empirical study on the Delta-Northwest merger in 2008
[Um efeito fusão de diferentes grupos de companhias aéreas: estudo empírico da fusão Delta-Northwest em 2008]
Rockefeller College of Public Affairs & Policy at SUNY Albany - USA
Introduction
The U.S. domestic airline industry can be largely divided into two different groups; one is
legacy airlines and the other one is low-cost carriers (LCCs). In general, legacy airlines refer
to those carriers who existed before the Airline Deregulation Act of 1978. As they operate on
almost any domestic and international routes, they provide first and business class, airport
lounges, and other high-level of services with various types of aircrafts. On the other hand,
LCCs entered the market after deregulation and operate under the low cost structure that
maximizes their profit by primarily serving direct flights on the denser routes at lower prices
with fewer services.
The distinct difference in those two groups of airlines can also be found in the profit gap
between them. Since deregulation in 1978, the airline industry has been volatile in terms of its
financial stability, while the demand for air travel has steadily increased. There have been
over 160 airline bankruptcies since 1978, yet particularly, the largest airline bankruptcies took place in the early 2000’s; US Airways and United Airlines entered Chapter 11 bankruptcy in 2002, Delta Airlines and Northwest Airlines in 2005. Besides bankruptcies, the legacy airlines
alone incurred nearly $25 billion in operating losses from 2000 to 2003, while LCCs gained
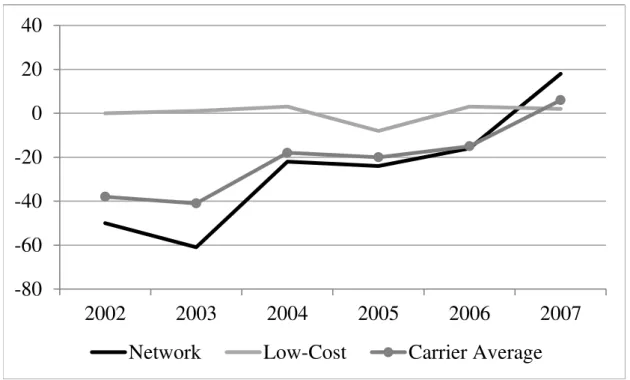
$1.3 billion in profit during the same time period.1 Figure 1 shows the operating loss per
originating passenger was more than $60 for legacy airline in 2003, whereas the operating
profit per passenger was positive for LCCs at the same time.2 In the meantime, mergers and
acquisitions in the airline industry have increased considerably. Starting with the American Airline’s acquisition of TWA in 2001, America West acquired US Airways in 2005, Delta Air Lines acquired Northwest Airline in 2008, and United Airline consolidated with Continental
Airline as a way to increase their profitability through consolidation. Excluding the merger
between America West and US Airways in which US airways announced to become a
1
See United States General Accounting Office. (2004, June). Commercial Aviation: Despite Industry Turmoil,Low-Cost Airlines Are Growing and Profitable (Publication No. GAO-04-837T). Washington, DC: JayEtta Z. Hecker.
2
cost carrier from a legacy airline, the rest of mergers were between legacy airlines. Then the
question arises as to whether legacy airlines could be able to turn around its financial
difficulty by recent merger trends. In fact, Figure 1 shows that the profit gap between the
legacy airlines and the LCCs became narrower since 2005. The operating loss eventually
turned to a positive profit for legacy airlines by the beginning of 2007 and it surpassed the
operating profit of the LCCs, confirming the positive effects from the mergers.
-80
-60
-40
-20
0
20
40
2002
2003
2004
2005
2006
2007
Network
Low-Cost
Carrier Average
Figure 1 – Performance measure in the airline industry:
system operating profit or loss per originating passenger3
The merger and acquisition was considered inevitable to minimize asset devaluation in order
prevent any domino effect in the airline industry as most airlines at issue were “too big to fail’
and because the industry itself was widely vertically-integrated and interdependent to each
other. However, the flood of horizontal merger could impose a threat to the incumbents and
consumers due to the likelihood that the integration of major airlines with long-established
networks may dominate the market and less the competitiveness of the airline industry.
3
Nonetheless, the United States Department of Justice granted immunity from antitrust issues for most airline mergers in the 2000’s, and four of the largest legacy airlines chose to consolidate with one another while the efficiency and competitive effects of mergers
remained controversial. 4
As the airline industry has undergone several transformations by eliminating inefficient
operators and has consolidated its excess capacity by mergers and acquisitions, it was
imperative to evaluate the merger effect on the merged airlines and the non-merger airlines.
Although there have been extensive studies about price effects after mergers in the 1980s,
there have not been enough studies about the recent mergers and the corresponding changes in
the performance of merging firms in relations to those of other legacy airlines and low-cost
carriers. Thus, the empirical results on the current merger will provide an opportunity to find
the changes within each airline and across different airlines as well as the general outcomes of
the consolidation in the airline industry.
This paper examined the empirical evidence on the merger effect of Delta-Northwest. The
Delta-Northwest merger in 2008 was an unprecedented event where two of the largest legacy
airlines consolidated with antitrust immunity, although the probability of potential
anticompetitive effects remained high. The significance of this event arose not only from the
fact that the merging firm could harm the other airlines and consumers significantly through
its combined market power, but also from the speculations on merger benefits. By
categorizing the U.S. domestic airlines into three different groups and comparing their
performances two quarters before and after merger in the course of four years, this paper
analyzed the merger effect on airfares in terms of the changes in the number of passenger,
flight distances, and market shares on top 1,000 U.S. domestic city-pair routes. In addition,
this paper investigated the antitrust issue associated with the potential anticompetitiveness of
the proposed merger between Delta and Northwest.
4
1. Literature Review
There have been numerous studies devoted to analyze the effects of mergers by using panel
data. Lichtenberg and Kim (1989) compared the performance of merged airlines by analyzing
load factor, flight duration, and other input prices from five different mergers that occurred in the 1970’s and the 1980’s. Morrison (1996) specifically looked at the two different mergers between Northwest Airlines and Republic Airlines in 1986 and between US Air and Piedmont
Aviation in 1987 and found that fares on those routes affect by the mergers jumped as high as
30 percent. Peters (2003) predicted substantial increase in post-merger prices on overlap
routes of merged airlines and compared them to actual post-merger prices from six major airline mergers in the 1980’s. Berry and Jia (2009) found that the air travel demand became more price sensitive in 2006 than that of the 1990’s. Also, they found that travelers put more emphasis on direct flights than hub airports, which explained the legacy airline’s consistent
losses over the past decade. Overall, there has been extensive analysis supporting the price
increase after the merger.
On the other hand, Ito and Lee (2003) identified the market characteristics of low cost carriers.
LCCs typically competed in the markets where passenger density was high enough for them
to exploit their competitive advantage by providing the quick-return point-to-point service. In particular, when LCC’s networks were not large enough to generate more capacity in the late 1990’s and the early 2000’s, they had no choice but to choose denser markets in which they serve non-stop routes for local passengers. Looking at Ito and Lee’s data on the number of the
largest 1,000 domestic city-pair markets in 1990, low-cost carriers only served 78 city-pairs
whereas they now serve 613 city-pairs on the latest data in the third quarter of 2010. As LCCs’ networks expanded throughout the U.S. domestic market, Tan (2011) found that legacy airlines lowered their fares before and after LCC’s entry while LCCs did not change
their fares. Although LCCs could be disadvantageous upon entering the market due to entry
barriers such as legacy airlines’ dominance at airport gates and landing/take-off slot controls, LCC’s low cost structure enabled them to charge lower fares. Once highly concentrated markets by legacy airlines faced the threat of price competition, and the market
competitiveness has been improved where low-cost carriers successfully competed against
In summary, there were two different evidences at work; mergers made airfares to increase and LCCs’ presence made legacy airlines to lower their fares. If those two factors are present, how will the merger between legacy airlines affect LCCs? On the other hand, will legacy
airlines have to alter their pricing strategy when they face competition from LCCs?
2. Background
2.1 Why do airline go into the M&A process?
The primary purpose of mergers and acquisition is to enable airlines to eliminate duplicative
operating costs, therefore reducing their total costs on labor, service, and operations. It also
enables the merging firms to integrate their financial assets, facility, and technology. As a
result, airlines look for mergers and acquisitions in pursuit of both reducing operating costs
and maximizing revenue. For example, if two airlines with the most market overlap merge to
one firm, the cost saving from eliminating the duplicate operations would generate a
significant cost saving effect. Especially when the market demand is at the low, the need for
mergers and acquisitions tends to increase. Experts say that the motivation behind industry mergers and acquisition is largely based on the airlines’ need for the combined market share at the integrating airlines’ major hubs, because it can maximize revenue (US GAO, 2010). While the presence of low-cost airlines may bring down airfares in the market, a dominance
of merging firms through integration could lock in their profit against cost competition.
Furthermore, airlines also seek to merge with one another as a means to expand their
networks. As a way to compete with legacy airlines in the wider markets, LCCs now expand
to the international market through strategic alliance, code sharing, or even through a merger
with other LCCs.
In the U.S. domestic market after deregulation in 1978, price dispersions and excessive
competition over capacity intensified, and it led to many airlines’ financial failures; the largest
five legacy airlines filed Chapter 11 bankruptcy and only 9 of the 23 legacy airlines served the
U.S. domestic market by 2007.5 Besides, legacy airlines lost nearly $33 billion from 2001 to
5
2005, whereas LCCs remained profitable regardless of increasing cost of fuel. In accordance
with the changes in the market structure followed by financial reorganization and exit, mergers and acquisitions increased ever more since the early 1980’s until today. Specifically from the beginning of 2001, American Airline acquired Trans World Airlines, US Airways
acquired America West in 2005, Delta merged with Northwest in 2008, and Continental
merged with United in 2010.
2.2 Delta-Northwest Merger
On April 14, 2008, Delta and Northwest Airlines announced a $17.6 billion merger, which
would make them to be the largest commercial airline in the world. Both of them were legacy
carriers which existed prior to the 1978 Deregulation Act. Also, they operated under the
hub-and-spoke system in which passengers have to go through a hub airport in order to transfer to
other connecting flights. In 2006, Delta was the second largest airline in the top 5,000 markets
in terms of the number of markets served and the number of passengers. Northwest was the
fourth largest, while Southwest being in the first place and American Airline in the third. On
September 26, 2008, two airlines’ shareholders approved the merger and Antitrust Division at
the Justice Department approved the merger on October 29, 2008. As of December 2009, Northwest’s aircrafts have operated under Delta, and Northwest’s hubs have been fully consolidated with Delta’s brand.
2.3 Antitrust and Anticompetitiveness Issues
As discussed above, airlines merge or acquire other airlines to reduce costs on duplicate
operations and consolidate their financial stability, but the proposed merger and acquisition
needs to be approved by the US Department of Justice (DOJ) as required by the
Hart-Scott-Rodino Act. This act requires an acquisition of assets be reported to the DOJ and its Antitrust
Division examines and determines whether the merger is likely to have an adverse effect on
consumers by following their analytical framework called Horizontal Merger Guidelines.
Under these guidelines, the US DOJ defines the relevant product market and geographic
market where the merging firms operate and determines the likelihood of increased
Defining a relevant geographic market could be ambiguous depending on the industry,
products, and geographic areas. Generally, a relevant market indicates products and their
geographic area where they are produced and sold by a monopolist. The monopolist in this
market is likely to have the power to increase his price above the competitive price due to the
market conditions such as the inelastic demand or insubstitutability of the product. In the
airline industry, each city-pair market is recognized as a separate geographic market and the
nonstop flights can be considered as separate products because they are an equivalent
substitute for connecting flights. 6 For antitrust purposes, a relevant market is defined as
nonstop service in a city-pair market. 7 Thus, a relevant market in reviewing a potential
merger constitutes an aggregate of each city-pair market in which the merging firms operate.
The next stage of evaluating the potential merger is to quantify the market power and the
concentration ratio of merging firms and their likelihood of potential anticompetitive effects
in the market. Market power is measured by market share, and airlines with the larger market
share in the relevant market is likely to extract fare premiums because they have established
dominance over airport gate assignment, inelastic demand in their city-pair routes, and such.
The higher the market share a firm has, the more the market is concentrated. Thus the relevant
market is likely to be shared by only few firms, and it gives them an incentive to engage in
anticompetitive conduct and fully exploit their monopoly power. According to the US GAO, a
concentrated market is where a single airline accounts for at least 60% of the passenger
enplanement or two airlines with 85%.8 They found that average fares tend to be higher in the
concentrated markets. The US DOT also identified a concentrated market with a single firm
accounts for 70% of the market. 9 The Herfindahl Hirschman Index (HHI) is considered as a
good measure for concentration ratio as well for evaluating horizontal mergers, which will be
discussed later in this paper.
6
See Goetz, A.R. (2002). Deregulation, competition, and antitrust implications in the US airline industry,
Journal of Transport Geography, (10), 1-19.
7
Klein, J. et al. (1999, May). Predation ‘strategy’ at American airlines: a change of heart at the justice department? Antitrust Law and Economics Review, 93-110.
8
United States General Accounting Office. (1993, July). Airline Competition: Higher Fares and Less Competition Continue at Concentrated Airports (Publication No. GAO/RCED-93-171). Washington, DC.
9
United States Department of Transportation. (1990). Secretary’s Task Force on Competition in the US
Following the Horizontal Merger Guidelines, the US DOJ analyzes other anticompetitive
effects on competition in the corresponding industry and the likelihood of failure of merger
proposing firms in the absence of a merger, which is weighed against the potential consumer
benefits from expanded service of the merged firm. The recent cases of the Delta-Northwest
merger in 2008 and the United-Continental merger in 2010, the US DOJ has granted full
approval, deciding that the potential benefits for consumers will outweigh the potential
anticompetitive effects in the airline industry. According to the public announcement from
DOJ on October 28, 2010 in closing their investigation in the proposed merger of Delta and
Northwest, they stated that “…the merger likely will result in efficiencies such as cost savings
in airport operations, information technology, supply chain economics…consumers are also
likely to benefit from improved service…by combining under single ownership…”.10
The financial viability of the airline industry has been a significant issue for the industry itself
as much as its potential negative impacts on consumers and the government in the forms of
increased airfares, unemployment, and federal financial assistance. While the airline industry
went through numerous bankruptcies and mergers since deregulation, new airlines and
existing airlines continued to increase their capacity, only to exacerbate reduce their revenues.
Past mergers and acquisition were intended to reduce this excess capacity in effort to improve
their profitability, yet the reduction in industry capacity was temporary due to the expansion
of existing and new airlines. Thus the rationale behind the merger approval is to enable the
larger airlines to combine their duplicative operations on overlapping routes so as to reduce
excess capacity, achieve cost savings, and ultimately generate more revenues. Besides the fact
that the integration of computer systems, airline fleets, facilities, and human capital of two
different airlines is not an easy task, the integration process may face challenges from the
consumer side. Capacity reduction poses a potential price increase issue in certain markets
after a merger.
The major difference between low-cost carrier’s operations and legacy airlines’ operations is
the network structure. Legacy airlines use hub-and-spoke networks where passengers fly
through a hub in order to get to their final destination, while LCCs use a point-to-point system
10
where they serve non-stop flights between denser airports. LCCs enjoy their profitability by
focusing on economies of scale from traffic density and they have less motivation to enter the
market with the lower passenger traffic. On the other hand, legacy airlines expand their
networks due to their cost advantage on economics of scope and they are likely to have more
incentives to serve the markets where they do not face a competition from LCCs. In fact,
some studies showed that air fares increased on some markets after mergers and acquisition in
the 1980s.11 A few other studies showed that dominant airline at an airport charged higher
fares due to their barriers to entry.12 In addition, a recent study found that Legacy Airlines
reduced their fares upon the entry of LCCs in the market, whereas the LCCs did not alter their
pricing.13 Overall, cost reduction could provide the merging Legacy Airlines an increased
revenue flow at the expense of consumers.
The U.S. airline industry has undergone many changes since the deregulation. While the
airlines took the freedom of adopting their most efficient pricing without the previous
restrictions on their operations on specific routes or airports, it essentially led to them to
engage in predatory pricing in a way to expand their capacity in the market. Using
discriminatory pricing that separates business passengers from leisure travelers, some airlines
charged higher fares for business passengers while this profit was subsidized for the loss from
heavily discounted fares. Many studies acknowledged this fare dispersion and found that
smaller routes with less competitive alternatives tend to have higher fares compared to larger
routes or airports.14
Along with the pricing dynamics, complaints of predatory pricing indicated aggressive
competition that has been persistent in the U.S. airline industry. There have been several
allegations that legacy airlines were involved in predatory pricing behavior in which they
11
See Morrison, S. A. (1996, September). Airline Mergers: A Longer View. Journal of Transport Economics and Policy, 30(3), 237-250.
12
See Borenstein, S. (2005). U.S. Domestic Airline Pricing, 1995-2004. (Working Paper No. CPC05-48).
12
See Tan, K. M. (2010). Incumbent Response to Entry by Low-Cost Carriers in the U.S. Airline Industry
(Doctoral dissertation, The Ohio State University, 2011).
14
sharply reduce their fares and increase their capacity in an effort to eliminate the new entrants
with an expectation of recouping the losses by charging consumers with supra-competitive
prices once the entrants were driven out of the market. In fact, the U.S. DOT received 32
complaints alleging anticompetitive conduct such as unfair pricing, capacity responses, and
barriers to entry from 1993 to 1999.15 Nonetheless, U.S. District Court ruled in favor of
American Airlines and Northwest Airlines against Vanguard Airlines and Reno Airlines
respectively, reasoning that the actions taken by those legacy airlines were proper alternative
response with sufficient justification.16
The US DOJ in 2008 published a report on the potential effects of mergers and acquisition in
the US domestic airline industry, illuminating on the inevitability of financial consolidation
amongst the airlines and evaluating the concerns with the Delta-Northwest merger.17 They
examined the extent of efficiencies arising from the route expansion and cost saving from the
merger, which was weighed against the financial standing of merging firms as the potential
failure of one of the merging firms would substantially depreciate its assets and harm the
industry. They also evaluated the probability of merger partners facilitating its enhanced
market power after the proposed merger. Additionally, they accentuated the changes in the
airline market structure due to the entry of LCCs in recent years, and proposed that
competition would not subside simply by consolidation of legacy airlines as opposed to the
entry of a new carrier. They looked at several studies on how the presence of LCCs on routes
mitigated the dominance of legacy airlines and spurred the pricing competition. They found
that the hub dominance was not correlated to a gain in market power.18 To determine the
competitiveness of the U.S. airline industry and its resilience to the proposed merger, US DOJ
also examined the possible changes in passenger traffic, market share, and the number of
competitors on routes where merger partners operate as well as financial conditions of the
merger partners.
15
See Transportation Research Board, (1999). Entry and competition in the US airline industry: issues and opportunities (Special report 255), National Research Council, Washington DC.
17
See United States General Accounting Office. (2008, July). Airline Industry: Potential Mergers Acquisition Driven by Financial and Competitive Pressures, (publication No. GAO-08-845). Washington, DC. Retrieved from General Accounting Reports Online:www.gao.gov/new.items/d08845.pdf
18
2.4 Merger Analysis
As previously discussed, the U.S domestic airline industry had a history of new entry and
consolidation. The four-firm ratio was 46% from 1978 to 1985 and 69% from 1985 to 1991,
while it was 56% in 2000.19 Using the data from the Bureau of Transportation Statistics (BTS),
the four-firm ratio was 41% in 2006 with a slight increase at 46% in 2010. 20 While the concentration ratio has decreased consistently from the late 1980’s, it has shown an increase during the Delta-Northwest merger period although a subsequent study is needed in the future
to see whether this is a temporary effect from the merger or the permanent integration in the
U.S. market.
In evaluating horizontal mergers, the HHI index of market concentration was calculated by
adding the squares of the market shares of each firm in the relevant market. These merger partners’ hub airports were chosen for the HHI calculation in order to analyze any changes in market share and concentration ratio during the merger period from 2008 to 2010. If the HHI
is below 1000, the market was unconcentrated, while HHI above 1800 indicated a high level
of concentration. As shown in Table 1, both airlines’ hub airports had the HHI greater than
1800 with the market share as high as 66%, indicating the already established high
concentration. Atlanta airports showed an increase in both the market share and the HHI, implying the merger enhanced the merger partners’ market power. On the other hand, Detroit and Minneapolis showed a significant reduction in the market share from approximately 61%
to 49% and 66% to 53% respectively. The HHI at those airports dropped simultaneously,
while the numbers are still well above the threshold for the high level of concentration. To the
contrary, New York J.F.K airport seemed to have an ambiguous effect from the merger; the
market share increased while the HHI decreased substantially. This could imply that the
merger had a positive effect on the market share of the merger partner, whereas it subsequently lowered the other airlines’ relatively large market share at the same airport.
19
Data from Goetz, A.R. (2002). Deregulation, competition, and antitrust implications in the US airline industry,
Journal of Transport Geography, (10), 1-19.
20
Table 1 – Airport market shares
Delta-Northwest Hub Airport Market Shares HHI Index Market Shares HHI Index Market Shares HHI Index Market Shares HHI Index
Atlanta (ATL) 52.76% 3825 58.06% 3681 53.42% 3641 56.85% 3945
Detroit (DTW) 60.98% 4128 59.32% 3974 49.94% 3219 48.90% 3157
New York (JFK) 14.91% 3090 15.33% 2990 19.81% 2572 21.65% 2601
Minneapolist-St.Paul (MSP) 66.17% 4711 65.89% 4684 52.93% 3562 52.89% 3680
Salt Lake City (SLT) 40.48% 2690 39.79% 2884 38.85% 2895 40.70% 2940
2006 2007 2009 2010
In comparison to individual airport markets, city-pair markets weigh more importance,
because the city-pair routes are defined as relevant markets with regard to the antitrust issues.
Before analyzing the relationship between the air fare and the market share in the regression
analysis later in this paper, the changes in Delta-Northwest’s market share on several top
1,000 U.S. domestic city-pair routes were summarized in Table 2.
Table 2 – City-pair routes passengers and largest market shares
City-Pair Routes Pre-Merger 2006 Post-Merger 2010
Pre-Merger 2006 Post-Merger 2010
37% 37%
(Delta 37%) (United 10%)
43% 40%
(Southwest 24%) (Southwest 27%)
54% 61%
( Spirit 24%) (Spirit 28%)
69% 59%
(AirTran 17%) (Sun Country 18%)
46% 40.50%
(AirTran 29%) (Southwest 21%)
67% 76%
(Continental 3%) (Continental 1.5%)
21% 18%
(21% Delta) (18% Delta) 464 448
Seattle - Tampa 313 345
Detroit – Las Vegas
Boston-Minneapolis
Indianapolis – Los Angeles
Atlanta – Salt Lake City
1902 1873
1178 1234
867 511
New York - Washington DC 3772 2325
Chicago - Detroit 2273 1425
Number of Daily Passengers
Largest Market Share by
Delta or Northwest Airlines
The sample city-pair routes where Delta-Northwest had the largest market share were selected
and compared between the pre-merger and the post-merger time period. The numbers in
parentheses presented the airlines and their market which provided the lowest fare on the
corresponding routes where Delta-Northwest had the largest market share. Interestingly,
Delta-Northwest’s market share had not changed from 2006 to 2010 in the New York
-Washington D.C city pair market, yet there was a quite change in airfare. Before merger,
Delta had the largest market share on this route while it also provided the lowest fare. However, United Airline replaced Delta’s place after the merger, providing the lowest fare on the route. On the other hand, the Atlanta-Salt Lake City city-pair market showed an increase
in Delta-Northwest’s market share from 67 to 76 percent while the market share of the lowest
fare provider, Continental Airlines, decreased substantially from 3 to 1.5 percent. This could
imply that the merger enabled Delta and Northwest to expand their market share on this route
and probably engage in price competition against Continental Airlines.
Several studies showed a significant increase in the HHI on the city-pair routes. For the routes
between the cities with large populations, merger partners tended to dominate on these routes
after consolidation. Combining the existent market share alone gave much more market power
for the merger firms, and the actual data in the late 1990’s showed that the combined
concentration was increased to 70 percent of nonstop traffic on the corresponding routes.21
Nevertheless, antitrust scrutiny involves a multilateral analysis that assesses the effects of the
proposed merger at the national level, the individual airport level, and the city-pair routes
although this may give contrasting results depending on the definition of the relevant market.
There are several studies on how airlines have influenced the fares of the other airlines by
exercising increased market power through mergers and acquisitions. Some found that
merger-affected routes showed a significant price increase while this increase was correlated
with a gain in concentration. 22 The enhanced market power could appear in the form of
predatory pricing in which the merging firm enjoys economies of scale and drove out its competitors by reducing their airfares below the competitor’s prices. On the contrary, the
21
See Goetz, A.R. (2002). Deregulation, competition, and antitrust implications in the US airline industry,
Journal of Transport Geography, (10), 1-19.
22
See Kim, E. H. & Singal, V. (1993, June). Mergers and Market Power: Evidence from the Airline Industry.
merging firm could utilize its enhanced market share against the non-merger competitors and
increase its price, taking advantage of its network expansion and the corresponding consumers’ preference. Particularly if the merging firms had solid market share at smaller airports and on unpopulated city-pair routes even before the merger, the integration process
between the merging partners was likely to give them dominance in these markets.
Furthermore, as the merging firms had a control over the airfares on these markets, the merger
may led to a tacit collusion between the merging firms and non-merger firms in which they
implicitly agreed or followed the pricing behavior of the leading firm, primarily in the form of
higher prices.
3. Data and Methodology
The purpose of this paper was to analyze the merging airline’s pricing behavior compared to
other airlines during pre- and post-merger periods, especially on whether this merger had
altered the market structure and to what extent the merger affected different airline. To
examine the presence of these merger impacts, the changes in operations of legacy airlines
and LCCs were compared to that of Delta-Northwest along with the changes in the consumer
demand which was measured by the daily non-stop passenger traffic. A potential change may
include an aggressive pricing strategy of the merging firm which would coincide with a gain
in its market power in the corresponding city-pair routes. While legacy airlines in general were unprofitable in contrast to the LCC’s lower operating cost structure, a merger between the large legacy airlines could have enabled them to sufficiently reduce their fares through
economies of scale from the merger. On the other hand, the merger between these two largest legacy airlines could have disincentivized other airlines’ competitive pricing due to the reduced number of competitors in the same market, thus it could have led to higher fares after
the merger. While many studies have found the significant correlation between a price
increase and an airline merger, specifically on the routes or in the airport markets where the
merging airline directly faced competition from other airlines, this paper examined the
comprehensive merger effect and its trend in the market regardless of whether or not the
merging firm operated in the corresponding market. In other words, this paper investigated the
general influence of the Delta-Northwest merger in the U.S. domestic airline market, rather
The top 1,000 largest U.S. domestic city-pair markets have been collected to analyze the
Delta-Northwest merger effect on the major, dense domestic routes. The data was available
from the Office of Aviation Analysis under the Department of Transportation (U.S. DOT).
The Department of Transportation releases an Air Travel Consumer Report each month to
inform consumers about service quality of each airline. As part of this effort, the Office of
Aviation Analysis publishes a quarterly report to provide average fare information in the
1,000 largest domestic city-pair markets, which accounts for 75 percent of total passengers in
the 48 contiguous states and 70 percent of total domestic passengers. This report includes the
origin city, the destination city, the number of one-way passenger per day on each city-pair
route, the non-stop distance, the average market fare per mile, the airlines with the largest
market share on each route and their fares, and the airlines with the lowest airfare and their
market share.23
The extended version of top 1,000 city-pair routes was available only on the U.S. DOT
website, which listed all city-pair routes with average at least 10 passengers each day where
either the origin city or destination city is a hub and has more than one airport. To minimize
the different characteristics of each city-pair routes, only duplicate routes were selected across
2006, 2007, 2009, and 2010. Thus, the same routes across different years were compared, and
this eliminates the variations across the selected routes and enables a direct comparison
between other variables such as airfares and the consumer demand. In order to provide a
direct test on merger effects without the deterrence from the trending and seasonality issues,
the third quarter of each year is compared for the merger period. Since the Delta merger took
place in April 2008 and it has completed in October 2008, two quarters before and after the
third quarter of 2008 have been gathered for data analysis. The third quarter of 2006 and 2007 are recognized as a “before-merger” period and 3rd quarter of 2009 and 2010 as “after -merger” period.
23
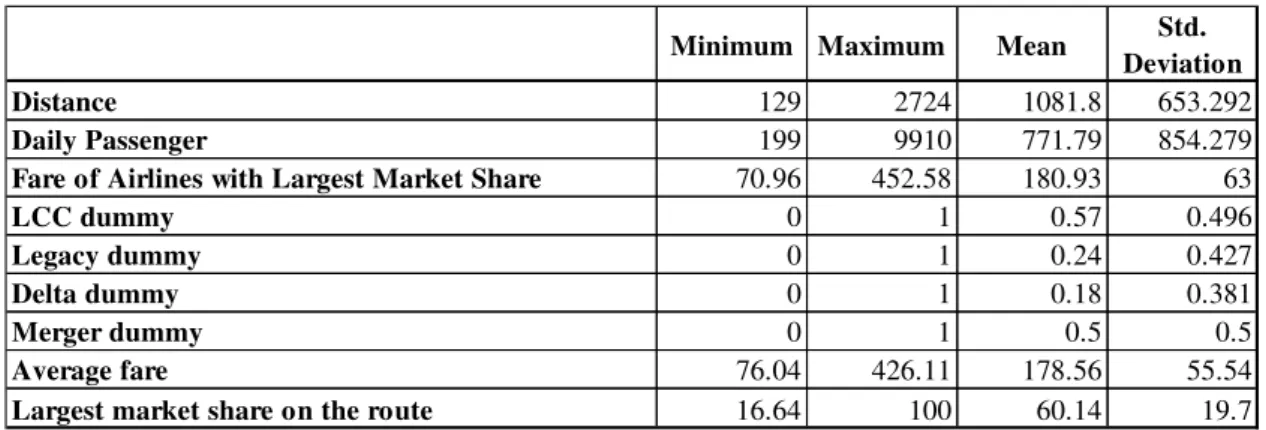
Table 3 - Descriptive Statistics on the airlines with the largest market share
on top 5,000 U.S. domestic markets (n=4002)24
Minimum Maximum Mean Std.
Deviation
Distance 129 2724 1081.8 653.292
Daily Passenger 199 9910 771.79 854.279
Fare of Airlines with Largest Market Share 70.96 452.58 180.93 63
LCC dummy 0 1 0.57 0.496
Legacy dummy 0 1 0.24 0.427
Delta dummy 0 1 0.18 0.381
Merger dummy 0 1 0.5 0.5
Average fare 76.04 426.11 178.56 55.54
Largest market share on the route 16.64 100 60.14 19.7
Descriptive Statistics on the airlines with the lowest fare
on top 5,000 U.S. domestic markets (n=4002)
Minimum Maximum Mean Std.
Deviation
Distance 129 2724 1081.8 653.3
Daily passenger 199 9910 771.79 854.28
Average fare 76.04 426.11 178.56 55.54
Market share of lowest-fare airlines 1.02 100 37.14 27.98
LCC dummy 0 11 0.74 0.47
Legacy dummy 0 1 0.15 0.356
Delta dummy 0 1 0.11 0.318
Merger dummy 0 1 0.5 0.5
Lowest fare 66.48 380.27 156.24 47
The effect of merger could lead to different results owing to the different operating structure
of each airline. To compare the Delta-Northwest merger to non-merger legacy airlines and
LCCs, airlines were categorized into three different groups.25 The first group was low-cost
Carriers, the second was a group of three legacy airlines which did not merge or acquire
during the Delta-Northwest merger.26 Last group consists of Delta and Northwest. If
24
Source: author’s database.
25
Since the regional airlines normally operate either by code sharing or alliance with larger airlines, the performance of regional airlines have been disregarded for simplicity.
26
Northwest was identified on quarterly reports prior to the merger, it is grouped under Delta
Airline. Price dispersion amongst different airlines was extensive depending on the extent of
competition, market power, and the size of the market. Therefore, the average fares might
severely distort the true information on fares. Instead, the lowest fares were compared to see
whether they had a significant relationship with each airline group in the post-merger period.
In addition, the fares of the largest carrier on each route were weighted against other market
variables so as to analyze the connection between market power and the changes in fares.
Table 3 descriptive statistics summarized the data.
The total of 4002 city-pair routes was collected during the 2006-2007 and 2009-2010. The
mean fare of the airlines with the largest market share was $180.93, implying that theses
airlines with market power charged a higher price than the average at $178.56 whereas the
mean of the lowest fare was $156.24. On the other hand, the mean of the largest market share
was 60.14 percent while the mean market share of the lowest fare is 37.14. In the market with
the lowest fare, LCCs accounts for 74 percent, while Delta contributed only 11 percent. In the
market with the largest market share, LCCs still accounted the majority at 57 percent, while
legacy served 24 percent of the market and Delta-Northwest served 18 percent of the market.
The dataset available at U.S. DOT was organized in two different categories27; one with the
airlines with the lowest fares and the corresponding number of passenger, the distance, and
the market share; another one was the same information on the airlines with the highest
market share on each city-pair routes. As discussed before, the average fares were disregarded
due to the high level of price dispersion in the airline industry. To identify changes on the
airfares in relation to the changes in other available variables, the following expression was
used for each group.
(1) Fare low = α0 + β1distance+ γ1pax + 1mksh + Dm+
(2) Farehigh = α1 + β2distance+ γ2 pax + 2mksh + Dm+
27
The variable Farelow was the lowest fare in the first dataset, while Farehigh was the fare of the
airlines with the highest market share in the second dataset. The regressor distance was the
distance between the two different cities of each city-pair routes, pax was the number of
average daily passengers on each route, mksh was the market share of each corresponding
airlines on each route. The last variable Dm was a dummy variable that takes the value 1 for
the post-merger period from 2009 to 2010, while it was 0 for the pre-merger period from 2006
to 2007. The expressions above examines whether or not the Delta-Northwest merger led to a
change in airfares of non-merging airline groups relative to that of Delta-Northwest. The
changes in the airfares of each group were examined separately, as shown in Table 4.
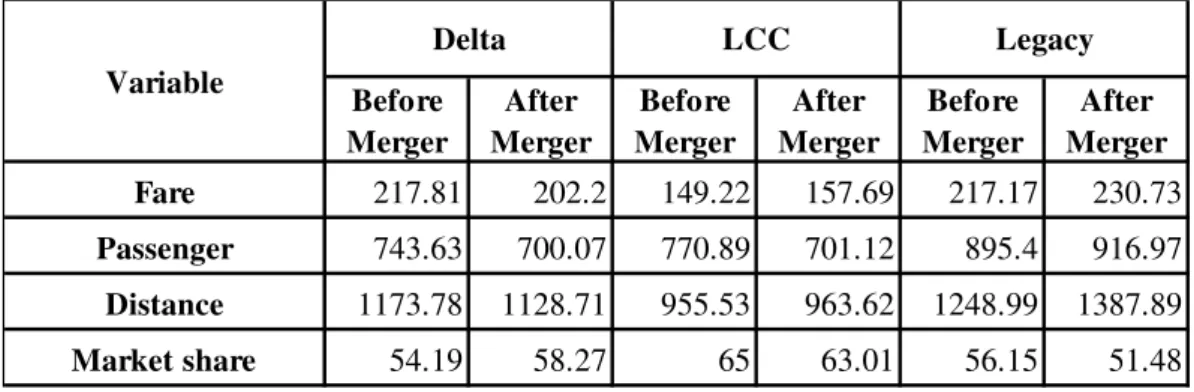
Table 4 - Variable means by airline group and year, when the airlines have the largest
market share on top 1,000 U.S. domestic city-pair routes
Before Merger
After Merger
Before Merger
After Merger
Before Merger
After Merger
Fare 217.81 202.2 149.22 157.69 217.17 230.73
Passenger 743.63 700.07 770.89 701.12 895.4 916.97
Distance 1173.78 1128.71 955.53 963.62 1248.99 1387.89
Market share 54.19 58.27 65 63.01 56.15 51.48
Variable
Delta LCC Legacy
Variable means by airline group and year, when the airlines have the lowest fare on top
1,000 U.S. domestic city-pair routes
Before Merger
After Merger
Before Merger
After Merger
Before Merger
After Merger
Fare 173 175.31 148.85 144.91 186.14 185.89
Passenger 683.6 731.68 815.35 820.19 636.47 530.28
Distance 1468.99 1309.7 948.44 1038.31 1183.6 1423.67
Market share 20.64 23.67 42.08 40.6 31.48 24.93
Variable
While the above expressions examined the merger effect within each airline group, another
term was added to analyze the aggregate merger effect among different airline groups.
(1) Fare low = α 0 + β1distance + β2pax + β3mksh + delm Ddelm+ ccm Dccm + legmDlegm + γ1(mksh*Ddelm) + γ2 (mksh* Dccm) +γ3 (mksh* D legm) +
(2) Farehigh = α 1 + β4 distance + β5pax + β6mksh+ delm Ddelm+ ccm Dccm + legmDlegm + γ4(mksh* Ddelm) + γ5 (mksh* Dccm) +γ6 (mksh* D legm) +
Again, the same term was applied to two different sets of data; one organized by the lowest
fare and another one organized by the largest market share. Here the total population of three
airline groups was classified into six groups: before merger cost carrier, after merger
low-cost carrier, before merger legacy airlines, after merger legacy airline, before merger
Delta-Northwest, after merger Delta-Northwest. The corresponding dummy variables were taken for
each groups: Ddelmtook the value of 1 if the data is for Delta-Northwest after merger or 0 for
before merger, Dlegm took 1 for post-merger legacy airlines or 0 for pre-merger legacy airlines,
Dccm tooks 1 for post-merger low-cost carriers or 0 for pre-merger low-cost carriers.
Consequently, β0 was the intercept for the base case, Delta-Northwest before merger. In
addition, the interaction terms were added to test the change in each airline group’s market
share conditional on the existence of merger and whether it could be related to the change in
the airfare. An increase in the fare with the effect of low-cost carriers after merger was likely
to imply that the airfares of non-merging firms are positively affected by the Delta-Northwest
merger. Likewise, if a decrease in the fare corresponded with a decrease in the market share
of legacy airlines after merger, it will indicate that the airfares and the market share of the
non-merging firms are negatively affected by the merger. Thus, this test will examine Delta-Northwest’s own price change after its merger as well as whether its merger influenced the airfares of non-merging firms in terms of the distance, the number of passengers, and the
4. Results
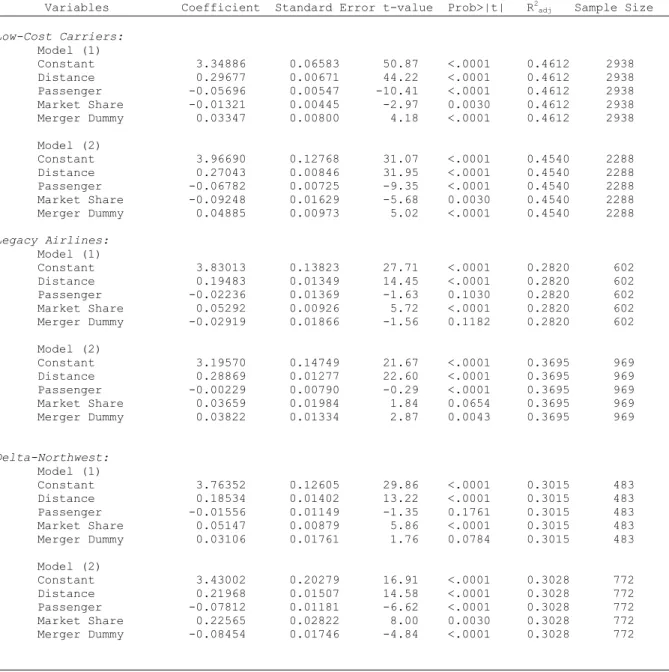
Table 5 shows the changes in airfare for each airline group in relation to the changes of the
distance, the market share, the daily passengers, and the merger dummy when the airlines
provided the lowest fares on each city-pair routes and when the fares on the routes where each
airline group had the largest market share respectively. For the lowest fare, low-cost carriers’
fare increased by 3.3 percent after merger while their market share and the number of
passengers were negatively related with the fare. That is, the market share and the passenger
volume for low-cost carriers were negatively related with the airfare at the statistically
significant level over the period of four years regardless of whether or not the merger took
place, while the price of flight ticket increased by 3.3 percent after the Delta-Northwest
merger. However, the same regression led to different results for legacy airlines; the merger
did not affect the fare of the low-cost carriers. Similarly, the fare of Delta-Northwest did not
change after its merger while the distance and the market share were positively related with its
fare. An increase in the lowest fare was positively related with an increase in distance for all
airline groups, except for LCCs. On the other hand, the airfare was negatively related with the
number of passengers in general while only the change in passenger volume for LCCs was not
statistically significant. The airfare was negatively related with LCC’s passenger volume at
the 90% significance, yet it showed more significance to that of Delta-Northwest. The change
in market share did not seem to affect the airfare, except for that of LCCs which showed a
statistically significant negative relationship between its market share and the lowest fares. In
summary for all the city-pair markets where airlines offered the lowest fares, only low-cost carriers’ fare increased after merger, while the merger did not affect the fare of the other two groups.
For the markets where each airline group had the most market power, the fare of low-cost
carriers increased by 4.8 percent after merger while the fare of legacy airlines increased by 3.8
percent. On the contrary, the fare of Delta-Northwest indicated a significant reduction of its
fare by 8.4 percent after merger. In fact, the positive relationship between the market share
and its fare demonstrated that Delta-Northwest’s fare has been reduced after its merger while
its market share has increased in the markets where the merging firm was already dominant
relative to the other two groups. This is also confirmed by the fact that the market shares of
market share was actually negatively related with fare while legacy airlines’ market share did not have any significance to the fare.
Table 5 – Estimation Results
Models: (1) Fare low = α0 + β1distance+ γ1 pax + 1mksh + Dm +
(2) Farehigh = α1 + β2distance+ γ2 pax + 2mksh + Dm +
Variables Coefficient Standard Error t-value Prob>|t| R2
adj Sample Size
Low-Cost Carriers:
Model (1)
Constant 3.34886 0.06583 50.87 <.0001 0.4612 2938 Distance 0.29677 0.00671 44.22 <.0001 0.4612 2938 Passenger -0.05696 0.00547 -10.41 <.0001 0.4612 2938
Market Share -0.01321 0.00445 -2.97 0.0030 0.4612 2938 Merger Dummy 0.03347 0.00800 4.18 <.0001 0.4612 2938
Model (2)
Constant 3.96690 0.12768 31.07 <.0001 0.4540 2288 Distance 0.27043 0.00846 31.95 <.0001 0.4540 2288 Passenger -0.06782 0.00725 -9.35 <.0001 0.4540 2288
Market Share -0.09248 0.01629 -5.68 0.0030 0.4540 2288 Merger Dummy 0.04885 0.00973 5.02 <.0001 0.4540 2288
Legacy Airlines:
Model (1)
Constant 3.83013 0.13823 27.71 <.0001 0.2820 602 Distance 0.19483 0.01349 14.45 <.0001 0.2820 602 Passenger -0.02236 0.01369 -1.63 0.1030 0.2820 602
Market Share 0.05292 0.00926 5.72 <.0001 0.2820 602 Merger Dummy -0.02919 0.01866 -1.56 0.1182 0.2820 602
Model (2)
Constant 3.19570 0.14749 21.67 <.0001 0.3695 969 Distance 0.28869 0.01277 22.60 <.0001 0.3695 969 Passenger -0.00229 0.00790 -0.29 <.0001 0.3695 969
Market Share 0.03659 0.01984 1.84 0.0654 0.3695 969 Merger Dummy 0.03822 0.01334 2.87 0.0043 0.3695 969
Delta-Northwest:
Model (1)
Constant 3.76352 0.12605 29.86 <.0001 0.3015 483 Distance 0.18534 0.01402 13.22 <.0001 0.3015 483 Passenger -0.01556 0.01149 -1.35 0.1761 0.3015 483
Market Share 0.05147 0.00879 5.86 <.0001 0.3015 483 Merger Dummy 0.03106 0.01761 1.76 0.0784 0.3015 483
Model (2)
Constant 3.43002 0.20279 16.91 <.0001 0.3028 772 Distance 0.21968 0.01507 14.58 <.0001 0.3028 772 Passenger -0.07812 0.01181 -6.62 <.0001 0.3028 772
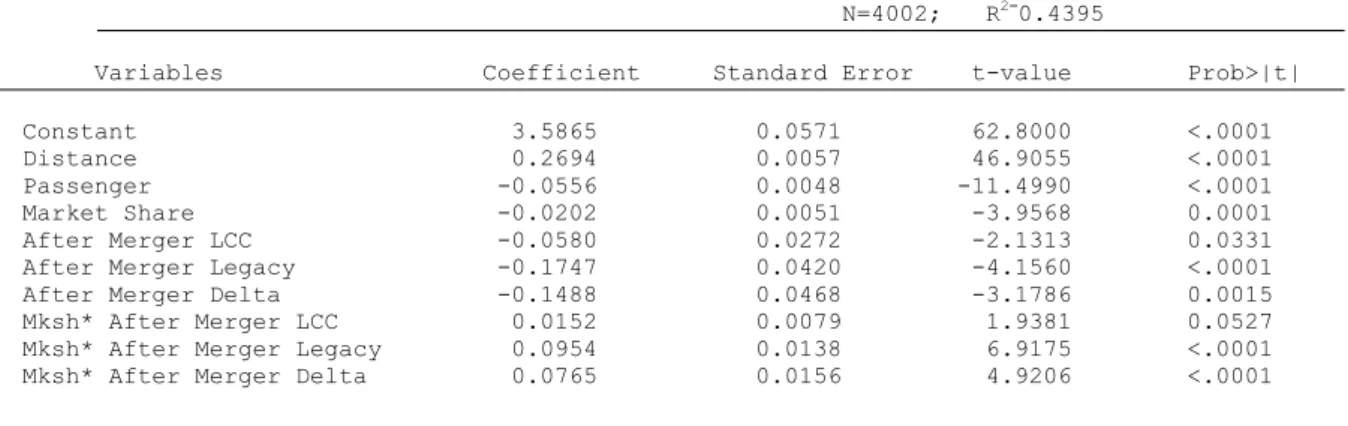
The merger effect on the lowest fare was analyzed in Table 6. Legacy airlines fare showed a
largest reduction in this market while their market share rose by the greatest among three
airline groups. Likewise, the merger dummy for Delta-Northwest reflected its reduced airfare
during the post-merger period and placed the merged firm right behind legacy airlines. The
difference of the fare reduction between legacy airlines and Delta-Northwest was only 0.7
percent. While the change in the market share of legacy airlines accounted for a price increase
by 9.5 percent and 7.6 percent for Delta-Northwest, the market share of LCCs only
represented a price increase by 1.5 percent. Since the greater number of LCCs already offered
the lowest fare in this market, the least price drop seemed reasonable. However, it was found
that legacy and Delta-Northwest were quickly catching up with the low-cost carriers; both of
their fares decreased almost two folds than LCCs whereas their market shares increased
significantly during the post-merger period.
In comparison, the interaction terms for the market with the largest market share indicated
that each airline’s market share positively affected their airfare after merger, with Delta -Northwest’s gain being the greatest. Delta-Northwest’s market share after merger increased its fare by 29 percent while that of low-cost carriers’ only increased their fare by 6.6 percent.
On the other hand, the merger dummy suggested that the reduction in airfare was the greatest
for Delta-Northwest. While both merger dummy variables for legacy and LCCs are negatively
related with their fares, the intensity of fare reduction was almost three times greater for Delta.
In summary, Delta-Northwest showed the greatest gain in its market share on the city-pair
routes where they already had the largest market share while it had the biggest reduction in
airfare after merger compared to its counterparts. LCCs, to the contrary showed the least
reduction in their fare. Overall, the distance and the number of daily passenger were found to
be consistent throughout all the regression results; the distance was positively related with
fares while the passenger volume was negatively related. These were expected results,
because airfares are generally higher for the long-haul flights while higher load factor
Table 6 – Estimation Results
Model: (1) Fare low = α 0 + β1distance + β2pax + β3mksh + delm Ddelm + ccm Dccm + legmDlegm +
γ1(mksh* Ddelm) + γ2 (mksh* Dccm) +γ3 (mksh* D legm) +
N=4002; R2=0.4395
Variables Coefficient Standard Error t-value Prob>|t|
Constant 3.5865 0.0571 62.8000 <.0001 Distance 0.2694 0.0057 46.9055 <.0001 Passenger -0.0556 0.0048 -11.4990 <.0001
Market Share -0.0202 0.0051 -3.9568 0.0001
After Merger LCC -0.0580 0.0272 -2.1313 0.0331
After Merger Legacy -0.1747 0.0420 -4.1560 <.0001 After Merger Delta -0.1488 0.0468 -3.1786 0.0015
Mksh* After Merger LCC 0.0152 0.0079 1.9381 0.0527
Mksh* After Merger Legacy 0.0954 0.0138 6.9175 <.0001 Mksh* After Merger Delta 0.0765 0.0156 4.9206 <.0001
Model: (2) Farehigh = α 1 + β4 distance + β5pax + β6mksh+ delm Ddelm + ccm Dccm + legmDlegm +
γ4(mksh* Ddelm) + γ5 (mksh* Dccm) +γ6 (mksh* D legm) +
N=4002; R2=0.4617
Variables Coefficient Standard Error t-value Prob>|t|
Constant 3.7773 0.1084 34.8569 <.0001 Distance 0.2944 0.0071 41.7444 <.0001 Passenger -0.0444 0.0055 -8.0446 <.0001
Market Share -0.0888 0.0171 -531971 <.0001 After Merger LCC -0.3528 0.1090 -3.2352 0.0012
After Merger Legacy -0.3652 0.1477 -2.4730 0.0134 After Merger Delta -1.0589 0.1835 -5.7699 <.0001
Mksh* After Merger LCC 0.0656 0.0267 2.4584 0.0140
Mksh* After Merger Legacy 0.1373 0.0376 3.6484 0.0003 Mksh* After Merger Delta 0.2904 0.0454 6.3942 <.0001
Conclusion
This paper examined the Detal-Northwest merger in 2008 and its merger effect on different
airline groups in the U.S. domestic market. Two different markets were introduced where the
first market consisted of information on the airlines that offered the lowest fare on top 1,000
city-pair routes while the second market was comprised of the airlines with the largest market
share on the same routes. These two different markets were compared within each group with
the merger dummy showing the changes in the airafare in the post-merger period. In the
market share, only Delta-Northwest’s fare fell significantly while the other two airline groups’
fares increased. In another regression results with the interaction term between the market
share and the merger dummy, it was found that the airfares of legacy airlines and
Delta-Northwest decreased at a faster rate than the low-cost carriers. One noticeable fact is that fares
of legacy and Delta-Northwest decreased while their market shares increased simnultaneously,
irrepective of whether the airlines offered the lowest prices or had the largest market share on
each route.
As the empirical results showed, the merged firm altered its pricing behavior through its
merger while this affected the performance of non-merger airlines as well. As
Delta-Northwest aggressively lowered its fares through consolidation, non-merging airlines may
face an increased level of competition directly and indirectly. The US DOJ approved the
merger between Delta and Northwest Airlines based on the reasoning that potential
anticompetitive effects from the proposed merger would not outweigh the potential benefits
for consumers. While there were speculations over potential anticompetitiveness effects with
regard to the Delta-Northwest merger due to both airlines’ pre-existing market power in the
U.S. domestic market, the merged firm was actually found to facilitate price competition.
Indeed, the regression results in this paper confirmed the reduction in airfares on 1,000 most
popular domestic routes in the U.S. after the Delta-Northwest merger in 2008. Legacy airlines
and Delta-Northwest reduced their fares while increasing their market share at a faster rate
than low-cost carriers, which suggested more heightened competition across those airline
groups at the benefits for consumers, although more studies need to follow in subsequent
References
Berry, S. and Panle J. (2010) Tracing the Woes: An Empirical Analysis of the Airline Industry.
American Economic Journal, vol. 2, n. 3, pp. 1-43.
Borenstein, S. (2005) U.S. Domestic Airline Pricing, 1995-2004. Working Paper No. CPC05-48. Retrieved from EconWPA Website: http://129.3.20.41/eps/mac/papers/0501/0501006.pdf Borenstein, S. and Rose, N. L. (2007). How Airline Markets Work...Or Do They? Regulatory Reform
in the Airline Industry, Working Paper n. 13452.
Brueckner, J. K. Lee, D., and Singer, E. (2013) City-Pairs vs. Airport-Pairs: A Market-Definition
Methodology for the Airline Industry. Review of Industrial Organization, future edition.
Carlton, D. W., Landes, W. M. and Posner, R. A. (1980) Benefits and Costs of Airline Mergers: A Case Study, Bell Journal of Economics, vol. 11, n. 1, pp. 65-83.
Douglas , G. W. and Miller III, J.C. (1974) Quality Competition, Industry Equilibrium, and Efficiency in the Price-Constrained Airline Market. American Economic Review, vol. 64, n. 4, pp.657-669. Fageda X. and Perdiguero, J. (2011) An empirical analysis of a merger between a network and
low-cost airlines (Working Paper No. XREAP2011-01). Barcelona, Spain: Universitat de Barcelona.
Flouris, T. and Walker, T. J. (2005) The Financial Performance of Low-Cost and Full-Service Airlines in Times of Crisis. Canadian Journal of Administrative Sciences, vol. 22, pp.3–20.
Goetz, A. R. (2002) Deregulation, competition, and antitrust implications in the US airline industry,
Journal of Transport Geography, vol. 10, pp. 1-19
Hofer, C., Windle, R. J. and Dresner, M. E.(2008). Price premiums and low cost carrier competition.
Logistics and Transportation Review, vol., n., pp.44(5), 864-882.
Ito, H. and Lee, D. (2003) Low Cost Carrier Growth in the U.S. Airline Industry: Past, Present, and
Future, Working Paper n. 2003-12. Providence, RI: Brown University Economics Department.
Kim, E. H. and Singal, V. (1993) Mergers and Market Power: Evidence from the Airline Industry. The
American Economic Review, vol. 83, n. 3, pp.549-569.
Klein, J. and et al. (1999). Predation ‘strategy’ at American airlines: a change of heart at the justice department? Antitrust Law and Economics Review, pp. 93-110.
Kwoka J. and Shumilkina, E. (2010). The Price Effect of Eliminating Potential Competition: Evidence From An Airline Merger. Journal of Industrial Economics, vol. 58, n. 4, pp.767-793.
Lichtenberg, F. R. and Kim, M. (1989) The Effects of Mergers on Prices, Costs, and Capacity
Utilization in the U.S. Air Transportation Industry, NBER Working Paper n. 3197.
Morrison, S. A. (2000) The Proposed United-US Airways Merger: Hearing before the Committee on
Transportation and Infrastructure, United States House of Representatives. Retrieved from
Northeastern University Website: www.economics.neu.edu
Morrison, S. A. (1996) Airline Mergers: A Longer View. Journal of Transport Economics and Policy,
vol. 30, n. 3, pp.237-250.
Pels, E. (2008) Airline network competition: Full-service airlines, low-cost airlines and long-haul markets, Research in Transportation Economics, vol. 24, n. 1, pp.68-74.
Richard, O. (2003) Flight frequency and mergers in airline markets, International Journal of Industrial
Organization, vol. 21, n. 6, pp.907-922.
Tan, K. M. (2010) Incumbent Response to Entry by Low-Cost Carriers in the U.S. Airline Industry. Doctoral dissertation, The Ohio State University.
The American Antitrust institute. (2008) The Merger of Delta Air Lines and Northwest Airlines: An
Antitrust White Paper. Retrieved from www.antitrustinstitute.org.
Transportation Research Board, (1999) Entry and competition in the US airline industry: issues and
opportunities (Special report 255), National Research Council, Washington DC.
United States Department of Transportation (2007) Performance Measures in the Airline Industry.
United States General Accounting Office (2010) Issues Raised by the Proposed Merger of United and
Continental Airlines. Publication n. GAO-10-778T. Washington, DC: Susan Flemming.
United States General Accounting Office (2008) Airline Industry: Potential Mergers Acquisition
Driven by Financial and Competitive Pressures. Publication n. GAO-08-845. Washington, DC.
United States General Accounting Office (2004) Commercial Aviation: Despite Industry Turmoil,
Low-Cost Airlines Are Growing and Profitable. Publication n. GAO-04-837T. Washington, DC:
JayEtta Z. Hecker.
United States General Accounting Office (1996) Airline Deregulation: Changes in Airfares, Service,
and Safety at Small, Medium-Sized, and Large Communities. Publication n. GAO/RCED-96-79.
Washington, DC.
United States General Accounting Office (1993) Airline Competition: Higher Fares and Less
Competition Continue at Concentrated Airports. Publication n. GAO/RCED-93-171.
Washington, DC.
United States Department of Transportation (1990) Secretary’s Task Force on Competition in the US
Domestic Airline industry. Washington DC.
Vowles, T. M. (2006) Airfare pricing determinants in hub-to-hub markets. Journal of Transport
Geography, vol. 14, n. 1, pp.15-22.