ISSN 1678-992X
ABSTRACT: Gossypol easily pairs with lysine side chains and enzymes involved in the cellular
growth process. The effect of gossypol (a compound present in cotton co-products) in ruminant metabolism and meat quality is not yet clear. This study was undertaken in order to evaluate the effects of cotton co-products in lamb muscle proteome. Twenty-four Santa Inês ram lambs, 5-months old (20.6 ± 1.9 kg), were randomly assigned to four treatments: control (without cottonseed), whole cottonseed, cottonseed meal and high oil cottonseed meal. At 95 days into the experiment, lambs were slaughtered and samples from Longissimus dorsi were collected. Proteins were extracted and analyzed by 2-D electrophoresis. Spots showing a significant effect from the treatment (the “treatment effect”) and present in more than 90 % of the samples were identified using mass spectrometry. Cotton co-products decreased the abundance of aldehyde and malate dehydrogenases, creatine kinase M-type and Adenosine triphosphate (ATP) synthase. They also increased four proteins related to muscle contraction. Thus, feeding cotton co-prod-ucts to lambs changed the abundance of important muscle proteins. A cotton co-product diet in-duced a negative impact on the energy supply of muscle cells and, consequently, the abundance of ATP dependent proteins (contractile apparatus) increased, probably in order to offset and maintain muscle function. These proteomic changes can promote our understanding of altera-tions in the sensorial properties of meat due to cotton co-product diets in further investigaaltera-tions.
Keywords: gossypol, dehydrogenase, skeletal muscle, sheep, feedlot
Feeding effects of cottonseed and its co-products on the meat proteome from ram lambs
Tiago do Prado Paim1* , Pauline Viana3 , Mauricio Fraga van Tilburg4 , Arlindo de Alencar Moura4 , Jurandir Rodrigues de Souza5 ,Concepta McManus6 , Adibe Luiz Abdalla2 , Helder Louvandini2
1Instituto Federal de Educação, Ciência e Tecnologia Goiano, Av. Oeste, 350 – 76200-000 – Iporá, GO – Brasil. 2Universidade de São Paulo/CENA – Lab. Nutrição Animal, Av. Centenário, 303 – 13416-000 – Piracicaba, SP – Brasil. 3Universidade de Brasília/Faculdade de Agronomia e Medicina Veterinária, Ala Central do Instituto Central de Ciências – 70910-900 – Brasília, DF – Brasil.
4Universidade Federal do Ceará – Depto. de Zootecnia, C.P. 12168 – 60970-355 – Fortaleza, CE – Brasil.
5Universidade de Brasília/Instituto de Química – Lab. de Química Analítica e Ambiental, C.P. 04478.
6Universidade de Brasília/Instituto de Ciências Biológicas, C.P. 04508.
*Corresponding author <[email protected]> Edited by: Paulo Cesar Sentelhas
Received March 12, 2018 Accepted June 20, 2018
Introduction
Whole cottonseed and its co-products are alterna-tive feed sources for ruminants (Silva et al., 2016). This is an interesting feed because of its association of high protein content with high energy content, which per-mits the formulation of low-cost diets (Cranston et al., 2006). However, a major limitation for using cottonseed in animal nutrition is the presence of high levels of gos-sypol, which is a toxic compound that reacts with pri-mary amines, and leads to the formation of gossypol im-ines or Schiff bases (Gadelha et al., 2014). The biological activity of gossypol in mammals has been characterized by its easy coupling to lysine side chains of proteins and enzymes involved in the cellular growth process (Dao et al., 2000). In cattle, whole cottonseed was associated with problems in meat flavor (Costa et al., 2013), mainly liver-like flavor. However, the mechanisms associated with this problem are not yet clear.
Gossypol and its analogs were studied for a broad-spectrum of biological activities, including anti-parasit-ic, anti-malarial, anti-HIV and anticancer (Zhang et al., 2009). Gossypol is a promoter of free radical formation and much of its cytotoxicity has also been attributed to gossypolone, which represents the main in vivo metabo-lite of gossypol (Dao et al., 2000).
Replacement of soybean meal by cottonseed meal in hen feed reduced fifteen egg white proteins, causing adverse effects on albumen quality (He et al., 2017). In ruminants, the type of diet (more roughage or more grains) can alter the gossypol metabolism and
conse-quently impact the outcome of carcass traits and, thus, the meat quality (Oliveira et al., 2015). Therefore, the effect of gossypol in ruminant metabolism and meat quality remains unclear, including possible changes in enzyme activity and proteomic profile. Therefore, the aim of this study was to evaluate whether feeding cotton co-products to lambs can change the muscle proteome and if it can affect the muscle metabolism and the con-version of muscle to meat.
Materials and Methods
Experimental designThe animal care and use committee (protocol 33/2009) approved the experiment. Twenty-four San-ta Inês ram lambs (5-months old, 20.6 ± 1.9 kg) were housed in shaded individual pens as described by Paim et al. (2014). Four treatments were randomly assigned to the experimental units (lambs) in a complete random-ized design. The treatments were control diet without cottonseed (CTL); whole cottonseed (WCS); solvent-ex-tracted cottonseed meal (CSM); and pressure-exsolvent-ex-tracted high oil cottonseed meal (CSC) (Table 1).
Diets were calculated based on a fixed concentrate:forage ratio (50:50) aiming for 200 g d–1 of
body weight gain following NRC (2007) requirements (Table 1). The forage source was Coast cross hay
(Cyn-odon dactylon (L.) Pers). All groups received equal
quanti-ties of mineral salt (20 g kg–1) and urea (27 g kg–1). The fat
level in diets was equilibrated by adding soybean oil to the concentrate in CTL, CSM and CSC groups (Table 1).
Animal Science and Pastur
es
|
Resear
ch Ar
Lambs were fed two times per day (08h00 and 17h00), and the feed offered was adjusted daily aiming for orts equal to 10 % of offer. Animals were weighed every 15 days during the experiment, after a 12-h fast. The animals remained 109 days in the feedlot, consist-ing of a 14 day adaptation period and 95 days of experi-mentation.
Free gossypol concentrations in diets were mea-sured by the UV-VIS spectrophotometry method accord-ing to Wang (1987) and Botsoglou (1991). Ground diet samples (200 mg) were mixed with 10 mL of 70 % aque-ous acetone; 16 h later, 5 mL of 70 % aqueaque-ous acetone were added and shaken for 30 min. The mixture was fil-tered through filter paper and the residue washed three times with 2 mL of 70 % aqueous acetone each. The filtrate was evaporated to dryness in a nitrogen stream. The remaining residue was dissolved with 10 mL of chloroform:acetic acid (99:1, v/v) and refiltered through a 0.2 µm nylon membrane. The filtrate was analyzed in high performance liquid chromatography (HPLC) using the C18 column (250 × 4.6 mm). The wavelength de-tected was 254 nm.
Sample collection
At the end of the experiment, lambs were weighed and slaughtered at a commercial abattoir after a 24-h fast, according to Brazilian law (MAPA, 1980). After bleeding and evisceration, carcasses were kept at 2-4 °C for 24 h. Samples from the Longissimus dorsi muscle were collected 24 h post-mortem and frozen (-20 °C) for protein extraction.
Protein extraction from Longissimus dorsi muscle Samples of Longissimus dorsi muscle were minced and stored in sterile tubes at -20 °C until protein extrac-tion, in accordance with Sanchez et al. (2001). Five milli-grams of each muscle sample were placed in 100 µL of 1 % of TRITON-X 100 in ultra-purified water and refriger-ated at 5 °C for 1 h. Then, a 400 µL of sample buffer was added (7 M Urea, 2 M thiourea, 4 % 3-[(3-cholamidopro-pyl) dimethylammonio]-1-propanesulfonate (CHAPS), 2 % buffer IPG pH 4 – 7, 40 mM DTT [dithiothreitol]). Samples were sonicated for 5 min (4 °C) and centrifuged thereafter (5,000 g, 60 min, 4 °C), retaining the super-natant. Total protein was determined by Bradford’s method (Bradford, 1976), running in triplicate and using bovine serum albumin as standard.
Two-dimensional electrophoresis
Two-dimensional electrophoresis was carried out as previously described (Oliveira et al., 2015; Van Til-burg et al., 2013). Briefly, for the first dimension, 400 µg of Longissimus dorsi proteins were mixed with 250 µL of buffer (7 M urea, 2 M thiourea, 2 % free ampholytes, 2 % CHAPS, and 2 × 10⁻³ % of bromophenol blue). The
mix was incubated with 13-cm IPG strips (pH 4-7, lin-ear) and rehydrated for 14 h. Isoelectric focusing was carried out in an ETTAN IPGphor III isoelectric focusing system at 20 °C, according to the following sequence: 100 V for 30 min, 250 V for 1 h, 500 V for 1 h, 8,000 V for 2.5 h, totaling 50,000 Vh (Van Tilburg et al., 2013). After focusing, IPG strips were incubated for 20 min in an equilibration buffer I (6 M urea, 75 mM Tris pH 8.8, 29 % glycerol, 2 % SDS, 1 % DTT) and reequilibrated for an additional 20 min in buffer II (similar to equilibration buffer I, but containing 5 % iodoacetamide instead of DTT). After equilibration, the proteins were separated using SDS-PAGE (13 %) and run at 500 V, with 20 mA per gel (Hoefer SE 600). Low molecular weight markers (14.4; 20.1; 30.0; 45.0; 66.0; 97.0 Da) were used. Gels were stained in colloidal Coomassie blue (van Tilburg et al., 2013). In summary, gels were fixed in a solution containing phosphoric acid (2 %) and ethanol (30 %) overnight and washed three times for 20 min in 2 % phosphoric acid. Then, they were placed in another so-lution (2 % phosphoric acid, 18 % ethanol and 15 % am-monium sulfate) for 30 min followed by the addition of 2 mL of a Coomassie Blue G-250 solution (2 %) for 72 h. Gel analysis
Two-dimensional gels were scanned at 300 dpi and analyzed using the PDQuest software package (version 7.3.0; Bio-Rad). A master gel was generated to evalu-ate all 2-D maps in a single match (Moura et al., 2006; Oliveira et al., 2015). Spots consistently present in the remaining gels were added to the master. Each spot in each gel was checked with the respective pattern in the master gel. Based on PDQuest guidelines, protein abun-dances were given as parts per million of the total inte-grated optical density of spots in the gels.
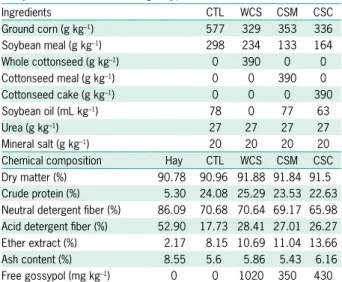
Table 1 – Experimental diet formulation, chemical composition (on
dry matter basis) and free gossypol content.
Ingredients CTL WCS CSM CSC Ground corn (g kg–1) 577 329 353 336 Soybean meal (g kg–1) 298 234 133 164 Whole cottonseed (g kg–1) 0 390 0 0 Cottonseed meal (g kg–1) 0 0 390 0 Cottonseed cake (g kg–1) 0 0 0 390 Soybean oil (mL kg–1) 78 0 77 63 Urea (g kg–1) 27 27 27 27 Mineral salt (g kg–1) 20 20 20 20 Chemical composition Hay CTL WCS CSM CSC Dry matter (%) 90.78 90.96 91.88 91.84 91.5 Crude protein (%) 5.30 24.08 25.29 23.53 22.63 Neutral detergent fiber (%) 86.09 70.68 70.64 69.17 65.98 Acid detergent fiber (%) 52.90 17.73 28.41 27.01 26.27 Ether extract (%) 2.17 8.15 10.69 11.04 13.66 Ash content (%) 8.55 5.6 5.86 5.43 6.16 Free gossypol (mg kg–1) 0 0 1020 350 430 CTL = without cottonseed by-products in diet; WCS = 20 % of whole cottonseed in diet; CSM = 20 % of cottonseed meal in diet; CSC = 20 % of high oil cottonseed meal in diet. Bromatological analysis were carried out for dry matter (DM), crude protein (CP), ether extract (EE) and ash content (A) using Association of Official Agricultural Chemistry (1995) procedures and neutral detergent fiber (NDF) and acid detergent fiber (ADF) according to Mertens et al. (2002).
Statistical analysis
Spot intensities were analyzed using a mixed model (MIXED procedure) in the SAS® 9.3 program (SAS
Institute, Cary, NC, USA). This model considered treat-ment as the fixed effect and animal as the random effect. Least square means with Tukey adjustment were used to compare means when a significant treatment effect (p < 0.05) was observed. The effect of free gossypol level (concentration in total diet) on proteins was tested us-ing a regression model (REG procedure; SAS®). Linear,
quadratic and cubic effects of gossypol level were tested through a stepwise selection method to determine the model that best fitted the results of protein abundance. The significant level for the dependent variable to re-main in the model was set at p < 0.05. Discriminant and factor analyses (DISCRIM and FACTOR procedures in SAS®, respectively) were carried out to identify which spots were able to discriminate between the treatments and the relation between the spots, respectively. Protein identification was carried out on spots showing signifi-cant treatment effects in analysis of variance or sig-nificant regression with gossypol level. Spots missed in more than 10 % of samples (animals) were not used for protein identification. As some spots appeared only in a few animals, this restriction was used to avoid bias due to small experimental sample.
Protein identification using electrospray ionization quadrupole-time-of-flight mass spectrometry
The selected spots were identified by tandem mass spectrometry following the method used by Van Tilburg et al. (2013). The spots were removed from gels and washed three times with 400 µL of acetronitrile (50 %) and ammonium bicarbonate (50 %; 25 mM at pH 8.0). Then, the pieces were passed through a double wash with 200 µL of acetonitrile for 5 min followed by air-drying at room temperature. After, a trypsin (166 ng per spot) incubation for 20 h at 37 °C was carried out. At the end, peptides were extracted using three washings with 5 % trifluoroacetic acid, 50 % acetonitrile, and am-monium bicarbonate (50 mM) and concentrated using a speed vacuum concentrator.
Chromatographic separation was carried out us-ing a UPLC C18 column (75 µm × 10 cm) with a flow of 0.6 µL min–1. A nanoAcquity UPLC sample manager
was used to inject the digested samples. The mass spec-tra were acquired in a Synapt G2 HDMS Acquity UPLC instrument. Three top peaks were subjected to MS/MS. Mobile phases A and B were 10–1 % formic acid in water
and 10–1 % formic acid in acetonitrile, respectively. The
gradient conditions used were 0 minutes with 3 % of B; increasing linearly to 30 % B in 20 min; then up to 70 % B in 40 min, remaining there for 50 min; and then decreasing to 3 % of B.
Data were subjected to a database search using a MASCOT search engine (http://www.matrixscience. com). The searches were made on the assumption that there were a maximum of one missed trypsin cleavage,
partially oxidized methionine residues, completely carb-amidomethylated cysteine residues, and that peptides were monoisotopic. Peptide and fragment mass toler-ance were set to ± 0.1 Da for MS/MS ion searching. When manually reviewing MASCOT search results, the candidate peptide identifications were only accepted if the m/z values observed were within 0.1 Da (typically less than 0.05 Da) of the theoretical mass of the candi-date protein.
In silico analysis of protein interactions
The proteins identified by mass spectrometry were submitted to protein-protein interaction analysis, considering known and predicted interactions, using the STRING biological database (http://string-db.org), ver-sion 9.1 (Rego et al., 2014). Bos taurus was set as the or-ganism (as Ovis aries is not available). Only proteins with a confidence score above 0.90 were selected for analysis. Interactions in evidence were based on co-expression (black lines), databases (light blue), text-mining (yellow), and experimental (purple) data. Interactions in action mode represent reaction (black lines), binding (blue), or catalysis (purple).
Results
The average daily weight gain was 138 ± 8.0 g d–1,
without any treatment effect. The estimated free gos-sypol (FG) intake per treatment was 0, 16.32, 6.98 and 5.47 mg kg–1 of body weight (BW) for CTL, WCS, CSC
and CSM, respectively (Table 1).
An average of 170 ± 32.4 protein spots was detect-ed after analysis of 24 gels with proteins extractdetect-ed from
Longissimus dorsi (Figure 1). Twenty-nine spots were
dif-ferentially expressed between treatments and 22 spots yielded significant relationships with gossypol levels in the diet, as determined by regression analysis (Table 2). Figure 2 shows the least square means for protein abun-dances of the spots showing treatment effects (p < 0.05) which appeared in more than 90 % of the samples. Table 3 describes the regression indices for linear, quadratic and cubic effect of gossypol on protein abundances.
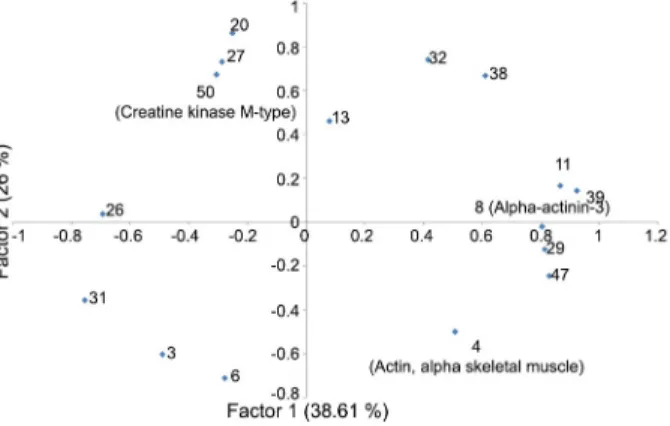
Twenty spots discriminated correctly the animals into their respective treatment group (100 % of the ani-mals were correctly located in their group). These spots were 36, 9, 49, 14, 25, 19, 48, 35, 21, 24, 2, 17, 37 and 1, following the order they entered in the model. The first factor (Figure 3) demonstrated a group of spots (11, 39, 8, 29 and 47) that increased in intensity while others (26 and 31) decreased. The second factor showed another group of spots (20, 27, 50, 13, 38 and 32) that increased in intensity when spots 3, 4 and 6 decreased.
Eleven protein spots that differed between treat-ments were identified as eight muscle proteins (Table 4). All these spots were present in at least 90 % of the samples. Spots 4 and 12 were identified as actin of al-pha skeletal muscle (ACTA1) and both spots presented a positive cubic regression effect in relation to gossypol
level in the diet (Table 3). The WCS diet (1020 mg kg–1)
had more than twice the free gossypol concentration than CSM and CSC (350 and 430 mg kg–1, respectively).
This can yield significant cubic regression in the range of free gossypol concentration evaluated, depending on the shape of the regression curve, such as, for example, a plateau between CSM and CSC.
Spot 8 was identified as alpha-actinin-3 (ACTN3) and its intensity in the 2-D gels had a positive quadratic association with the gossypol level in the diet (Table 3). Spots 5, 40 and 41 represented troponin T of fast skeletal muscle (TNNT3). The control group had a lower expres-sion of spot 5 compared to other animals. Spot 5 also had a positive linear relation with gossypol levels of the diets. Control animals had a lower content of spot 40 in comparison with rams of CSC and CSM treatments. The CSC group had a greater expression of spot 41 than CTL and WCS groups. Spot 10 was identified as a myo-sin light chain (MYL1) and its intensity also had a posi-tive and linear association with certain levels of dietary gossypol. Creatine kinase M-type (CKM) demonstrated a negative linear regression with gossypol level in diet. CKM appeared in the factor analysis (Factors 1 and 2) in opposition to ACTN3 and ACTA1, showing that when the first decreased, the others increased, and vice-versa.
In silico analysis of interactomes showed associations
(evidence and action) between TNNT3, ACTN3, MYL1 and CKM. Additionally, TNNT3 presented binding ac-tion with ACTN3, CKM and MYL1.
Chain D of Bovine Mitochondrial F1-Atpase com-plexed with Aurovertin B (ATP5B), spot 7, had a negative linear regression with certain gossypol levels. Spot 33 was identified as Malate dehydrogenase (MDH1), which was influenced by treatment and gossypol level in diet. The WCS group had lower MDH1 compared to CTL and CSM. MDH1 also presented a negative quadratic rela-tionship with dietary levels of gossypol.
Spot 42, identified as Aldehyde dehydrogenase (ALDH1B1), showed lower expression in WCS compared to CTL and CSC. The intensity of spot 42 had a nega-tive quadratic association with gossypol level in diet. ALDH1B1 interacts with some other detoxification en-zymes, such as Aldose reductase (AKR1B1), Alcohol de-hydrogenase (AKR1A1), Methylmalonate-semialdehyde dehydrogenase (ALDH6A1), Glutamate decarboxylase 1 (GAD1) and Gamma-amino-N-butyrate transaminase (ABAT).
Table 2 – Summary of statistical analysis using mixed model
(MIXED) and regression (REG) analyses, evaluating the effect of co-products fed to lambs on protein (spot) abundance from muscle samples.
Spot number (p-value)MIXED REG (p-value) Frequency1 gos gos2 gos3
% 4 0.073 ns ns 0.0201 100 5 0.001 0.0184 ns ns 96 7 0.0669 0.047 ns ns 100 8 0.0787 ns 0.0092 ns 100 9 0.0068 ns ns 0.0008 52 10 0.0515 0.0421 ns ns 96 12 ns ns ns 0.0218 100 16 0.0317 ns ns ns 61 22 0.0271 ns ns 0.0091 78 23 0.0403 ns ns ns 70 25 0.0257 ns ns ns 48 30 0.0326 ns ns ns 48 33 0.0256 ns 0.0031 ns 100 34 ns 0.0254 ns ns 48 36 0.0018 ns ns ns 57 40 0.0087 ns ns ns 91 41 0.0204 ns ns ns 96 42 0.0415 ns 0.0057 ns 96 43 ns ns ns 0.0335 74 44 ns ns ns 0.0232 87 45 0.0943 0.0102 ns ns 87 46 0.0599 ns ns 0.0262 74 49 0.0037 0.0142 0.0275 ns 61 50 0.0866 0.0238 ns ns 91 51 0.0073 ns ns 0.0009 78 52 0.093 ns 0.0107 ns 74 53 0.0184 ns ns 0.0088 70
1Percentage of animals that presented spots; ns = not significant (p > 0.10). Spots highlighted in bold were selected for protein identification, as they occurred in more than 90 % of samples and had p < 0.05 in mixed model or by regression analysis. gos = linear effect of gossypol concentration in diet; gos2 = quadratic effect of gossypol concentration in diet; gos3 = cubic effect of gossypol concentration in diet.
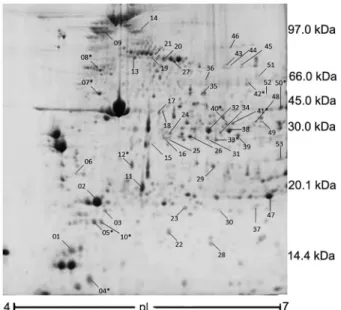
Figure 1 – 2-D map of proteins of the Longissmus dorsi muscle
from lambs fed with cotton co-products. The map represents the master gel generated by the software package (version 7.3.0; Bio-Rad), based on a matched set with all gels used in the study. Proteins were stained with Coomassie blue and identified using mass spectrometry. *Refers to those spots identified and shown in Table 4; pI = isoelectric point.
Discussion
The directive 2002/32 of the European Union (2002L0032 - EN - 26.02.2013 - 017.001) states that the maximum free gossypol concentrations for complete feeding stuff are 100 ppm for calves, and 500 ppm for cattle, sheep, and goats. The WCS diet had 1,020 ppm of free gossypol and the other diets had less than 500 ppm. Therefore, only the WCS diet was above the adjudged safety guidelines.
Our previous results had shown that lambs fed with cottonseed meal have a higher hot carcass weight, carcass dressing and Longissimus dorsi muscle area than lambs receiving whole cottonseed. Meat from lambs
that received whole cottonseed had less unsaturated fatty acids, conjugated linoleic acid (CLA) and vaccenic acid (Paim et al., 2014). The meat from lambs that did not receive cotton co-products had higher n-3 fatty ac-ids, and also better n-6 to n-3 ratio than meat from lambs that received cotton co-products (Paim et al., 2014). The
Figure 2 – Least square mean differences of protein abundances from the Longissmus dorsi muscle from lambs fed with four diets: control
without use of cottonseed (CTL), solvent-extracted cottonseed meal (CSM); pressure-extracted high oil cottonseed meal (CSC) and whole cottonseed (WCS). Different letters at same spot means statistical difference between treatments (p < 0.05).
Figure 3 – Factor analysis of protein abundances from the
Longissmus dorsi muscle from lambs fed with whole cottonseed,
cottonseed meal with low oil, cottonseed meal with high oil and a control without use of cottonseed. The values in parentheses show the percentage of variance explained by each factor. The bold highlighted spots were identified by mass spectrometry.
Table 3 – Regression coefficients for linear (gos), quadratic (gos2)
and cubic (gos3) effect of gossypol on protein abundance. Spot Intercept gos gos2 gos3 Model R2
4 10427359 1400.197 0.2316 5 3171371 200425 0.2374 7 12253578 -258032 0.1749 8 1973135 5498.109 0.2817 9 813743 1547.66 0.4241 10 1838309 189750 0.1824 12 3966853 436.0555 0.2264 22 1885851 594.9487 0.2822 33 10868348 -22019 0.3479 34 123143 113436 0.2162 42 5176223 -9634.58 0.3114 43 1140772 -155.478 0.1978 44 3999369 -509.546 0.2222 45 4328480 -158990 0.2749 46 2213568 -320.842 0.214 49 67638 376288 -16012 0.4184 50 13143413 -361667 0.2204 51 4193280 -739.289 0.417 52 3527150 -9220.79 0.2721 53 3056220 1192.338 0.2844
R2 = coefficient of determination. Spots highlighted in bold were selected for protein identification, as they showed frequency higher than 90 % and p < 0.05 in mixed model or regression analysis. gos = linear effect of gossypol concentration in diet; gos2 = quadratic effect of gossypol concentration in diet; gos3 = cubic effect of gossypol concentration in diet.
Table 4 – Proteins differentially expressed in Longissmus dorsi muscle from lambs fed with cotton co-products identified by two-dimensional
electrophoresis and mass spectrometry.
Protein ExperimentalkDa/pI 1 NCBI or SWISS-PROT accession number MS/MS protein score Sequence coverage Matched peptides2 Ion score m/z z %
Actin, alpha skeletal muscle [Bos taurus]
Spot 4 11.31/4.89 ACTS_BOVIN 254 13 (21)AGFAGDDAPR(30) 86 488.7235 2
(42)HQGVMVGMGQK(52) 46 586.2895 2 (53)DSYVGDEAQSK(63) 52 599.7650 2 (98)VAPEEHPTLLTEAPLNPK(115) 30 652.6765 3 Spot 12 22.66/5.42 gi|27819614 427 27 (98)VAPEEHPTLLTEAPLNPK (115) 27 652.6845 3 (186)DLTDYLMK (193) 32 507.7443 2 (199)GYSFVTTAER(208) 47 565.7781 2 (241)SYELPDGQVITIGNER(256) 73 895.9522 2 (294)DLYANNVMSGGTTMYPGIADR(314) 76 1139.9984 2 (318)EITALAPSTMK(328) 43 581.3148 2 (331)IIAPPER(337) 38 398.2374 2 (362)QEYDEAGPSIVHR(374) 92 750.8587 2 Alpha-actinin-3 [Ovis Áries]
Spot 8 68.22/5.06 gi|426252090 599 12 (418)ASLHEAWTR(426) 29 535.7727 2
(427)GKEEMLSQR(435) 48 539.2728 2 (436)DYETASLQEVR(446) 76 655.8167 2 (581)GAILGIQGEIQK(592) 37 613.8616 2 (671)LAAGMAGSLEEQMAGLR(687) 109 860.9241 2 (688)QQEQNIINYK(697) 40 639.3274 2 (720)HTVYSMEHIR(729) 44 430.2057 3 (742)TINEVENQVLTR(753) 86 708.3787 2 (757)GLSQEQLNEFR(767) 88 660.8319 2 (851)NYITAEELR(859) 53 554.7860 2 Troponin T, fast skeletal muscle [Ovis aries]
Spot 5 15.71/4.96 gi|426258858 87 7 (95)VDFDDIQK(102) 27 490.2419 2
(108)DLMELQALIDSHFEAR(123) 60 635.9118 3 Spot 40 33.75/6.42 gi|426258858 222 13 (193)ALSSMGANYSSYLAK (207) 114 789.8764 2 (249) ELWDTLYK (256) 24 534.2742 2 (257) LETDKFEYGEK (267)
(273) YDIMNVR (279) 4840 679.8258463.7242 22 Fast skeletal muscle troponin T [Capra hircus]
Spot 41 33.87/6.51 gi|347597734 309 21 (62)VDFDDIQK (69) 31 490.2418 2
(75)DLMELQALIDSHFEAR (90) 74 635.3099 3 (154)ALSSMGANYSSYLAK (168) 100 789.8775 2 (218)LETDKFEYGEK (228) 65 679.8278 2 (234)YDITNLR (240) 39 447.7354 2 Myosin light chain 1/3, skeletal muscle isoform
Spot 10 15.70/5.06 MYL1_BOVIN 60 10 (68)ITLSQVGDVLR(78) 50 600.8533 2
(152)HVLATLGEK(160) 10 484.2826 2 Chain D, Bovine Mitochondrial F1-Atpase Complexed with Aurovertin B
Spot 7 49.09/5.05 gi|1827812 1122 51 (49)LVLEVAQHLGESTVR(63) 47 550.9759 3 (64)TIAMDGTEGLVR(75) 95 639.8223 2 (79)VLDSGAPIR(87) 70 464.2671 2 (88)IPVGPETLGR(97) 60 519.7972 2 (98)IMNVIGEPIDER(109) 59 693.3576 2 (143)VVDLLAPYAK(152) 45 544.8226 2 (156)IGLFGGAGVGK(166) 52 488.2822 2 (167)TVLIMELINNVAK(179) 63 737.4200 2 (180)AHGGYSVFAGVGER(193) 89 703.8450 2 (196)EGNDLYHEMIESGVINLK(213) 43 687.6683 3 (219)VALVYGQMNEPPGAR(233) 90 801.4119 2 Continue
hematological and serum biochemical parameters re-mained within the reference range values established for lambs (Viana et al., 2015). Gossypol residues in the carcass were not detected and, therefore, it is reason-able to assume that gossypol concentration in meat was below 20 ppb (Viana et al., 2015).
The present study shows how feeding cotton co-products can change the proteomic profile of meat. The proteomics approach enabled the identification of eight proteins of Longissimus dorsi altered by cottonseed co-products in diet. The Longissimus dorsi comprised pre-dominantly type II fibers (80 %) with 50 % being type II B fibers. This muscle represents a uniquely anaerobic muscle, with major economic importance to the meat
in-dustry (Baldwin et al., 2012). These proteomic changes can affect the physiological function of muscle in live animals and/or impair the muscle to meat conversion, which can promote modifications in organoleptic char-acteristics of meat.
Cotton co-products fed to lambs promoted an in-crease in ACTA1, ACTN3, TNNT3 and MYL1 in
Lon-gissimus dorsi, which are responsible for ATP binding
and transport (ACTA1), actin and tropomyosin binding (ACTN3) and regulation of myosin (TNNT3 and MYL1), respectively. Therefore, cotton co-products fed to lambs affected the main factors involved in muscle contrac-tion, mainly fast muscle function. Fast muscle activity is crucial to the decline of pH during the conversion of (236)VALTGLTVAEYFR(248) 99 720.3963 2 (265)FTQAGSEVSALLGR(278) 93 718.3800 2 (279)IPSAVGYQPTLATDMGTMQER(299) 62 761.3620 3 (342)AIAELGIYPAVDPLDSTSR(360) 32 663.3464 3 (361)IMDPNIVGSEHYDVAR(376) 64 611.2907 3 (381)ILQDYK(386) 21 390.2176 2 (417)FLSQPFQVAEVFTGHLGK(434) 39 669.0192 3 Malate dehydrogenase, cytoplasmic
Spot 33 28.68/6.33 gi|77736203 412 23 (67)DVIATDKEEIAFK (79) 69 739.8928 2 (126)VIVVGNPANTNCLTASK (142) 86 879.4602 2 (150)ENFSCLTR (157) 52 513.7374 2 (171)LGVTSDDVK (179) 49 467.2492 2 (221)GEFITTVQQR (230) 54 589.8104 2 (299)VVEGLPINDFSR (310) 65 673.3597 2 (311)EKMDLTAK (318) 37 468.2466 2 Creatine kinase M-type [Ovis aries]
Spot 50 38.96/6.91 gi|426243021 537 27 (33)ALTLEIYK(40) 37 475.7819 2
(87)DLFDPIIQDR(96) 57 616.3205 2 (108)TDLNHENLK(116) 24 542.2751 2 (117)GGDDLDPHYVLSSR(130) 34 510.9094 3 (157)LSVEALNSLTGEFK(170) 94 754.4043 2 (260)IEEIFKK(266) 27 453.7676 2 (321)GTGGVDTAAVGSVFDVSNADR(341) 125 997.9760 2 (359)LMVEMEK(365) 31 448.2167 2 (370)GQSIDDMIPAQK(381) 51 659.8192 2 Aldehyde dehydrogenase, mitochondrial isoform 1 [Ovis Áries]
Spot 42 53.13/6.70 gi|426247368 683 33 (56)TFPTVNPSTGDVICHVAEGDKADVDR(81) 45 700.8322 4 (88)AAFQLGSPWR(97) 36 566.7995 2 (151)YYAGWADK(158) 43 487.2257 2 (163)TIPIDGDYFSYTR(175) 77 774.3726 2 (199)LGPALATGNVVVMK(212) 57 685.3979 2 (213)VAEQTPLTALYVANLIK(229) 42 922.5323 2 (261)VAFTGSTEVGHLIQVAAGK(279) 40 629.0071 3 (350)VVGNPFDSR(358) 74 495.7542 2 (359)TEQGPQVDETQFK(371) 48 753.8591 2 (387)LLCGGGAAADR(397) 66 530.7637 2 (418)EEIFGPVMQILK(429) 23 710.3834 2 (445)YGLAAAVFTK(454) 46 520.7926 2 (496)ELGEYGLQAYTEVK(509) 51 800.3995 2 MS/MS = mass spectrometry/mass spectrometry; NCBI = National Center for Biotechnology Information; pI = isoelectric point; m = mass; z = charge; 1Experimental values were deduced from the 2D map by the PDQuest software package (version 7.3.0; Bio-Rad); 2Superscript numbers in parenthesis relate to the position of each peptide within the amino acid sequence of the complete protein, according to database search using Mascot search engine.
muscle to meat. A higher abundance of fast muscle pro-teins, as seen here in gossypol treated animals, was re-lated to rapid pH decline, resulting in high drip loss (An-dersen et al., 2005). If post mortem pH decreases rapidly, while muscle temperature is still high, myosin heads denature and shrink, which contribute to myofibrillar lateral shrinkage (Offer, 1991). The denatured myosin had a lower capacity for binding water, decreasing water holding capacity, which in extreme cases leads to pale, soft and exudative (PSE) meat (Offer, 1991).
There was a negative linear regression of gossy-pol in dehydrogenases enzymes. Consequently, the meat from animals fed cottonseed had the lowest abundance of these proteins. Cotton co-products decreased two en-zymes involved in cell detoxification and cell protection processes (ALDH1B1 and MDH1). Gossypol is known to inhibit dehydrogenases including lactate dehydrogenase, malate dehydrogenase, glutamate dehydrogenase, alcohol dehydrogenase, glyceraldehyde-3-P dehydrogenase, alde-hyde dehydrogenase, 11β-hydroxysteroidehydrogenase, 3α,20β-hydroxysteroid dehydrogenase, 5a- reductase and glucose-6-P dehydrogenase (Chen et al., 2009; Van der Jagt et al., 2000; Zhang et al., 2009). Gossypol has the ability to selectively bind at the dinucleotide fold, promoting inhibition of these enzymes (Van der Jagt et al., 2000). Therefore, the lower ALDH level found in all the cottonseed fed rams may be associated with a low detoxification capacity, and could be related to other biological activities of gossypol, including anti-parasit-ic, anti-malarial, anti-HIV and anticancer (Zhang et al., 2009; 2012).
In summary, the abundance of four proteins (ACTA1, ACTN3, TNNT3 and MYL1) from the contrac-tile apparatus, mainly fast muscle type, were increased by feeding cotton co-products to lambs. On the other hand, cotton co-products promoted a down-regulation of two enzymes related to different steps of ATP supply to the cell (CKM and ATP5B), which is needed for muscle contraction.
The main known gossypol targets are the glyco-lytic (ATP production) and dehydrogenase enzymes (Dao et al., 2000; Deck et al., 1999; Gizejewski et al., 2008). ACTA1, ACTN3 and TNNT3 are related mainly to the fast muscle type, which is a highly energy dependent cell (Garton et al., 2014; Seto et al., 2013; Huang et al., 2012). MYL1 is an ATP dependent protein (Polati et al., 2012). Lametsch et al. (2006) found that the intensity of both MYL1 and MYL2, measured 48 h after slaugh-ter, was increased by compensatory growth, which indi-cated greater proteolytic activity postmortem. Probably, the contractile proteins were upregulated, aiming to equilibrate the lack of energy supply, and prevent losses in muscle function.
During the conversion of muscle to meat, pH de-crease occurs due to the anaerobic conversion of gly-cogen resulting in a build-up of hydrogen ions through the formation of lactic acid (Dikeman and Devine, 2014). Depending on muscle type and glycogen concentration,
pH decreases from 7.0 in live muscle to pH 5.4 to 6.3 (mean around 5.5-5.6) in meat (Dikeman and Devine, 2014). The gossypol effects on Longissimus dorsi proteins found in the current study seem to promote a low gly-cogen stock associated with a high fast-muscle function. These effects can promote fast glycogen consumption with fast pH decline during the first step of conversion of muscle to meat. However, they can lead to high pH at the end of the process due to the low glycogen stock at the beginning. Therefore, some problems can arise in meat processing and storage when the meat comes from cotton co-products-fed animals (mainly whole cot-tonseed). These problems could be biologically related to alterations in meat flavor; however, to confirm this hypothesis, further studies evaluating the associations between sensory properties and proteomic profile of meat are required.
Conclusion
Feeding cotton co-products to lambs changed the abundance of important muscle proteins, mainly related to fast muscle function. ATP synthesis and dehydroge-nase enzymes were the main metabolic pathways af-fected by the cotton co-products diets. Therefore, gos-sypol had a negative impact on cell energy supply and, consequently, in order to maintain muscle function, the abundance of ATP dependent proteins (contractile ap-paratus) increased.
Acknowledgments
To the Conselho Nacional de Desenvolvimento Científico e Tecnológico (CNPq) and Ministério da Ag-ricultura, Pecuária e Abastecimento (MAPA) (edital 64), Instituto Nacional de Ciência e Tecnologia de Informa-ção Genético-Sanitária da Pecuária Brasileira (INCT-Pecuária), Coordenação de Aperfeiçoamento de Pessoal de Nível Superior (CAPES) and Fundação de Amparo à Pesquisa do Estado de São Paulo (FAPESP) for provid-ing financial support and scholarships, and the Instituto Federal Goiano for supporting the publication process. To Frederico B.M.B. Moreno, Ana Cristina O. Monteiro-Moreira and Renato A. Monteiro-Moreira for performing the pro-teomic analysis.
Authors’ Contributions
Conceptualization: Paim, T.P.; Souza, J.R.; McMa-nus, C.; Louvandini, H. Live animal data acquisition: Paim, T.P.; Viana, P. Gossypol determination: Souza, J.R. Proteomic data acquisition: Van Tilburg, M.F.; Moura, A.A. Data analysis: Paim, T.P.; Van Tilburg, M.F. Design of Methodology: Paim, T.P.; Moura, A.A.; Souza, J.R.; McManus, C.; Abdalla, A.L.; Louvandini, H. Writing: Paim, T.P.; Louvandini, H. Proof reading and editing: Van Tilburg, M.F.; Moura, A.A.; Souza, J.R.; McManus, C.; Abdalla, A.L.
References
Andersen, H.J.; Oksbjerg, N.; Young, J.F.; Therkildsen, M. 2005. Feeding and meat quality: a future approach. Meat Science 70: 543-554.
Baldwin, R.L.; Li, R.W.; Li, C.-J.J.; Thomson, J.M.; Bequette, B.J. 2012. Characterization of the longissimus lumborum transcriptome response to adding propionate to the diet of growing Angus beef steers. Physiological Genomics 44: 543-550.
Botsoglou, N.A. 1991. Determination of “free” gossypol in cottonseed and cottonseed meals by second-derivative ultraviolet spectrophotometry. Journal of Agricultural and Food Chemistry 39: 478-482.
Bradford, M.M. 1976. Rapid and sensitive method for quantitation of microgram quantities of protein utilizing principle of protein-dye binding. Analytical Biochemistry 72: 248-254. Chen, B.-B.; Lin, H.; Hu, G.-X.; Su, Y.; Zhou, H.-Y.; Lian,
Q.-Q.; Cai, H.; Hardy, D.O.; Gu, D.-Y.; Ge, R.-S. 2009. The (+)- and (−)-gossypols potently inhibit human and rat 11β-hydroxysteroid dehydrogenase type 2. The Journal of Steroid Biochemistry and Molecular Biology 113: 177-181. Costa, D.P.B.; Roça, R.O.; Costa, Q.P.B.; Lanna, D.P.D.; Lima,
E.S.; Barros, W.M. 2013. Meat characteristics of Nellore steers fed whole cottonseed. Revista Brasileira de Zootecnia 42: 183-192.
Cranston, J.J.; Rivera, J.D.; Galyean, M.L.; Brashears, M.M.; Brooks, J.C.; Markham, C.E.; McBeth, L.J.; Krehbiel, C.R. 2006. Effects of feeding whole cottonseed and cottonseed products on performance and carcass characteristics of finishing beef cattle. Journal of Animal Science 84: 2186-2199.
Dao, V.T.; Gaspard, C.; Mayer, M.; Werner, G.H.; Nguyen, S.N.; Michelot, R.J. 2000. Synthesis and cytotoxicity of gossypol related compounds. European Journal of Medicinal Chemistry 35: 805-813.
Deck, L.M.; Chamblee, B.B.; Royer, R.E.; Hunsaker, L.A.; Van der Jagt, D.L. 1999. Inhibition of aldose reductase by gossypol and gossypol-related compounds. Advances in Experimental Medicine and Biology 463: 487-492.
Dikeman, M.; Devine, C. 2014. Encyclopedia of Meat Sciences. 2ed. Academic Press, San Diego, CA, USA.
Gadelha, I.C.N.; Fonseca, N.B.S.; Oloris, S.C.S.; Melo, M.M.; Soto-Blanco, B. 2014. Gossypol toxicity from cottonseed products. The Scientific World Journal 2014: 4-6.
Garton, F.C.C.; Seto, J.T.T.; Quinlan, K.G.R.G.; Yang, N.; Houweling, P.J.J.; North, K.N.N. 2014. α-Actinin-3 deficiency alters muscle adaptation in response to denervation and immobilization. Human Molecular Genetics 23: 1879-1893. Gizejewski, Z.; Szafranska, B.; Steplewski, Z.; Panasiewicz,
G.; Ciereszko, A.; Koprowski, H. 2008. Cottonseed feeding delivers sufficient quantities of gossypol as a male deer contraceptive. European Journal of Wildlife Research 54: 469-477.
He, T.; Zhang, H.; Wang, J.; Wu, S.; Yue, H.; Qi, G. 2017. Proteomic comparison by iTRAQ combined with mass spectrometry of egg white proteins in laying hens (Gallus gallus) fed with soybean meal and cottonseed meal. PLoS One 12: e0182886.
Huang, M.; Huang, F.; Ma, H.; Xu, X.; Zhou, G. 2012. Preliminary study on the effect of caspase-6 and calpain inhibitors on postmortem proteolysis of myofibrillar proteins in chicken breast muscle. Meat Science 90: 536-542.
Lametsch, R.; Kristensen, L.; Larsen, M.R.; Therkildsen, M.; Oksbjerg, N.; Ertbjerg, P. 2006. Changes in the muscle proteome after compensatory growth in pigs. Journal of Animal Science 84: 918-924.
Ministério da Agricultura, Pecuária e Abastecimento [MAPA]. 1980. Regulation of the Industrial and Sanitary Insepction of Animal Food Products = Regulamento da Inspeção Industrial e Sanitária de Produtos de Origem Animal. MAPA, Brasília, DF, Brazil (in Portuguese).
Moura, A.A.; Koc, H.; Chapman, D.A.; Killian, G.J. 2006. Identification of proteins in the accessory sex gland fluid associated with fertility indexes of dairy bulls: a proteomic approach. Journal of Andrology 27: 201-211.
Nutrients Requirement Council [NRC]. 2007. Nutrient Requirements of Small Ruminants: Sheep, Goats, Cervids, and New World Camelids. The National Academies Press, Washington, DC, USA.
Offer, G. 1991. Modelling of the formation of pale, soft and exudative meat: effects of chilling regime and rate and extent of glycolysis. Meat Science 30: 157-184.
Oliveira, C.H.A.; Silva, A.M.; Silva, L.M.; van Tilburg, M.F.; Fernandes, C.C.L.; Moura, A.A.; Moreno, F.B.M.B.; Monteiro-Moreira, A.C.O.; Moreira, R.A.; Bezerra, F.J.; Rondina, D. 2015. Meat quality assessment from young goats fed for long periods with castor de-oiled cake. Meat Science 106: 16-24.
Paim, T.P.; Viana, P.; Brandão, E.; Amador, S.; Barbosa, T.; Cardoso, C.; Dantas, A.M.M.; Souza, J.R.; McManus, C.; Abdalla, A.L.; Louvandini, H. 2014. Carcass traits and fatty acid profile of meat from lambs fed different cottonseed by-products. Small Ruminant Research 116: 71-77.
Polati, R.; Menini, M.; Robotti, E.; Millioni, R.; Marengo, E.; Novelli, E.; Balzan, S.; Cecconi, D. 2012. Proteomic changes involved in tenderization of bovine Longissimus dorsi muscle during prolonged ageing. Food Chemistry 135: 2052-2069.
Rego, J.P.A.; Crisp, J.M.; Moura, A.A.; Nouwens, A.S.; Li, Y.; Venus, B.; Corbet, N.J.; Corbet, D.H.; Burns, B.M.; Boe-Hansen, G.B.; McGowan, M.R. 2014. Seminal plasma proteome of electroejaculated Bos indicus bulls. Animal Reproduction Science 148: 1-17.
Sanchez, J.-C.C.; Chiappe, D.; Converset, V.; Hoogland, C.; Binz, P.-A.A.; Paesano, S.; Appel, R.D.; Wang, S.; Sennitt, M.; Nolan, A.; Cawthorne, M.A.; Hochstrasser, D.F. 2001. The mouse SWISS-2D PAGE database: a tool for proteomics study of diabetes and obesity. Proteomics 1: 136-163.
Seto, J.T.; Quinlan, K.G.R.; Lek, M.; Zheng, X.F.; Garton, F.; MacArthur, D.G.; Hogarth, M.W.; Houweling, P.J.; Gregorevic, P.; Turner, N.; Cooney, G.J.; Yang, N.; North, K.N. 2013. ACTN3 genotype influences muscle performance through the regulation of calcineurin signaling. Journal of Clinical Investigation 123: 4255-4263.
Silva, R.V.M.M.; Carvalho, G.G.P.; Pires, A.J.V.; Pereira, M.L.A.; Pereira, L.; Campos, F.S.; Perazzo, A.F.; Araújo, M.L.G.M.L.; Nascimento, C.O.; Santos, S.A.; Tosto, M.S.L.; Rufino, L.M.A.; Carvalho, B.M.A. 2016. Cottonseed cake in substitution of soybean meal in diets for finishing lambs. Small Ruminant Research 137: 183-188.
Van Tilburg, M.F.; Rodrigues, M.A.; Moreira, R.A.; Moreno, F.B.; Monteiro-Moreira, A.C.; Cândido, M.J.; Moura, A.A. 2013. Membrane-associated proteins of ejaculated sperm from Morada Nova rams. Theriogenology 79: 1247-1261.
Van der Jagt, D.L.; Deck, L.M.; Royer, R.E. 2000. Gossypol: prototype of inhibitors targeted to dinucleotide folds. Current Medicinal Chemistry 7: 479-498.
Viana, P.G.; Lima, P.M.T.; Paim, T.P.; Souza, J.R.; Dantas, A.M.M.; Pereira, E.F.; Gonçalves, V.; McManus, C.; Abdalla, A.L.; Louvandini, H. 2015. Gossypol was not detected in the longissimus muscle of lambs fed several forms of cottonseed. Animal Production Science 55: 812-817.
Wang, M.Z. 1987. Analysis of gossypol by high-performance liquid-chromatography. Journal of Ethnopharmacology 20: 1-11.
Zhang, L.; Jiang, H.X.; Cao, X.X.; Zhao, H.Y.; Wang, F.; Cui, Y.X.; Jiang, B. 2009. Chiral gossypol derivatives: evaluation of their anticancer activity and molecular modeling. European Journal of Medicinal Chemistry 44: 3961-3972.
Zhang, Y.-S.S.; Yuan, J.; Fang, Z.-Z.Z.; Tu, Y.-Y.Y.; Hu, C.-M.M.; Li, G.; Wang, L.; Deng, J.-P.P.; Yao, J.-J.J.; Li, H.-R.R. 2012. Gossypol exhibits a strong influence towards UDP-glucuronosyltransferase (UGT) 1A1, 1A9 and 2B7-mediated metabolism of xenobiotics and endogenous substances. Molecules 17: 4896-4903.