CERN-PH-EP/2011-222 2013/01/23
CMS-HIN-11-006
Centrality dependence of dihadron correlations and
azimuthal anisotropy harmonics in PbPb collisions at
√
s
NN=
2.76 TeV
The CMS Collaboration
∗Abstract
Measurements from the CMS experiment at the LHC of dihadron correlations for charged particles produced in PbPb collisions at a nucleon-nucleon centre-of-mass energy of 2.76 TeV are presented. The results are reported as a function of the par-ticle transverse momenta (pT) and collision centrality over a broad range in relative pseudorapidity (∆η) and the full range of relative azimuthal angle (∆φ). The ob-served two-dimensional correlation structure in∆η and ∆φ is characterised by a nar-row peak at (∆η, ∆φ) ≈ (0, 0)from jet-like correlations and a long-range structure that persists up to at least|∆η| = 4. An enhancement of the magnitude of the short-range jet peak is observed with increasing centrality, especially for particles of pT around 1–2 GeV/c. The long-range azimuthal dihadron correlations are extensively studied using a Fourier decomposition analysis. The extracted Fourier coefficients are found to factorise into a product of single-particle azimuthal anisotropies up to pT≈3–3.5 GeV/c for at least one particle from each pair, except for the second-order harmonics in the most central PbPb events. Various orders of the single-particle az-imuthal anisotropy harmonics are extracted for associated particle pTof 1–3 GeV/c, as a function of the trigger particle pT up to 20 GeV/c and over the full centrality range.
Submitted to the European Physical Journal C
∗See Appendix A for the list of collaboration members
1
Introduction
Measurements of dihadron correlations are a well established technique for studying the prop-erties of particle production in the high density medium created in heavy ion collisions. Early results from PbPb collisions at the Large Hadron Collider (LHC) [1, 2] extended these studies into a regime of much higher beam energies as compared to those from the Relativistic Heavy Ion Collider (RHIC) [3–10]. These results complement other LHC measurements of medium properties, including a large deficit of charged particles at high-pT[11] and the observations of an enhanced fraction of dijets with very asymmetric energies [12, 13].
The Compact Muon Solenoid (CMS) experiment at the LHC has studied dihadron correla-tions over a broad range of relative azimuthal angles (|∆φ|) and pseudorapidity (|∆η|, where
η = −ln[tan(θ/2)]and θ is the polar angle relative to the counterclockwise beam axis) in the
most central PbPb collisions at a nucleon-nucleon centre-of-mass energy (√sNN) of 2.76 TeV [1]. Concentrating on large|∆η|, previous measurements at RHIC established some of the proper-ties of the so-called “ridge” [4, 6, 9], an enhancement of pairs with|∆φ| ≈ 0. While a variety of theoretical models have been proposed to interpret the ridge phenomena as a consequence of jet-medium interactions [14–19], recent theoretical developments indicate that, because of event-by-event fluctuations in the initial shape of the interacting region, sizeable higher-order hydrodynamic flow terms could also be induced, e.g., triangular flow [20–28]. The triangular flow effect will contribute to the dihadron correlations in the form of a cos(3∆φ)component, which also gives a maximum near-side correlation at ∆φ ≈ 0, similarly to the elliptic flow contribution. It has been proposed that by taking into account various higher-order terms, the ridge structure could be described entirely by hydrodynamic flow effects [23]. To investigate this possibility, a Fourier decomposition of the CMS data at large|∆η|was performed, finding a strong dependence on pT [1]. Similar results, although with a smaller |∆η|gap, have been reported by ALICE [2, 29]. The observations by CMS of a ridge-like structure in very high multiplicity proton-proton (pp) collisions at a centre-of-mass energy of 7 TeV [30], where no medium effect is expected, may also challenge the interpretations of these long-range correla-tions.
This paper, expanding on previous CMS results [1], presents dihadron correlation measure-ments from PbPb collisions at √sNN = 2.76 TeV acquired in 2010, for all collision centralities and over a broader range of hadron pT. As in Refs. [1, 30], the yield of particles (binned in pT) associated with a trigger particle (also binned in pT) is extracted as a function of their relative pseudorapidity and azimuthal angle. Such a study of hadron pairs in either the same or dif-ferent pT ranges can reveal important information about the production of particles and their propagation through the medium. A Fourier decomposition technique is used to quantify the long-range azimuthal correlations. The potential connection between the extracted Fourier co-efficients from the correlation data and the azimuthal anisotropy harmonics for single particles is investigated. This measurement provides a comprehensive examination of the centrality and transverse momentum (1 < pT < 20 GeV/c) dependencies of the short-range (|∆η| < 1) and long-range (2< |∆η| <4) dihadron correlations in PbPb collisions at LHC energies, as well as the relationship between these two-particle correlations and single-particle angular distribu-tions. These results provide extensive input to the interpretation of these observables in terms of broad theoretical concepts such as hydrodynamic flow and quantitative models of particle production and propagation in the high-density medium.
The detector, the event selection and the extraction of the correlation functions are described in Sections 2 and 3, while the extracted results are described in Sections 4 and 5.
2
CMS Detector
The ability of the CMS detector (all components of which are described in Ref. [31]) to extract the properties of charged particles over a large solid angle is particularly important in the study of dihadron correlations. This study is based primarily on data from the inner tracker contained within the 3.8 T axial magnetic field of the large superconducting solenoid. The tracker consists of silicon pixel and strip detectors. The former includes 1 440 modules arranged in 3 layers, while the latter consists of 15 148 modules arranged in 10 (11) layers in the barrel (endcap) region. The trajectories of charged particles can be reconstructed for pT > 100 MeV/c and within|η| <2.5.
The field volume of the solenoid also contains crystal electromagnetic and brass/scintillator hadron calorimeters. Although not included in the present results, muons are detected using gas-ionisation counters embedded in the steel return yoke. In addition to these components in and around the barrel and endcap of the solenoid, CMS also has extensive forward calorimetry. In the right-handed coordinate system used by CMS, the x-, y-, and z-axes are aligned with the radius of the LHC ring, the vertical direction, and the counterclockwise beam direction, respectively, with the origin located at the centre of the nominal interaction region.
For PbPb collisions, the primary minimum-bias trigger uses signals from either the beam scin-tillator counters (BSC, 3.23< |η| < 4.65) or the steel/quartz-fibre Cherenkov forward hadron
calorimeters (HF, 2.9 < |η| < 5.2). Coincident signals from detectors located at both ends of
the detector (i.e., a pair of BSC or a pair of HF modules) are required. Events due to noise, cosmic-ray muons, double-firing triggers, and beam backgrounds are suppressed by further requiring the presence of colliding beam bunches. The fraction of inelastic hadronic PbPb col-lisions accepted by this primary trigger is(97±3)% [13].
3
Data and Analysis
The procedure used in the present analysis follows that described in the previous CMS corre-lation paper [1]. Offline event selection requires a reconstructed vertex with at least two tracks (i.e., at least one pair of charged particles). This vertex must be within 15 cm along the beam axis relative to the centre of the nominal collision region and within 0.02 cm in the transverse plane relative to the average position of all vertices in a given data sample. In addition, var-ious background events (for example beam-gas and beam-halo collisions, cosmic muons, and large-impact-parameter electromagnetic collisions) are suppressed by requiring at least three signals in the HF calorimeters at both positive and negative η, with at least 3 GeV of energy in each signal.
The analysis is based on a data sample of PbPb collisions corresponding to an integrated lumi-nosity of approximately 3.9 µb−1 [32, 33], which contains 30 million minimum-bias collisions after all event selections are applied. The pp data at√s = 2.76 TeV, the reference for comparison to the PbPb data, were collected during a short low-energy LHC run at the end of March 2011. Minimum-bias-triggered pp events corresponding to an integrated luminosity of 520 µb−1are selected for this analysis.
The energy released in the collisions is related to the centrality of the heavy ion interactions, i.e., the geometrical overlap of the incoming nuclei. The event centrality is defined as the fraction of the total cross section, starting at 0% with the most central collisions (i.e., smallest impact parameter). This fraction is determined from the distribution of total energy measured in both HF calorimeters.
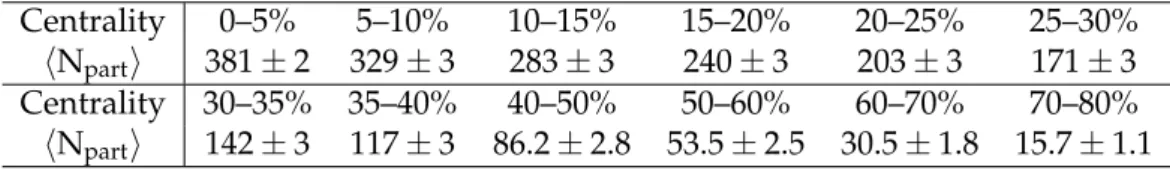
The event centrality can be correlated with the total number of nucleons in the two Pb nuclei that experienced at least one inelastic collision, Npart. The average values of Npartfor the var-ious centrality bins used in this analysis are given in Table 1. The Npart values are obtained using a Glauber Monte Carlo (MC) simulation [34, 35] with the same parameters as in Ref. [13]. These calculations are translated into reconstructed centrality bins using correlations between Npartand the measured total energy in the HF calorimeters, obtained from fully simulated MC events. The systematic uncertainties on the Npartvalues in Table 1 are derived from propagation of the uncertainties in the parameters of the Glauber model. More details on the determination of centrality and Npartcan be found in Refs. [13, 36, 37].
Table 1: Average Npartvalues for each PbPb centrality range used in this paper. The values are obtained using a Glauber MC simulation with the same parameters as in Ref. [13].
Centrality 0–5% 5–10% 10–15% 15–20% 20–25% 25–30%
hNparti 381±2 329±3 283±3 240±3 203±3 171±3
Centrality 30–35% 35–40% 40–50% 50–60% 60–70% 70–80%
hNparti 142±3 117±3 86.2±2.8 53.5±2.5 30.5±1.8 15.7±1.1
The reconstruction of charged particles in PbPb collisions is based on signals in the silicon pixel and strip detectors, similarly to the reconstruction for pp collisions [38]. However, a number of settings are adjusted to cope with the challenges presented by the much higher signal den-sity in central PbPb collisions. A set of tight quality selections are imposed on the collection of fully reconstructed tracks to minimise the contamination from misidentified tracks. These include requirements of at least 13 signals on the track, a relative momentum uncertainty of less than 5%, a normalised χ2 of less than 0.15 times the number of signals, and transverse and longitudinal impact parameters of less than three times the sum in quadrature of the un-certainties on the impact parameter and the primary vertex position. Studies with simulated MC events show that the combined geometrical acceptance and reconstruction efficiency for the primary-track reconstruction reaches about 60% for the 0–5% most central PbPb collisions at pT > 2 GeV/c over the full CMS tracker acceptance (|η| < 2.4) and 66% for|η| < 1.0. The
fraction of misidentified tracks is about 1–2% for |η| < 1.0, but increases to 10% at |η| ≈ 2.4
for the 5% most central PbPb collisions. For the peripheral PbPb events (70–80%), the overall tracking efficiency improves by up to 5%, with a much lower fraction of misidentified tracks. The analysis of dihadron angular correlations in this paper follows exactly the procedure es-tablished in Ref. [1]. Any charged particle associated with the primary vertex and in the range |η| < 2.4 can be used as a trigger particle. A variety of bins of trigger transverse momentum,
denoted by ptrigT , are considered. There can be more than one such trigger particle in a single event and their total multiplicity in a particular data sample is denoted by Ntrig. Within each event, every trigger particle is then paired with all of the remaining particles (again within |η| < 2.4). As for the trigger particles, these associated particles are binned in transverse
mo-mentum (passocT ). The differential yield of associated particles per trigger particle is given by 1 Ntrig d2Npair d∆η d∆φ = B(0, 0) × S(∆η, ∆φ) B(∆η, ∆φ), (1)
where Npair is the total number of correlated hadron pairs. The functions S(∆η, ∆φ) and B(∆η, ∆φ) are called the signal and background distributions, respectively. The value of the latter at∆η=0 and∆φ=0 (B(0, 0)) is a normalisation factor.
The signal distribution is the per-trigger-particle yield of pairs found in the same event, S(∆η, ∆φ) = 1
Ntrig
d2Nsame
d∆η d∆φ, (2)
where Nsame is the number of such pairs within a (∆η,∆φ) bin. The background distribution is found using a mixed-event technique, wherein trigger particles from one event are combined (mixed) with all of the associated particles from a different event. In the analysis, associated particles from 10 randomly chosen events are used. The result is given by
B(∆η, ∆φ) = 1 Ntrig
d2Nmix
d∆η d∆φ, (3)
where Nmix denotes the number of mixed-event pairs. This background distribution repre-sents the expected correlation if the only effects present were random combinatorics and pair-acceptance.
The value of B(∆η, ∆φ)at∆η =0 and∆φ=0 (with a bin width of 0.3 in∆η and π/16 in ∆φ) is used to find the normalisation factor B(0, 0). In this case, the two particles have the maximum possible geometric pair acceptance since they are travelling in essentially the same direction. The effect of two tracks merging into a single reconstructed track is negligible. The extent to which the background distribution at larger angular separation is smaller than this value (more specifically the ratio B(0, 0)/B(∆η, ∆φ)) can be used to determine the pair acceptance correc-tion factor. Multiplying the signal distribucorrec-tion by this ratio gives the acceptance-corrected per-trigger-particle associated yield. Since the distributions should, in principle, be symmetric, the statistical precision is maximised by filling only one quadrant using the absolute values of∆η and∆φ. For illustration purposes only (for example, see Fig. 1), the other three quadrants are filled by reflection, giving distributions that are symmetric about(∆η, ∆φ) = (0, 0)by construc-tion. The pair acceptance decreases rapidly with∆η and so, to avoid large fluctuations due to statistical limitations, the distributions are truncated at |∆η| = 4. The analysis is performed in twelve centrality classes of PbPb collisions ranging from the most central 0–5% to the most peripheral 70–80%. Within each centrality range, the yield described in Eq. 1 is calculated in 0.5 cm wide bins of the vertex position (zvtx) along the beam direction and then averaged over the range|zvtx| <15 cm.
When filling the signal and background distributions, each pair is weighted by the product of correction factors for the two particles. These factors are the inverse of an efficiency that is a function of each particle’s pseudorapidity and transverse momentum,
εtrk(η, pT) =
A(η, pT)E(η, pT) 1−F(η, pT)
, (4)
where A(η, pT) is the geometrical acceptance, E(η, pT) is the reconstruction efficiency, and F(η, pT)is the fraction of misidentified tracks. The effect of this weighting factor only changes the overall scale but not the shape of the associated yield distribution, which is determined by the signal-to-background ratio.
As described in Ref. [1], the track-weighting procedure is tested using MC events generated with HYDJET [39] (version 1.6) propagated through a full detector simulation. The tracking efficiencies themselves are checked using simulated tracks embedded into actual data events. Systematic uncertainties due to variations of the track reconstruction efficiency as a function of vertex location and also the procedure used to generate the background events are evaluated. The individual contributions are added in quadrature to find the final systematic uncertainties of 7.3–7.6%.
4
Correlation Functions and Near-Side Yields
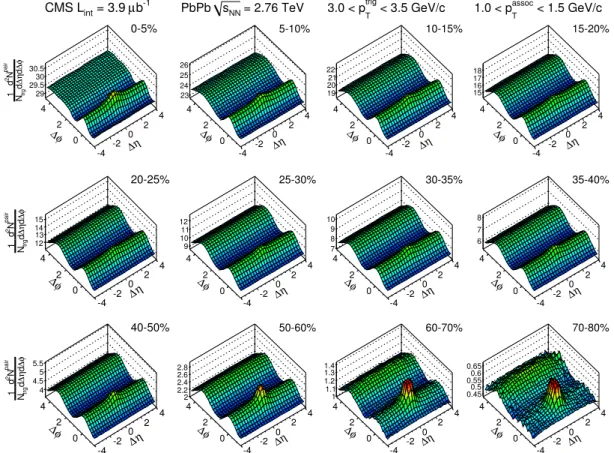
The two-dimensional (2D) per-trigger-particle associated yield distribution of charged hadrons as a function of|∆η|and|∆φ|is measured for each ptrigT and passocT interval, and in different cen-trality classes of PbPb collisions. An example for trigger particles with 3 < ptrigT < 3.5 GeV/c and associated particles with 1 < passocT < 1.5 GeV/c is shown in Fig. 1, for centralities ranging from the 0–5% most central collisions, to the most peripheral (70–80%) events. The 2D correla-tions are rich in structure, and evolve with centrality. The ptrigT and passoc
T ranges shown in this
figure were chosen as an example because they demonstrate a good balance of the following features. For the most central PbPb collisions, a clear and significant ridge-like structure mostly flat in∆η, and extending to the limit of|∆η| = 4, is observed at∆φ ≈ 0. At mid-peripheral events, a pronounced cos(2∆φ)component emerges, originating predominantly from elliptic flow [10]. Lastly, in the most peripheral collisions, the near-side ridge structure has largely di-minished, while the away-side back-to-back jet correlations can be clearly seen at∆φ≈ π, but
spread out in∆η. η ∆ -4 -2 0 2 4 φ ∆ 0 2 4 φ ∆ d η ∆ d pair N 2 d trg N 1 29 29.5 30 30.5 0-5% -1 b µ = 3.9 int CMS L η ∆ -4 -2 0 2 4 φ ∆ 0 2 4 φ ∆d η ∆d pair N 2 d trg N 1 12 13 14 15 20-25% η ∆ -4 -2 0 2 4 φ ∆ 0 2 4 φ ∆d η ∆d pair N 2d trg N 1 4 4.5 5 5.5 40-50% η ∆ -4 -2 0 2 4 φ ∆ 0 2 4 23 24 25 26 5-10% = 2.76 TeV NN s PbPb η ∆ -4 -2 0 2 4 φ ∆ 0 2 4 9 10 11 12 25-30% η ∆ -4 -2 0 2 4 φ ∆ 0 2 4 2 2.2 2.4 2.6 2.8 50-60% η ∆ -4 -2 0 2 4 φ ∆ 0 2 4 19 2021 22 10-15% < 3.5 GeV/c trig T 3.0 < p η ∆ -4 -2 0 2 4 φ ∆ 0 2 4 7 8 9 10 30-35% η ∆ -4 -2 0 2 4 φ ∆ 0 2 4 1 1.1 1.2 1.3 1.4 60-70% η ∆ -4 -2 0 2 4 φ ∆ 0 2 4 15 16 17 18 15-20% < 1.5 GeV/c assoc T 1.0 < p η ∆ -4 -2 0 2 4 φ ∆ 0 2 4 6 7 8 35-40% η ∆ -4 -2 0 2 4 φ ∆ 0 2 4 0.45 0.5 0.550.6 0.65 70-80%
Figure 1: Two-dimensional (2D) per-trigger-particle associated yield of charged hadrons as a function of |∆η| and|∆φ| for 3 < ptrigT < 3.5 GeV/c and 1 < passocT < 1.5 GeV/c, for twelve centrality ranges of PbPb collisions at√sNN = 2.76 TeV. The near-side peak is truncated in the two most peripheral distributions to better display the surrounding structure.
As was done in Ref. [1], to quantitatively examine the features of short-range and long-range azimuthal correlations, one-dimensional (1D)∆φ correlation functions are calculated by
aver-aging the 2D distributions over a limited region in∆η from ∆ηminto∆ηmax: 1 Ntrig dNpair d∆φ = 1 ∆ηmax−∆ηmin Z ∆ηmax ∆ηmin 1 Ntrig d2Npair d∆η d∆φd∆η. (5)
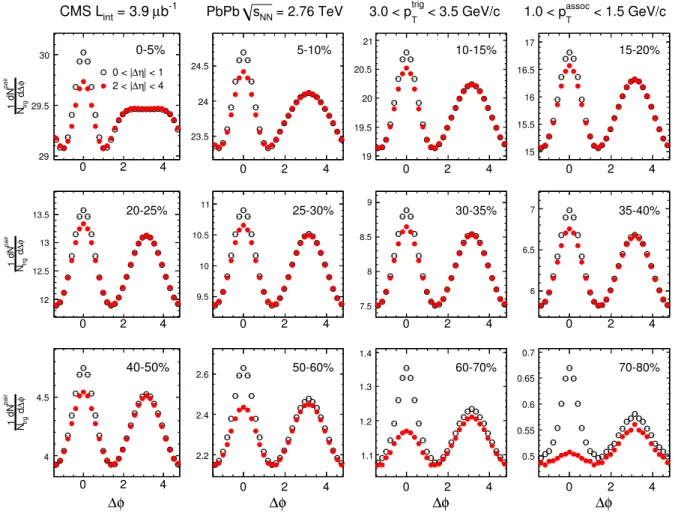
The results of extracting the 1D∆φ correlations in the short-range (0 < |∆η| < 1) and long-range (2< |∆η| < 4) regions are shown in Fig. 2. The associated yield distribution per trigger particle is extracted for the same ptrigT and passocT ranges as in Fig. 1.
0 2 4 φ ∆ d pair dN trg N 1 29 29.5 30 -1 b µ = 3.9 int CMS L | < 1 η ∆ 0 < | | < 4 η ∆ 2 < | 0-5% 0 2 4 φ ∆d pair dN trg N 1 12 12.5 13 13.5 20-25% φ ∆ 0 2 4 φ ∆ d pair dN trg N 1 4 4.5 40-50% 0 2 4 23.5 24 24.5 = 2.76 TeV NN s PbPb 5-10% 0 2 4 9.5 10 10.5 11 25-30% φ ∆ 0 2 4 2.2 2.4 2.6 50-60% 0 2 4 19 19.5 20 20.5 21 < 3.5 GeV/c trig T 3.0 < p 10-15% 0 2 4 7.5 8 8.5 9 30-35% φ ∆ 0 2 4 1.1 1.2 1.3 1.4 60-70% 0 2 4 15 15.5 16 16.5 17 < 1.5 GeV/c assoc T 1.0 < p 15-20% 0 2 4 6 6.5 7 35-40% φ ∆ 0 2 4 0.5 0.55 0.6 0.65 0.7 70-80%
Figure 2: Short-range (0 < |∆η| < 1, open circles) and long-range (2 < |∆η| < 4, red closed circles) per-trigger-particle associated yields of charged hadrons as a function of|∆φ|for 3 < ptrigT < 3.5 GeV/c and 1 < passoc
T < 1.5 GeV/c, for twelve centrality ranges of PbPb collisions at√sNN = 2.76 TeV. The statistical error bars are smaller than the marker size. The systematic
uncertainties of 7.6% for all data points in the short-range region and 7.3% for all data points in the long-range region are not shown in the plots.
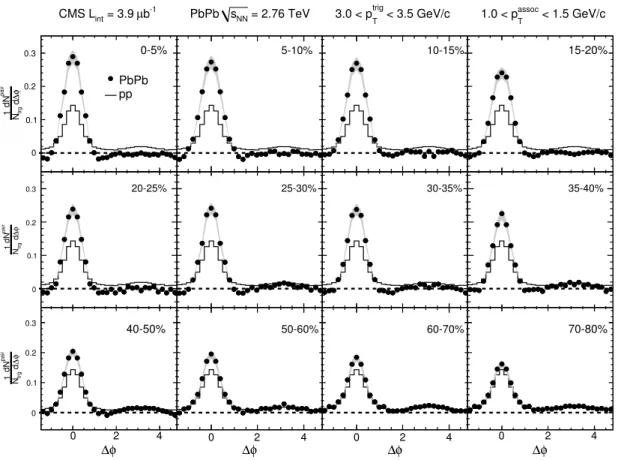
In order to study the short-range∆φ correlations in the absence of the flat background in ∆η, the 1D∆φ distribution in the long-range region is subtracted from that in the short-range region. The resulting difference of the distributions is shown in Fig. 3. The near-side peak (∆φ ≈ 0) represents mainly the correlations from jet fragmentation, whereas the away-side region (∆φ≈
π) is mostly flat and close to zero due to the weak∆η dependence of the away-side jet peak.
to that in the very peripheral 70–80% PbPb data. However, the magnitude of the near-side peak is significantly enhanced in the most central PbPb collisions as compared to pp. Most of the systematic uncertainties manifest themselves as an overall change in the scale of the correlation functions, with little dependence on ∆φ and ∆η. Therefore, they largely cancel when the difference between the short-range and long-range regions is taken.
0 2 4 φ ∆d pair dN trg N 1 0 0.1 0.2 0.3 -1 b µ = 3.9 int CMS L PbPb pp 0-5% 0 2 4 φ ∆d pair dN trg N 1 0 0.1 0.2 0.3 20-25% φ ∆ 0 2 4 φ ∆ d pair dN trg N 1 0 0.1 0.2 0.3 40-50% 0 0.1 0.2 0.3 = 2.76 TeV NN s PbPb 5-10% 0 2 4 0 0.1 0.2 0.3 25-30% φ ∆ 0 2 4 0 0.1 0.2 0.3 50-60% 0.1 < 3.5 GeV/c trig T 3.0 < p 10-15% 0 2 4 0.1 30-35% φ ∆ 0 2 4 0.1 60-70% 0 2 4 0.1 < 1.5 GeV/c assoc T 1.0 < p 15-20% 0 2 4 35-40% φ ∆ 0 2 4 0.1 70-80%
Figure 3: The difference between short-range (0 < |∆η| < 1) and long-range (2 < |∆η| < 4) per-trigger-particle associated yields of charged hadrons as a function of|∆φ|for 3 < ptrigT < 3.5 GeV/c and 1< passoc
T <1.5 GeV/c, for twelve centrality ranges of PbPb collisions at √
sNN = 2.76 TeV. The statistical error bars are smaller than the marker size. The grey bands denote the systematic uncertainties. The pp result is superimposed in all panels, for reference purposes. The strengths of the near-side peak and away-side region in the|∆φ|distributions from Fig. 3 can be quantified by integrating over the two|∆φ|ranges separated by the minimum position of the distribution. This position is chosen as|∆φ| =1.18, the average of the minima between the near side and away side over all centralities. This choice of integration range introduces an additional systematic uncertainty in the integrated associated yields. The effect of choosing different minima for integration ranges changes the overall yield by an absolute amount of at most 0.007. Similar shifts are calculated for each data point, then added as an absolute value in quadrature to the other systematic uncertainties.
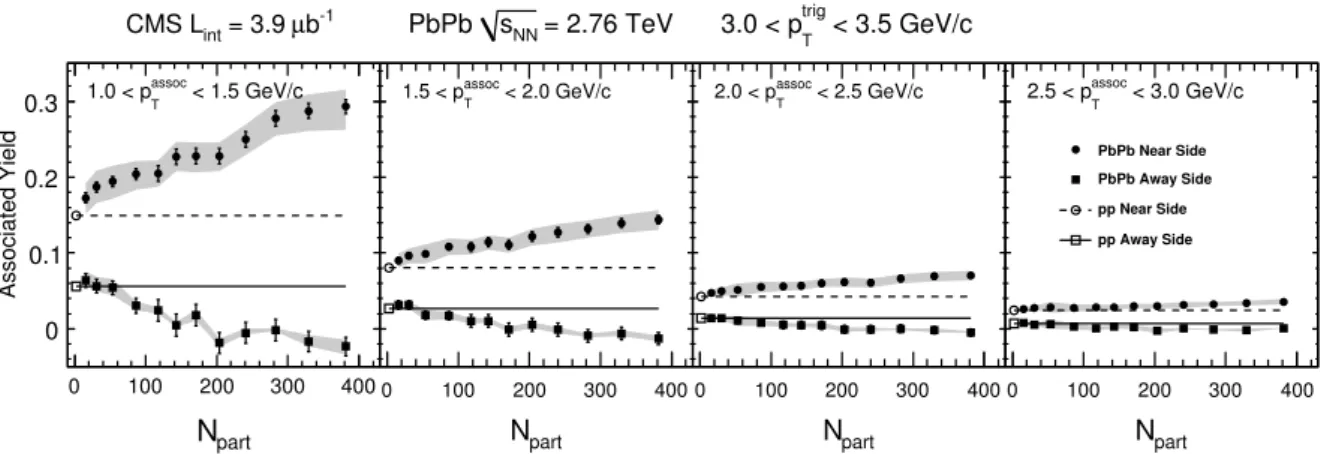
Figure 4 shows the integrated associated yields of the near-side peak and away-side regions as a function of Npartin PbPb collisions at
√
sNN = 2.76 TeV, requiring 3< ptrigT <3.5 GeV/c, for four different intervals of passocT (1–1.5, 1.5–2, 2–2.5, and 2.5–3 GeV/c). The grey bands represent the systematic uncertainties. For easier visual comparison between the most central PbPb results
and the values one would expect from a trivial extrapolation of the pp results, the latter are also represented using horizontal lines covering the full Npartrange. The yield of the near-side peak increases by a factor of 1.7 in going from the very peripheral 70–80% to the most central 0– 5% PbPb events, for the lowest passoc
T interval of 1–1.5 GeV/c. As passocT increases, the centrality dependence of the near-side yield becomes less prominent. An increase by a factor of only 1.3 is observed for the highest passocT interval of 2.5–3 GeV/c. This is of particular interest because at RHIC energies for passocT down to 2 GeV/c and similar ptrigT ranges and methodology, although for a lower density system (AuAu at√sNN= 0.2 TeV), there is almost no centrality dependence
observed [40]. On both near and away sides, the yield in PbPb matches that in pp for the most peripheral events. On the away side, the yield in PbPb decreases with centrality, becoming negative for the most central events. Variations in the event-mixing procedure can cause large fluctuations but only at the very edge of the acceptance around |∆η| = 4.8. However, the correlation function is only studied up to|∆η| < 4 in this paper so these fluctuations do not affect the results. The negative values of the yields in Fig. 4 are caused by a slightly concave structure on the away-side region (1.18 < |∆φ| < π), i.e. the yields near|∆η| ≈ 0 are smaller
than those at higher |∆η|. The effect is more prominent for central PbPb events. However, this concavity is seen only for|∆η| < 2. Beyond that region, the∆η distribution is found to be largely flat up to|∆η| =4. Similar behaviour was also observed at RHIC for AuAu collisions at √
sNN = 200 GeV [41]. This deviation from pp may be related to the jet quenching phenomena, which leads to a modification in the back-to-back jet correlations in PbPb. Any effect that modifies the kinematics of dijet production could also result in a modification of away-side distributions in∆η. Additionally, any slight dependence of the flow effect on η could also play a role. More detailed theoretical models will be required to fully understand the origin of this small effect. part N 0 100 200 300 400 Associated Yield 0 0.1 0.2 0.3 -1 b µ = 3.9 int CMS L < 1.5 GeV/c assoc T 1.0 < p part N 0 100 200 300 400 0 0.1 0.2 0.3 = 2.76 TeV NN s PbPb < 2.0 GeV/c assoc T 1.5 < p part N 0 100 200 300 400 0 0.1 0.2 0.3 < 3.5 GeV/c trig T 3.0 < p < 2.5 GeV/c assoc T 2.0 < p part N 0 100 200 300 400 0 0.1 0.2 0.3 < 3.0 GeV/c assoc T 2.5 < p PbPb Near Side PbPb Away Side pp Near Side pp Away Side
Figure 4: The integrated associated yields of the near-side peak (|∆φ| < 1.18) and away-side region (|∆φ| > 1.18), requiring 3 < ptrigT < 3.5 GeV/c for four different intervals of passoc
T , as
a function of Npart in PbPb collisions at √
sNN = 2.76 TeV. The statistical error bars are smaller than the marker size. The grey bands denote the systematic uncertainties. The lines represent the pp results (Npart= 2) superimposed over the full range of Npartvalues.
5
Fourier Decomposition Analysis of the PbPb Data
The first Fourier decomposition analysis of long-range dihadron azimuthal correlations for PbPb collisions at√sNN = 2.76 TeV was presented in Ref. [1]. This analysis was motivated by
the goal of determining whether the long-range ridge effect was caused by higher-order hy-drodynamic flow harmonics induced by the initial geometric fluctuations. This decomposition involves fitting the 1D∆φ-projected distribution for 2< |∆η| <4 (to avoid the jet peak) with a Fourier series given by
1 Ntrig dNpair d∆φ = Nassoc 2π ( 1+ Nmax
∑
n=1 2Vn∆cos(n∆φ) ) , (6)where Vn∆ are the Fourier coefficients and Nassoc represents the total number of hadron pairs per trigger particle for the given|∆η|range and(ptrigT , passocT )bin. The first five Fourier terms (Nmax =5) are included in both the current fits and those in Ref. [1]. In this paper, the analysis of the Fourier decomposition is extended to the full centrality range, and is performed as a function of both ptrigT and passocT .
The Fourier decomposition results have several systematic uncertainties. Because the tracking-correction-related systematic uncertainties only change the overall scale of the correlation func-tions, instead of the shape, they have only a±0.8% uncertainty on the extracted Fourier coef-ficients (Vn∆), largely independent of n and collision centrality. In addition, the results are insensitive to looser or tighter track selections to within±0.5%. By comparing the Fourier co-efficients derived for two different zvtxranges,|zvtx| <15 cm and|zvtx| <5 cm, the systematic uncertainties due to the dependence on the vertex position are estimated to be less than±0.5%. Variations from the finite bin width of the∆φ histograms contribute the largest systematic un-certainty to the analysis, especially for the higher-order components, which are more sensitive to the fine structure of the distributions. Reducing the binning of the∆φ histograms by factors of 2, 4, and 8, the extracted Fourier coefficients vary by±0.3–2.2%. The effect of including ad-ditional higher-order Fourier terms in the fit using Eq. 6 results in changes of at most ±1.0% (for n = 5), with Fourier terms up to n = 10 included (Nmax = 10). The values of additional higher-order Fourier terms included in the fit are all consistent with zero.
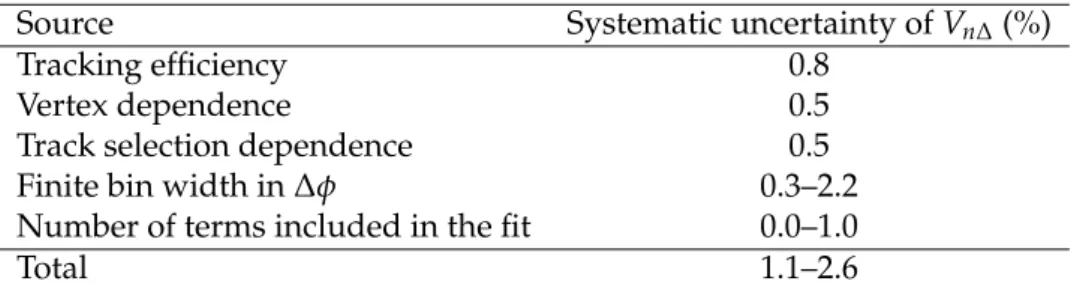
Table 2 summarises the different sources of uncertainty for the first five Fourier coefficients. These uncertainties are added in quadrature to obtain the total systematic uncertainties, also given in Table 2.
Table 2: Systematic uncertainties of the Fourier coefficients (Vn∆) for the first five terms.
Source Systematic uncertainty of Vn∆ (%)
Tracking efficiency 0.8
Vertex dependence 0.5
Track selection dependence 0.5
Finite bin width in∆φ 0.3–2.2
Number of terms included in the fit 0.0–1.0
Total 1.1–2.6
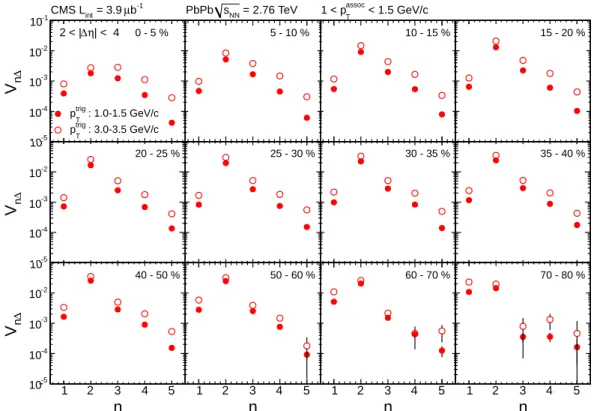
The fitted Fourier coefficients (Vn∆) up to n = 5, for two representative low-ptrigT ranges of 1< ptrigT <1.5 GeV/c and 3< ptrigT <3.5 GeV/c, with passocT fixed at 1–1.5 GeV/c, are presented in Fig. 5 for various centrality ranges. The values of Vn∆peak at n=2 and then drop dramatically toward larger n values at all centralities, although this behaviour is less pronounced for the 0–5% centrality bin. The error bars show the statistical uncertainties only, while the systematic uncertainties are indicated in Table 2.
n 1 2 3 4 5 ∆ n V -5 10 -4 10 -3 10 -2 10 -1 10 0 - 5 % -1 b µ = 3.9 int CMS L | < 4 η ∆ 2 < | : 1.0-1.5 GeV/c trig T p : 3.0-3.5 GeV/c trig T p n 1 2 3 4 5 ∆ n V -5 10 -4 10 -3 10 -2 10 -1 10 20 - 25 % n 1 2 3 4 5 ∆ n V -5 10 -4 10 -3 10 -2 10 -1 10 40 - 50 % n 1 2 3 4 5 ∆ n V -5 10 -4 10 -3 10 -2 10 -1 10 5 - 10 % = 2.76 TeV NN s PbPb n 1 2 3 4 5 ∆ n V -5 10 -4 10 -3 10 -2 10 -1 10 25 - 30 % n 1 2 3 4 5 ∆ n V -5 10 -4 10 -3 10 -2 10 -1 10 50 - 60 % n 1 2 3 4 5 ∆ n V -5 10 -4 10 -3 10 -2 10 -1 10 10 - 15 % < 1.5 GeV/c assoc T 1 < p n 1 2 3 4 5 ∆ n V -5 10 -4 10 -3 10 -2 10 -1 10 30 - 35 % n 1 2 3 4 5 ∆ n V -5 10 -4 10 -3 10 -2 10 -1 10 60 - 70 % n 1 2 3 4 5 ∆ n V -5 10 -4 10 -3 10 -2 10 -1 10 15 - 20 % n 1 2 3 4 5 ∆ n V -5 10 -4 10 -3 10 -2 10 -1 10 35 - 40 % n 1 2 3 4 5 ∆ n V -5 10 -4 10 -3 10 -2 10 -1 10 70 - 80 %
Figure 5: Fourier coefficients V1∆ through V5∆, extracted from the long-range (2 < |∆η| < 4) azimuthal dihadron correlations, for 1 < ptrigT < 1.5 GeV/c (closed circles) and 3 < ptrigT < 3.5 GeV/c (open circles) with passoc
T fixed at 1–1.5 GeV/c, for twelve centrality intervals. Most of the statistical error bars are smaller than the marker size. The systematic uncertainties (not shown in the plots) are indicated in Table 2.
5.1 Factorisation of Fourier Coefficients
If the observed azimuthal dihadron correlations at large ∆η are driven only by the single-particle azimuthal anisotropy with respect to a particular direction in the event, the extracted Fourier coefficients (Vn∆) from long-range azimuthal dihadron correlations can be factorised into a product of the single-particle azimuthal anisotropy harmonics, vn, via
Vn∆(ptrigT , passocT ) =vn(ptrigT ) ×vn(passocT ), (7) where vn(ptrigT )and vn(passocT )are the harmonics for the trigger and associated particles [2] aver-aged over all the events, respectively. One source of vnis the collective-flow harmonics arising from hydrodynamic expansion of the medium (e.g., anisotropic elliptic flow contribution to v2) [42], particularly in the low-pT regime where hadron production in heavy ion collisions is thought to be mainly from the bulk medium [43]. In addition, for very high pT particles that are predominantly produced by the fragmentation of energetic jets, vn could also be in-duced by the path-length dependence of the jet-quenching effect inside the medium [44–49]. This path difference can lead to a stronger suppression of the high-pT hadron yield along the long axis of the elliptically-shaped system than along its short axis, resulting in an azimuthal anisotropy characterised by the v2 harmonic. Both scenarios satisfy the factorisation relation of Eq. 7. However, note that the pT dependent event-by-event fluctuations of vn could break the factorisation in general, even though vnmay be still related to the single-particle azimuthal anisotropy. This possibility is not investigated in this paper.
This relation (Eq. 7) is a necessary ingredient for the extraction of single-particle azimuthal anisotropy harmonics using the dihadron correlation data, since a Fourier series can be used to decompose any functional form by construction. The relation can be tested by first assuming that factorisation is valid for pairs including one particle in a fixed, low passocT range, denoted by plowT , correlated with a second particle of any pT. The range of plowT is chosen to be 1–1.5 GeV/c, where particle production is expected to be predominantly driven by hydrodynamics. The value of vn(plowT )is first calculated as the square root of Vn∆(plowT , plowT ). The vn(p
trig T )is then derived as vn(ptrigT ) = Vn∆(ptrigT , plowT ) vn(plowT ) . (8)
This is effectively equivalent to the two-particle cumulant method of flow measurement [50, 51]. Next, the ratio of Vn∆(ptrigT , passoc
T )directly extracted as a function of p trig
T and passocT (left-hand side of Eq. 7) to the product of vn(ptrigT )and vn(passocT )(right-hand side of Eq. 7) is calcu-lated. This ratio should be approximately unity if factorisation is also valid for higher ptrigT and passoc
T particles.
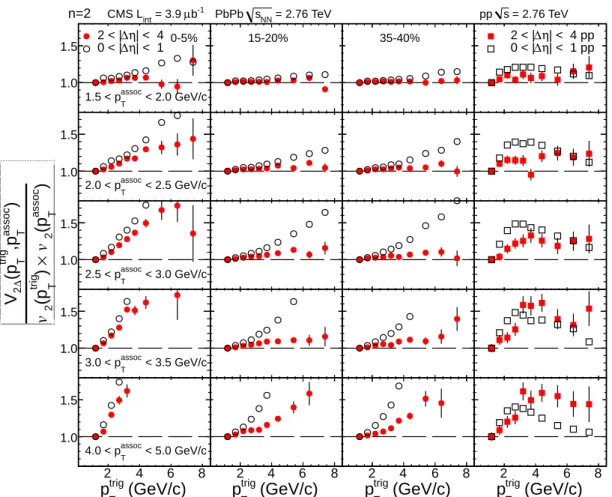
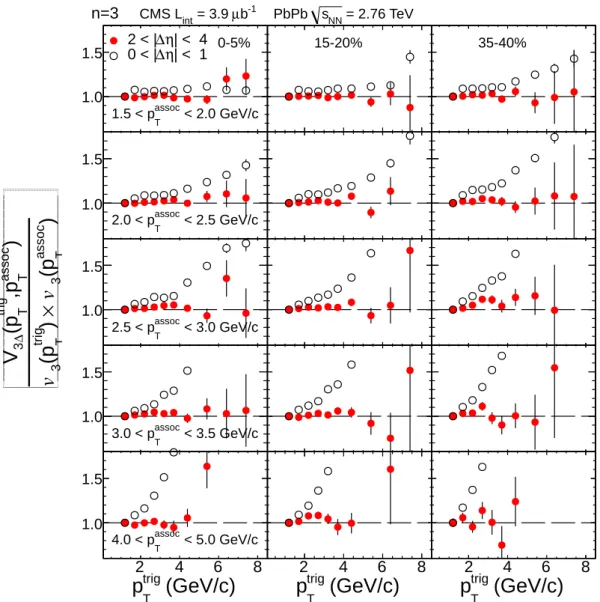
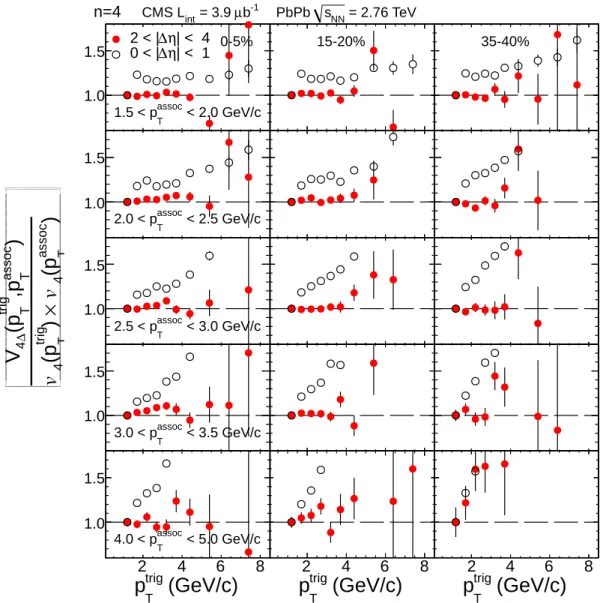
Figures 6, 7, and 8 show the ratios for n = 2, 3, and 4, over five passocT ranges as a function of ptrigT , for both short-range (0 < |∆η| < 1) and long-range (2 < |∆η| < 4) regions. Three different centrality intervals 0–5%, 15–20% and 35–40% are presented. The ratio for n = 2 in pp data is also shown in the last column of Fig. 6. The first point of each panel equals 1.0 by construction. The error bars correspond to the statistical uncertainties. The total systematic uncertainties are estimated to be 1.5% (n = 2)–3.6% (n = 5), approximately √2 times the systematic uncertainties of Vn∆shown in Table 2.
First of all, no evidence of factorisation is found in the pp data and for the short-range region (0 < |∆η| < 1) in any of the centrality ranges of the PbPb data, where dijet production is
expected to be the dominant source of correlations. In Ref. [2], it has been shown that Vn∆ factorises for jet-like correlations at very high-pT (e.g., pT > 5 GeV/c) as the direction of the dijet forms a special axis, to which produced particles are strongly correlated. This is similar to the elliptic flow effect, where particles are preferentially produced along the short axis of the elliptically-shaped overlapping region. However, the lack of factorisation in pp and the short-range region of PbPb observed for the pTrange of 1< passocT <3.5 GeV/c primarily investigated in this paper may suggest a complicated interplay of different particle production mechanisms between low-pT(hydrodynamic flow for PbPb and underlying event for pp) and high-pT(dijet production) particles.
In contrast, the long-range region (2< |∆η| <4) for mid-peripheral 15–20% and 35–40% events does show evidence of factorisation for V2∆ to V4∆ with passocT up to 3–3.5 GeV/c and p
trig
T up
to approximately 8 GeV/c. The data are also consistent with factorisation for even higher ptrigT (>8 GeV/c) combined with low passocT , but the current event sample is not large enough to draw a firm conclusion. Note that Vn∆ varies by almost 60% in the ptrigT range from 1 to 3.5 GeV/c as shown in Fig. 5, whereas factorisation is found to hold to better than 5%. This suggests a potential connection between the extracted Fourier coefficients from long-range dihadron correlations and the single-particle azimuthal anisotropy harmonics. For the most central 0– 5% collisions, the ratio for n=2 deviates significantly from unity, while V3∆and V4∆still show a similar level of factorisation to that of the 15–20% and 35–40% mid-peripheral data. This may indicate the existence of other sources of long-range correlations for the most central collisions that violate the factorisation relation. The breakdown of factorisation for passocT > 4 GeV/c in the long-range region is likely due to dijet correlations. Higher-order Fourier coefficients and a wider pTrange can be investigated once larger samples of PbPb data are collected. Factorisation of V1∆ is not discussed in this paper as it contains an additional negative contribution from momentum conservation [52], which is not related to the collective flow effect and needs to be accounted for in further studies.
5.2 Elliptic and Higher-Order Single-Particle Azimuthal Anisotropy Harmonics
As discussed in Section 5.1, except for v2 in the very central PbPb events, the factorisation relation given by Eq. 7 for long-range (2< |∆η| <4) azimuthal dihadron correlations is found to be valid for sufficiently low passocT , combined with low ptrigT , and possibly high ptrigT as well. Therefore, the single-particle azimuthal anisotropy harmonics vn(ptrigT )can be extracted using Eq. 8 with 1< passocT <3 GeV/c. Values are found for centralities ranging from 0–5% to 70–80%, and presented in Fig. 9. The 1–3 GeV/c passocT range is chosen in order to reduce the statistical uncertainty by utilising as many associated particles as possible over the passocT range where factorisation is valid. Data for the most central and most peripheral events are included for completeness, although the results for v2in those events are clearly demonstrated by Fig. 6 to be more complicated in nature. The value of v2 is extracted up to ptrigT ∼ 20 GeV/c for all but the 2 most peripheral centralities, whereas higher-order vnare truncated at ptrigT ∼ 10 GeV/c or less for the peripheral data due to statistical limitations. As mentioned previously, factorisation is not demonstrated conclusively at very high ptrigT . For the most central 0–5% events, all the harmonics are of similar magnitude across the entire ptrigT range. The pT dependence of all vn shows the same trend of a fast rise to a maximum around pT ≈3 GeV/c, followed by a slower fall, independent of centrality up to 50–60%. The magnitude of v2 increases when moving away from the most central events. At very high ptrigT , sizeable v2signals are observed, which exhibit an almost flat pTdependence from 10 to 20 GeV/c for most of the centrality ranges. This is not the case for the higher-order harmonics. In order to explicitly investigate the centrality
(GeV/c) trig T p 2 4 6 8 1.0 1.5 2 < | 0 < |∆∆ηη| < 4| < 1 0-5% -1 b µ = 3.9 int CMS L n=2 < 2.0 GeV/c assoc T 1.5 < p (GeV/c) trig T p2 4 6 8 1.0 1.5 < 2.5 GeV/c assoc T 2.0 < p (GeV/c) trig T p2 4 6 8 1.0 1.5 < 3.0 GeV/c assoc T 2.5 < p (GeV/c) trig T p2 4 6 8 1.0 1.5 < 3.5 GeV/c assoc T 3.0 < p (GeV/c) trig T p 2 4 6 8 1.0 1.5 < 5.0 GeV/c assoc T 4.0 < p (GeV/c) trig T p 2 4 6 8 1.0 1.5 15-20% = 2.76 TeV NN s PbPb (GeV/c) trig T p2 4 6 8 1.0 1.5 (GeV/c) trig T p2 4 6 8 1.0 1.5 (GeV/c) trig T p2 4 6 8 1.0 1.5 (GeV/c) trig T p 2 4 6 8 1.0 1.5 (GeV/c) trig T p 2 4 6 8 1.0 1.5 35-40% (GeV/c) trig T p2 4 6 8 1.0 1.5 (GeV/c) trig T p2 4 6 8 1.0 1.5 (GeV/c) trig T p2 4 6 8 1.0 1.5 (GeV/c) trig T p 2 4 6 8 1.0 1.5 (GeV/c) trig T p 2 4 6 8 1.0 1.5 2 < | 0 < |∆∆ηη| < 4 pp| < 1 pp = 2.76 TeV s pp (GeV/c) trig T p2 4 6 8 1.0 1.5 (GeV/c) trig T p2 4 6 8 1.0 1.5 (GeV/c) trig T p2 4 6 8 1.0 1.5 (GeV/c) trig T p 2 4 6 8 1.0 1.5 0.00.20.40.60.81.0 0.0 0.2 0.4 0.6 0.8 1.0 ) assoc T (p 2 v × ) trig T (p 2 v ) assoc T ,p trig T (p∆ 2 V
Figure 6: The ratios of V2∆(ptrigT , passocT )to the product of v2(ptrigT )and v2(passocT )for n=2 in the short-range (0< |∆η| <1, open circles) and long-range (2< |∆η| <4, closed circles) regions, where v2(pT) is evaluated in a fixed plowT bin of 1–1.5 GeV/c, for five intervals of passocT and centralities of 0–5%, 15–20% and 35–40%. The error bars correspond to statistical uncertainties only.
(GeV/c)
trig Tp
2 4 6 8 1.0 1.5 2 < | 0 < |∆∆ηη| < 4| < 1 0-5% -1 b µ = 3.9 int CMS L n=3 < 2.0 GeV/c assoc T 1.5 < p(GeV/c)
trig Tp
2 4 6 8 1.0 1.5 < 2.5 GeV/c assoc T 2.0 < p(GeV/c)
trig Tp
2 4 6 8 1.0 1.5 < 3.0 GeV/c assoc T 2.5 < p(GeV/c)
trig Tp
2 4 6 8 1.0 1.5 < 3.5 GeV/c assoc T 3.0 < p(GeV/c)
trig Tp
2 4 6 8 1.0 1.5 < 5.0 GeV/c assoc T 4.0 < p(GeV/c)
trig Tp
2 4 6 8 1.0 1.5 15-20% = 2.76 TeV NN s PbPb(GeV/c)
trig Tp
2 4 6 8 1.0 1.5(GeV/c)
trig Tp
2 4 6 8 1.0 1.5(GeV/c)
trig Tp
2 4 6 8 1.0 1.5(GeV/c)
trig Tp
2 4 6 8 1.0 1.5(GeV/c)
trig Tp
2 4 6 8 1.0 1.5 35-40%(GeV/c)
trig Tp
2 4 6 8 1.0 1.5(GeV/c)
trig Tp
2 4 6 8 1.0 1.5(GeV/c)
trig Tp
2 4 6 8 1.0 1.5(GeV/c)
trig Tp
2 4 6 8 1.0 1.5 0.0 0.2 0.4 0.6 0.8 1.0 0.0 0.2 0.4 0.6 0.8 1.0)
assoc T(p
3v
×
)
trig T(p
3v
)
assoc T,p
trig T(p
∆ 3V
Figure 7: The ratios of V3∆(ptrigT , passocT )to the product of v3(ptrigT )and v3(passocT )for n=3 in the short-range (0< |∆η| <1, open circles) and long-range (2< |∆η| <4, closed circles) regions, where v3(pT) is evaluated in a fixed plowT bin of 1–1.5 GeV/c, for five intervals of passocT and centralities of 0–5%, 15–20% and 35–40%. The error bars correspond to statistical uncertainties only.
(GeV/c)
trig Tp
2 4 6 8 1.0 1.5 2 < | 0 < |∆∆ηη| < 4| < 1 0-5% -1 b µ = 3.9 int CMS L n=4 < 2.0 GeV/c assoc T 1.5 < p(GeV/c)
trig Tp
2 4 6 8 1.0 1.5 < 2.5 GeV/c assoc T 2.0 < p(GeV/c)
trig Tp
2 4 6 8 1.0 1.5 < 3.0 GeV/c assoc T 2.5 < p(GeV/c)
trig Tp
2 4 6 8 1.0 1.5 < 3.5 GeV/c assoc T 3.0 < p(GeV/c)
trig Tp
2 4 6 8 1.0 1.5 < 5.0 GeV/c assoc T 4.0 < p(GeV/c)
trig Tp
2 4 6 8 1.0 1.5 15-20% = 2.76 TeV NN s PbPb(GeV/c)
trig Tp
2 4 6 8 1.0 1.5(GeV/c)
trig Tp
2 4 6 8 1.0 1.5(GeV/c)
trig Tp
2 4 6 8 1.0 1.5(GeV/c)
trig Tp
2 4 6 8 1.0 1.5(GeV/c)
trig Tp
2 4 6 8 1.0 1.5 35-40%(GeV/c)
trig Tp
2 4 6 8 1.0 1.5(GeV/c)
trig Tp
2 4 6 8 1.0 1.5(GeV/c)
trig Tp
2 4 6 8 1.0 1.5(GeV/c)
trig Tp
2 4 6 8 1.0 1.5 0.0 0.2 0.4 0.6 0.8 1.0 0.0 0.2 0.4 0.6 0.8 1.0)
assoc T(p
4v
×
)
trig T(p
4v
)
assoc T,p
trig T(p
∆ 4V
Figure 8: The ratios of V4∆(ptrigT , passocT )to the product of v4(ptrigT )and v4(passocT )for n=4 in the short-range (0< |∆η| <1, open circles) and long-range (2< |∆η| <4, closed circles) regions, where v4(pT) is evaluated in a fixed plowT bin of 1–1.5 GeV/c, for five intervals of passocT and centralities of 0–5%, 15–20% and 35–40%. The error bars correspond to statistical uncertainties only.
dependence of the harmonics, the extracted v2through v5are also shown in Fig. 10 as a function of Npart, for representative low (1–1.5 GeV/c), intermediate (3–3.5 GeV/c), and high (8–20 GeV/c) ptrigT ranges. (GeV/c) trig T p 5 10 15 n v 0.0 0.1 0.2 0 - 5 % | < 4 η ∆ 2 < | -1 b µ = 3.9 int CMS L 0 - 5 % -1 b µ = 3.9 int CMS L 0 - 5 % -1 b µ = 3.9 int CMS L 0 - 5 % -1 b µ = 3.9 int CMS L 2 v 3 v 4 v 5 v (GeV/c) trig T p 5 10 15 n v 0.0 0.1 0.2 20 - 25 % 20 - 25 % 20 - 25 % 20 - 25 % (GeV/c) trig T p 5 10 15 n v 0.0 0.1 0.2 40 - 50 % 40 - 50 % 40 - 50 % 40 - 50 % (GeV/c) trig T p 5 10 15 n v 0.0 0.1 0.2 5 - 10 % = 2.76 TeV NN s PbPb 5 - 10 % = 2.76 TeV NN s PbPb 5 - 10 % = 2.76 TeV NN s PbPb 5 - 10 % = 2.76 TeV NN s PbPb (GeV/c) trig T p 5 10 15 n v 0.0 0.1 0.2 25 - 30 % 25 - 30 % 25 - 30 % 25 - 30 % (GeV/c) trig T p 5 10 15 n v 0.0 0.1 0.2 50 - 60 % 50 - 60 % 50 - 60 % 50 - 60 % (GeV/c) trig T p 5 10 15 n v 0.0 0.1 0.2 10 - 15 % < 3 GeV/c assoc T 1 < p 10 - 15 % < 3 GeV/c assoc T 1 < p 10 - 15 % < 3 GeV/c assoc T 1 < p 10 - 15 % < 3 GeV/c assoc T 1 < p (GeV/c) trig T p 5 10 15 n v 0.0 0.1 0.2 30 - 35 % 30 - 35 % 30 - 35 % 30 - 35 % (GeV/c) trig T p 5 10 15 n v 0.0 0.1 0.2 60 - 70 % 60 - 70 % 60 - 70 % 60 - 70 % (GeV/c) trig T p 5 10 15 n v 0.0 0.1 0.2 15 - 20 % 15 - 20 % 15 - 20 % 15 - 20 % (GeV/c) trig T p 5 10 15 n v 0.0 0.1 0.2 35 - 40 % 35 - 40 % 35 - 40 % 35 - 40 % (GeV/c) trig T p 5 10 15 n v 0.0 0.1 0.2 70 - 80 % 70 - 80 % 70 - 80 % 70 - 80 %
Figure 9: The single-particle azimuthal anisotropy harmonics v2–v5 extracted from the long-range (2 < |∆η| < 4) azimuthal dihadron correlations as a function of ptrigT , combined with 1< passocT <3 GeV/c, for twelve centrality intervals in PbPb collisions at√sNN= 2.76 TeV. Most of the statistical error bars are smaller than the marker size. The systematic uncertainties (not shown in the plots) are indicated in Table 2.
A strong centrality dependence of v2is observed in Figs. 9 and 10 for all ptrigT ranges, while the higher-order harmonics v3–v5do not vary significantly over the range of Npart. This behaviour is expected in the context of both the hydrodynamic flow phenomena for lower-pTparticles [43] and the path-length dependence of the parton energy-loss scenario for high-pT particles [44]. The v2 harmonics are sensitive to the eccentricity of the almond-shaped initial collision re-gion that becomes larger for the peripheral events, whereas the higher-order harmonics are driven by fluctuations of the initial geometry that have little dependence on the collision cen-trality [53]. In the most peripheral events, the pTdependence of v2is found to be very different from that in the central events, as shown in Fig. 9. In the high-pT interval 8–20 GeV/c (third panel of Fig. 10), v2 increases rapidly at low Npart (very peripheral). A possible explanation is the presence of non-flow effects due to back-to-back jets. Based on the factorised Fourier coefficients from long-range dihadron correlations, the single-particle azimuthal anisotropy harmonics extracted over a wide range of pTand centrality allow a detailed comparison to the-oretical calculations of the hydrodynamics and path-length dependence of in-medium parton energy loss.
part N 100 200 300 n
v
0.0 0.1 0.2 -1 b µ = 3.9 int CMS L | < 4 η ∆ 2 < | < 1.5 GeV/c trig T 1 < p 2 v 3 v 4 v 5 v part N 100 200 300 nv
0.0 0.1 0.2 = 2.76 TeV NN s PbPb < 3.5 GeV/c trig T 3 < p part N 100 200 300 nv
0.0 0.1 0.2 < 3 GeV/c assoc T 1 < p < 20 GeV/c trig T 8 < pFigure 10: The single-particle azimuthal anisotropy harmonics, v2–v5, extracted from the long-range (2 < |∆η| <4) azimuthal dihadron correlations as a function of Npartin PbPb collisions at√sNN = 2.76 TeV for 1< passocT < 3 GeV/c in three ptrigT ranges of 1–1.5, 3–3.5 and 8–20 GeV/c. Most of the statistical error bars are smaller than the marker size. The systematic uncertainties (not shown in the plots) are indicated in Table 2.
6
Summary
The previous CMS analysis of angular correlations between charged particles has been ex-panded to cover a wide centrality range of PbPb collisions at √sNN = 2.76 TeV. As was seen previously for central PbPb collisions, the associated yields differ significantly from those ob-served in pp interactions. Correlations with both small (0< |∆η| <1) and large (2< |∆η| <4) relative pseudorapidities were again studied as a function of the transverse momentum of the trigger and associated particle pT. The integrated yield of the near-side region shows an in-creasing enhancement towards more central PbPb collisions, especially for low-pT associated particles.
To further characterise the dependence of the correlations on relative azimuthal angle, a Fourier decomposition of the distributions projected onto∆φ was performed, as a function of both cen-trality and particle pT. Evidence of a factorisation relation was observed between the Fourier coefficients (Vn∆) from dihadron correlations and single-particle azimuthal anisotropy harmon-ics (vn). This holds for passocT .3–3.5 GeV/c over the ptrigT range up to at least 8 GeV/c in central and mid-peripheral PbPb collisions, except for v2 in the most central events. The observed factorisation is absent in pp and very peripheral PbPb data, indicating a strong connection of the observed long-range azimuthal dihadron correlations to the single-particle azimuthal anisotropy in heavy ion collisions, such as the one driven by the hydrodynamic expansion of the system. The single-particle azimuthal anisotropy harmonics v2through v5were extracted over a wide range in both pTand collision centrality, profiting from the broad solid-angle cover-age of the CMS detector. The comprehensive correlation data presented in this paper are very useful for studies of the path-length dependence of in-medium parton energy-loss, and pro-vide valuable inputs to a variety of theoretical models, including hydrodynamic calculations of higher-order Fourier components.
Acknowledgments
We wish to congratulate our colleagues in the CERN accelerator departments for the excellent performance of the LHC machine. We thank the technical and administrative staff at CERN and other CMS institutes, and acknowledge support from: FMSR (Austria); FNRS and FWO (Bel-gium); CNPq, CAPES, FAPERJ, and FAPESP (Brazil); MES (Bulgaria); CERN; CAS, MoST, and NSFC (China); COLCIENCIAS (Colombia); MSES (Croatia); RPF (Cyprus); Academy of Sci-ences and NICPB (Estonia); Academy of Finland, MEC, and HIP (Finland); CEA and CNRS/IN2P3 (France); BMBF, DFG, and HGF (Germany); GSRT (Greece); OTKA and NKTH (Hungary); DAE and DST (India); IPM (Iran); SFI (Ireland); INFN (Italy); NRF and WCU (Korea); LAS (Lithua-nia); CINVESTAV, CONACYT, SEP, and UASLP-FAI (Mexico); MSI (New Zealand); PAEC (Pak-istan); SCSR (Poland); FCT (Portugal); JINR (Armenia, Belarus, Georgia, Ukraine, Uzbek(Pak-istan); MON, RosAtom, RAS and RFBR (Russia); MSTD (Serbia); MICINN and CPAN (Spain); Swiss Funding Agencies (Switzerland); NSC (Taipei); TUBITAK and TAEK (Turkey); STFC (United Kingdom); DOE and NSF (USA).
Individuals have received support from the Marie-Curie programme and the European Re-search Council (European Union); the Leventis Foundation; the A. P. Sloan Foundation; the Alexander von Humboldt Foundation; the Belgian Federal Science Policy Office; the Fonds pour la Formation `a la Recherche dans l’Industrie et dans l’Agriculture (FRIA-Belgium); the Agentschap voor Innovatie door Wetenschap en Technologie (IWT-Belgium); and the Council of Science and Industrial Research, India.
References
[1] CMS Collaboration, “Long-range and short-range dihadron angular correlations in central Pb Pb collisions at√sNN = 2.76 TeV”, JHEP 07 (2011) 076,
doi:10.1007/JHEP07(2011)076, arXiv:1105.2438.
[2] ALICE Collaboration, “Harmonic decomposition of two-particle angular correlations in Pb–Pb collisions at√sNN= 2.76 TeV”, (2011). arXiv:1109.2501.
[3] STAR Collaboration, “Disappearance of back-to-back high pThadron correlations in central Au+Au collisions at√sNN = 200 GeV”, Phys. Rev. Lett. 90 (2003) 082302,
doi:10.1103/PhysRevLett.90.082302, arXiv:nucl-ex/0210033.
[4] STAR Collaboration, “Long range rapidity correlations and jet production in high energy nuclear collisions”, Phys. Rev. C 80 (2009) 064912,
doi:10.1103/PhysRevC.80.064912, arXiv:0909.0191.
[5] STAR Collaboration, “System size dependence of associated yields in hadron-triggered jets”, Phys. Lett. B 683 (2010) 123, doi:10.1103/PhysRevC.80.064912,
arXiv:0909.0191.
[6] STAR Collaboration, “Distributions of charged hadrons associated with high transverse momentum particles in pp and Au+Au collisions at√sNN = 200 GeV”, Phys. Rev. Lett. 95 (2005) 152301, doi:10.1103/PhysRevLett.95.152301,
arXiv:nucl-ex/0501016.
[7] PHENIX Collaboration, “System size and energy dependence of jet-induced hadron pair correlation shapes in Cu+Cu and Au+Au collisions at√sNN = 200 and 62.4 GeV”, Phys. Rev. Lett. 98 (2007) 232302, doi:10.1103/PhysRevLett.98.232302,
[8] PHENIX Collaboration, “Dihadron azimuthal correlations in Au+Au collisions at√sNN = 200 GeV”, Phys. Rev. C 78 (2008) 014901, doi:10.1103/PhysRevC.78.014901, arXiv:0801.4545.
[9] PHOBOS Collaboration, “High transverse Momentum Triggered Correlations over a Large Pseudorapidity Acceptance in Au+Au Collisions at√sNN = 200 GeV”, Phys. Rev. Lett. 104 (2010) 062301, doi:10.1103/PhysRevLett.104.062301,
arXiv:0903.2811.
[10] PHOBOS Collaboration, “System size dependence of cluster properties from two-particle angular correlations in Cu+Cu and Au+Au collisions at√sNN= 200 GeV”, Phys. Rev. C 81 (2010) 024904, doi:10.1103/PhysRevC.81.024904, arXiv:0812.1172. [11] ALICE Collaboration, “Suppression of charged particle production at large Transverse
Momentum in Central Pb–Pb Collisions at√sNN =2.76 TeV”, Phys. Lett. B 696 (2011) 30,
doi:10.1016/j.physletb.2010.12.020, arXiv:1012.1004.
[12] ATLAS Collaboration, “Observation of a Centrality-Dependent Dijet Asymmetry in Lead-Lead Collisions at√sNN = 2.76 TeV with the ATLAS Detector at the LHC”, Phys. Rev. Lett. 105 (2010) 252303, doi:10.1103/PhysRevLett.105.252303,
arXiv:1011.6182.
[13] CMS Collaboration, “Observation and studies of jet quenching in PbPb collisions at nucleon-nucleon center-of-mass energy = 2.76 TeV”, Phys. Rev. C 84 (2011) 024906,
doi:10.1103/PhysRevC.84.024906, arXiv:1102.1957.
[14] N. Armesto, C. A. Salgado, and U. A. Wiedemann, “Measuring the collective flow with jets”, Phys. Rev. Lett. 93 (2004) 242301, doi:10.1103/PhysRevLett.93.242301, arXiv:hep-ph/0405301.
[15] A. Majumder, B. Muller, and S. A. Bass, “Longitudinal Broadening of Quenched Jets in Turbulent Color Fields”, Phys. Rev. Lett. 99 (2007) 042301,
doi:10.1103/PhysRevLett.99.042301, arXiv:hep-ph/0611135.
[16] C. B. Chiu and R. C. Hwa, “Pedestal and peak structure in jet correlation”, Phys. Rev. C
72(2005) 034903, doi:10.1103/PhysRevC.72.034903,
arXiv:nucl-th/0505014.
[17] C.-Y. Wong, “Momentum kick model description of the near-side ridge and jet quenching”, Phys. Rev. C 78 (2008) 064905, doi:10.1103/PhysRevC.78.064905,
arXiv:0806.2154.
[18] P. Romatschke, “Momentum broadening in an anisotropic plasma”, Phys. Rev. C 75 (2007) 014901, doi:10.1103/PhysRevC.75.014901, arXiv:hep-ph/0607327. [19] E. V. Shuryak, “On the origin of the “ridge” phenomenon induced by jets in heavy ion
collisions”, Phys. Rev. C 76 (2007) 047901, doi:10.1103/PhysRevC.76.047901, arXiv:0706.3531.
[20] S. A. Voloshin, “Two particle rapidity, transverse momentum, and azimuthal correlations in relativistic nuclear collisions and transverse radial expansion”, Nucl. Phys. A 749 (2005) 287, doi:10.1016/j.nuclphysa.2004.12.053,
[21] A. P. Mishra et al., “Super-horizon fluctuations and acoustic oscillations in relativistic heavy-ion collisions”, Phys. Rev. C 77 (2008) 064902,
doi:10.1103/PhysRevC.77.064902, arXiv:0711.1323.
[22] J. Takahashi et al., “Topology studies of hydrodynamics using two particle correlation analysis”, Phys. Rev. Lett. 103 (2009) 242301,
doi:10.1103/PhysRevLett.103.242301, arXiv:0902.4870.
[23] B. Alver and G. Roland, “Collision-geometry fluctuations and triangular flow in heavy-ion collisions”, Phys. Rev. C 81 (2010) 054905,
doi:10.1103/PhysRevC.81.054905, arXiv:1003.0194.
[24] B. H. Alver et al., “Triangular flow in hydrodynamics and transport theory”, Phys. Rev. C
82(2010) 034913, doi:10.1103/PhysRevC.82.034913, arXiv:1007.5469.
[25] B. Schenke, S. Jeon, and C. Gale, “Elliptic and triangular flow in event-by-event D= (3+1)viscous hydrodynamics”, Phys. Rev. Lett. 106 (2011) 042301, doi:10.1103/PhysRevLett.106.042301, arXiv:1009.3244.
[26] H. Petersen et al., “Triangular flow in event-by-event ideal hydrodynamics in Au+Au collisions at√sNN= 200 GeV”, Phys. Rev. C 82 (2010) 041901,
doi:10.1103/PhysRevC.82.041901, arXiv:1008.0625.
[27] J. Xu and C. M. Ko, “Effects of triangular flow on di-hadron azimuthal correlations in relativistic heavy ion collisions”, Phys. Rev. C 83 (2011) 021903,
doi:10.1103/PhysRevC.83.021903, arXiv:1011.3750.
[28] D. Teaney and L. Yan, “Triangularity and dipole asymmetry in heavy ion collisions”, Phys. Rev. C 83 (2011) 064904, doi:10.1103/PhysRevC.83.064904,
arXiv:1010.1876.
[29] ALICE Collaboration, “Higher harmonic anisotropic flow measurements of charged particles in Pb-Pb collisions at√sNN = 2.76 TeV”, Phys. Rev. Lett. 107 (2011) 032301,
arXiv:1105.3865.
[30] CMS Collaboration, “Observation of long-range near-side angular correlations in proton-proton collisions at the LHC”, JHEP 09 (2010) 091,
doi:10.1007/JHEP09(2010)091, arXiv:1009.4122.
[31] CMS Collaboration, “The CMS experiment at the CERN LHC”, JINST 0803 (2008) S08004, doi:10.1088/1748-0221/3/08/S08004.
[32] CMS Collaboration, “Measurement of CMS Luminosity”, CMS Physics Analysis Summary CMS-PAS-EWK-10-004, (2010).
[33] CMS Collaboration, “Absolute luminosity normalization”, CMS Detector Performance Summary CMS-DP-2011-002, (2011).
[34] M. L. Miller et al., “Glauber modeling in high-energy nuclear collisions”, Ann. Rev. Nucl. Part. Sci. 57 (2007) 205, doi:10.1146/annurev.nucl.57.090506.123020.
[35] B. Alver et al., “The PHOBOS Glauber Monte Carlo”, (2008). arXiv:0805.4411. [36] CMS Collaboration, “Dependence on pseudorapidity and centrality of charged hadron
production in PbPb collisions at a nucleon-nucleon centre-of-mass energy of 2.76 TeV”, JHEP 08 (2011) 141, doi:10.1007/JHEP08(2011)141, arXiv:1107.4800.
[37] CMS Collaboration, “CMS physics technical design report: Addendum on high density QCD with heavy ions”, J. Phys. G 34 (2007) 2307,
doi:10.1088/0954-3899/34/11/008.
[38] CMS Collaboration, “Tracking and Vertexing Results from First Collisions”, CMS Physics Analysis Summary CMS-PAS-TRK-10-001, (2010).
[39] I. P. Lokhtin and A. M. Snigirev, “A model of jet quenching in ultrarelativistic heavy ion collisions and high-pThadron spectra at RHIC”, Eur. Phys. J. C 45 (2006) 211,
doi:10.1140/epjc/s2005-02426-3, arXiv:hep-ph/0506189.
[40] J. Putschke, “Intra-jet correlations of high-pthadrons from STAR”, J. Phys. G 34 (2007) S679, doi:10.1088/0954-3899/34/8/S72, arXiv:nucl-ex/0701074.
[41] STAR Collaboration, “Anomalous centrality evolution of two-particle angular
correlations from Au-Au collisions at√sNN= 62 and 200 GeV”, arXiv:1109.4380. [42] S. Voloshin and Y. Zhang, “Flow study in relativistic nuclear collisions by Fourier
expansion of azimuthal particle distributions”, Z. Phys. C 70 (1996) 665, doi:10.1007/s002880050141, arXiv:hep-ph/9407282.
[43] S. A. Voloshin, A. M. Poskanzer, and R. Snellings, “Collective phenomena in non-central nuclear collisions”, arXiv:0809.2949.
[44] PHENIX Collaboration, “Azimuthal anisotropy of neutral pion production in Au+Au collisions at√sNN= 200 GeV: Path-length dependence of jet quenching and the role of initial geometry”, Phys. Rev. Lett. 105 (2010) 142301,
doi:10.1103/PhysRevLett.105.142301, arXiv:1006.3740.
[45] S. A. Bass et al., “Systematic comparison of jet energy-loss schemes in a realistic hydrodynamic medium”, Phys. Rev. C 79 (2009) 024901,
doi:10.1103/PhysRevC.79.024901, arXiv:0808.0908.
[46] S. Peign´e and A. V. Smilga, “Energy losses in a hot plasma revisited: QCD versus QED”, Phys. Usp. 52 (2009) 659, doi:10.3367/UFNe.0179.200907a.0697,
arXiv:0810.5702. Usp. Fiz. Nauk 179 (2009) 697.
[47] S. S. Gubser et al., “Gluon energy loss in the gauge-string duality”, JHEP 10 (2008) 052,
doi:10.1088/1126-6708/2008/10/052, arXiv:0803.1470.
[48] S. Wicks et al., “Elastic, inelastic, and path length fluctuations in jet tomography”, Nucl. Phys. A 784 (2007) 426, doi:10.1016/j.nuclphysa.2006.12.048,
arXiv:nucl-th/0512076.
[49] C. Marquet and T. Renk, “Jet quenching in the strongly-interacting quark-gluon plasma”, Phys. Lett. B 685 (2010) 270, doi:10.1016/j.physletb.2010.01.076,
arXiv:0908.0880.
[50] N. Borghini et al., “A New method for measuring azimuthal distributions in nucleus-nucleus collisions”, Phys. Rev. C 63 (2001) 054906,
doi:10.1103/PhysRevC.63.054906, arXiv:nucl-th/0007063.
[51] N. Borghini et al., “Flow analysis from multiparticle azimuthal correlations”, Phys. Rev. C
64(2001) 054901, doi:10.1103/PhysRevC.64.054901,
[52] M. Luzum and J.-Y. Ollitrault, “Directed flow at midrapidity in heavy-ion collisions”, Phys. Rev. Lett. 106 (2011) 102301, doi:10.1103/PhysRevLett.106.102301, arXiv:1011.6361.
[53] B. Alver et al., “Importance of correlations and fluctuations on the initial Source
Eccentricity in High-Energy Nucleus-Nucleus collisions”, Phys. Rev. C 77 (2008) 014906, doi:10.1103/PhysRevC.77.014906, arXiv:0711.3724.
A
The CMS Collaboration
Yerevan Physics Institute, Yerevan, Armenia
S. Chatrchyan, V. Khachatryan, A.M. Sirunyan, A. Tumasyan Institut f ¨ur Hochenergiephysik der OeAW, Wien, Austria
W. Adam, T. Bergauer, M. Dragicevic, J. Er ¨o, C. Fabjan, M. Friedl, R. Fr ¨uhwirth, V.M. Ghete, J. Hammer1, M. Hoch, N. H ¨ormann, J. Hrubec, M. Jeitler, W. Kiesenhofer, A. Knapitsch, M. Krammer, D. Liko, I. Mikulec, M. Pernicka†, B. Rahbaran, C. Rohringer, H. Rohringer, R. Sch ¨ofbeck, J. Strauss, A. Taurok, F. Teischinger, P. Wagner, W. Waltenberger, G. Walzel, E. Widl, C.-E. Wulz
National Centre for Particle and High Energy Physics, Minsk, Belarus V. Mossolov, N. Shumeiko, J. Suarez Gonzalez
Universiteit Antwerpen, Antwerpen, Belgium
S. Bansal, L. Benucci, T. Cornelis, E.A. De Wolf, X. Janssen, S. Luyckx, T. Maes, L. Mucibello, S. Ochesanu, B. Roland, R. Rougny, M. Selvaggi, H. Van Haevermaet, P. Van Mechelen, N. Van Remortel, A. Van Spilbeeck
Vrije Universiteit Brussel, Brussel, Belgium
F. Blekman, S. Blyweert, J. D’Hondt, R. Gonzalez Suarez, A. Kalogeropoulos, M. Maes, A. Olbrechts, W. Van Doninck, P. Van Mulders, G.P. Van Onsem, I. Villella
Universit´e Libre de Bruxelles, Bruxelles, Belgium
O. Charaf, B. Clerbaux, G. De Lentdecker, V. Dero, A.P.R. Gay, G.H. Hammad, T. Hreus, A. L´eonard, P.E. Marage, L. Thomas, C. Vander Velde, P. Vanlaer, J. Wickens
Ghent University, Ghent, Belgium
V. Adler, K. Beernaert, A. Cimmino, S. Costantini, G. Garcia, M. Grunewald, B. Klein, J. Lellouch, A. Marinov, J. Mccartin, A.A. Ocampo Rios, D. Ryckbosch, N. Strobbe, F. Thyssen, M. Tytgat, L. Vanelderen, P. Verwilligen, S. Walsh, N. Zaganidis
Universit´e Catholique de Louvain, Louvain-la-Neuve, Belgium
S. Basegmez, G. Bruno, J. Caudron, L. Ceard, J. De Favereau De Jeneret, C. Delaere, T. du Pree, D. Favart, L. Forthomme, A. Giammanco2, G. Gr´egoire, J. Hollar, V. Lemaitre, J. Liao, O. Militaru, C. Nuttens, D. Pagano, A. Pin, K. Piotrzkowski, N. Schul
Universit´e de Mons, Mons, Belgium N. Beliy, T. Caebergs, E. Daubie
Centro Brasileiro de Pesquisas Fisicas, Rio de Janeiro, Brazil G.A. Alves, D. De Jesus Damiao, M.E. Pol, M.H.G. Souza
Universidade do Estado do Rio de Janeiro, Rio de Janeiro, Brazil
W.L. Ald´a J ´unior, W. Carvalho, A. Cust ´odio, E.M. Da Costa, C. De Oliveira Martins, S. Fonseca De Souza, D. Matos Figueiredo, L. Mundim, H. Nogima, V. Oguri, W.L. Prado Da Silva, A. Santoro, S.M. Silva Do Amaral, L. Soares Jorge, A. Sznajder
Instituto de Fisica Teorica, Universidade Estadual Paulista, Sao Paulo, Brazil
T.S. Anjos3, C.A. Bernardes3, F.A. Dias4, T.R. Fernandez Perez Tomei, E. M. Gregores3, C. Lagana, F. Marinho, P.G. Mercadante3, S.F. Novaes, Sandra S. Padula
Institute for Nuclear Research and Nuclear Energy, Sofia, Bulgaria
V. Genchev1, P. Iaydjiev1, S. Piperov, M. Rodozov, S. Stoykova, G. Sultanov, V. Tcholakov, R. Trayanov, M. Vutova
University of Sofia, Sofia, Bulgaria
A. Dimitrov, R. Hadjiiska, A. Karadzhinova, V. Kozhuharov, L. Litov, B. Pavlov, P. Petkov Institute of High Energy Physics, Beijing, China
J.G. Bian, G.M. Chen, H.S. Chen, C.H. Jiang, D. Liang, S. Liang, X. Meng, J. Tao, J. Wang, J. Wang, X. Wang, Z. Wang, H. Xiao, M. Xu, J. Zang, Z. Zhang
State Key Lab. of Nucl. Phys. and Tech., Peking University, Beijing, China
C. Asawatangtrakuldee, Y. Ban, S. Guo, Y. Guo, W. Li, S. Liu, Y. Mao, S.J. Qian, H. Teng, S. Wang, B. Zhu, W. Zou
Universidad de Los Andes, Bogota, Colombia
A. Cabrera, B. Gomez Moreno, A.F. Osorio Oliveros, J.C. Sanabria Technical University of Split, Split, Croatia
N. Godinovic, D. Lelas, R. Plestina5, D. Polic, I. Puljak1 University of Split, Split, Croatia
Z. Antunovic, M. Dzelalija, M. Kovac Institute Rudjer Boskovic, Zagreb, Croatia
V. Brigljevic, S. Duric, K. Kadija, J. Luetic, S. Morovic University of Cyprus, Nicosia, Cyprus
A. Attikis, M. Galanti, J. Mousa, C. Nicolaou, F. Ptochos, P.A. Razis Charles University, Prague, Czech Republic
M. Finger, M. Finger Jr.
Academy of Scientific Research and Technology of the Arab Republic of Egypt, Egyptian Network of High Energy Physics, Cairo, Egypt
Y. Assran6, A. Ellithi Kamel7, S. Khalil8, M.A. Mahmoud9, A. Radi10 National Institute of Chemical Physics and Biophysics, Tallinn, Estonia A. Hektor, M. Kadastik, M. M ¨untel, M. Raidal, L. Rebane, A. Tiko
Department of Physics, University of Helsinki, Helsinki, Finland V. Azzolini, P. Eerola, G. Fedi, M. Voutilainen
Helsinki Institute of Physics, Helsinki, Finland
S. Czellar, J. H¨ark ¨onen, A. Heikkinen, V. Karim¨aki, R. Kinnunen, M.J. Kortelainen, T. Lamp´en, K. Lassila-Perini, S. Lehti, T. Lind´en, P. Luukka, T. M¨aenp¨a¨a, T. Peltola, E. Tuominen, J. Tuominiemi, E. Tuovinen, D. Ungaro, L. Wendland
Lappeenranta University of Technology, Lappeenranta, Finland K. Banzuzi, A. Korpela, T. Tuuva
Laboratoire d’Annecy-le-Vieux de Physique des Particules, IN2P3-CNRS, Annecy-le-Vieux, France
D. Sillou
DSM/IRFU, CEA/Saclay, Gif-sur-Yvette, France
M. Besancon, S. Choudhury, M. Dejardin, D. Denegri, B. Fabbro, J.L. Faure, F. Ferri, S. Ganjour, A. Givernaud, P. Gras, G. Hamel de Monchenault, P. Jarry, E. Locci, J. Malcles, M. Marionneau, L. Millischer, J. Rander, A. Rosowsky, I. Shreyber, M. Titov