Conceptualizing Interaction in online grocery shopping:
mapping the customer’s mindset
Miguel Armando Oliveira Henriques Carneiro
Relatório de Dissertação
Orientador na FEUP: Professora Doutora Lía Patrício
Orientadores na Wipro Retail: Engenheiro José Ribas e Engenheiro Hugo Neto
Abstract
The commerce of grocery is one the oldest and most commonly used forms of services. Although some people claim to enjoy shopping for the household, for a vast majority of people, grocery shopping has become a chore both time-consuming and stressful for the everyday consumer. The rise of the Internet as a global communication tool has created new forms of businesses and forced many more to adapt to increasingly informed, savvy and demanding customers, and in many industries, e-commerce figures are showing that people are finally ready to buy remotely in the comfort of their homes. It would therefore be foreseeable that the convenience provided by remote grocery shopping would persuade consumers to refill their pantries and fridges without leaving the house.
Grocery, however, is among the business categories with the least successful penetration on the Web. While this has been noted a number of times in previous studies and industry reports, the research community has tried to approach the issue through many different areas. The specifics of grocery shopping are pointed out as main factors for this divergence. Unlike other types of commerce, shopping for groceries is a repetitive process, where clients most often purchase the same products as they did on previous visits, according to their preference. Also, it is the kind of shopping where an order usually includes several items in different quantities, and where tools like shopping lists to assist memory and implicit knowledge to decide quantities are often required. Moreover, because grocery products are usually low-risk, low-interest products, decisions theories show that clients often make a satisfying decision, instead of “the best” one. In spite of these specific characteristics thoroughly discussed throughout literature, grocery e-commerce websites are still implemented at the convenience of the developer and the retailer and not that of the client.
In this research, we argue that the customer mindset for grocery shopping is not being correctly mapped into online grocery solutions. After benchmarking current online solutions and identifying tools and theories that assist our research to define a theoretical framework for the study, a client study was carried out to draw conclusions on the customer activities and decision-making patterns when shopping at the grocery store. Finally, a user-centred design approach was adopted to develop a prototype that incorporates ideas, methods and tools uncovered in the course of this investigation, which can be evaluated by potential customers and compared to what is currently available.
Acknowledgements
In the course of this dissertation, I had the privilege of working with and benefited from the invaluable contributions of several people and figures, which I would like to acknowledge and appreciate.
To my company supervisors at Wipro, Engenheiro José Ribas and Engenheiro Hugo Maia Neto. Thank you for showing interest in this project from its initial stage and guiding me through all my difficult decisions.
To my University supervisor, Professora Doutora Lia Patrício, for helping me stay on track, acknowledging my opinions while guiding me through the process of writing a dissertation.
To the Direction of MESG and all involved, for making this course possible. I have grown both as a person and a professional.
To my close friends, family, girlfriend and Eddie, for keeping me coherent in times of distress and all my friends and colleagues who contributed directly or indirectly to this dissertation.
To all participants of this investigation, for your patience, time and interest. I could not have done this without you.
To the riverside of my beautiful city, Porto, for inspiration and serenity, when I most needed it.
Finally, a special word to my colleagues and friends at MESG that while having dissertations of their own to write, never ignore a call for help. True champions!
To all of you, my sincere appreciation. Miguel Armando Oliveira Henriques Carneiro
1 INTRODUCTION ... 9
1.1 DESCRIPTION OF THE PROBLEM ... 9
1.2 WIPRO RETAIL ... 10
1.3 DISSERTATION OBJECTIVES ... 11
1.4 ORGANIZATION ... 11
2 STATE OF THE ART ... 13
2.1 GROCERY RETAIL ... 13
2.2 CUSTOMER CENTRICITY ... 16
2.3 ELETRONIC SERVICE QUALITY ASSESSMENT ... 22
2.4 PRINCIPLES OF INTERACTION DESIGN ... 26
2.5 ANTICIPATING CUSTOMER DECISIONS ... 30
2.6 CATEGORIZING PRODUCT DATA ... 33
3 METHODOLOGY... 37
3.1 PHASE 1:PREPARATION ... 38
3.2 PHASE 2:ANALYSIS OF CONSUMER BEHAVIOUR ... 39
3.3 PHASE 3:SOLUTION CONCEPT DEVELOPMENT ... 39
3.4 PHASE 4:FUNCTIONAL PROTOTYPE AND USER EVALUATION ... 40
4 STUDY OF CLIENT NEEDS AND CONTEXT ... 41
4.1 CLIENT ACTIVITIES AT GROCERY STORE ... 41
4.2 USE OF SHOPPING LISTS ... 44
4.3 USAGE OF CURRENT ONLINE SOLUTIONS ... 45
4.4 EVALUATION OF OTHER CURRENT SOLUTIONS ... 46
5 PROPOSED SOLUTION ... 49
5.1 GUIDELINES ... 49
5.2 SERVICE CONCEPT AND BLUEPRINTING ... 49
5.3 CONCEPTUAL MODEL DEVELOPED FOR PROTOTYPE... 53
5.4 SOLUTION DATA MODEL ... 55
5.5 PRODUCT RECOMMENDATION ... 56
5.6 FUNCTIONAL PROTOTYPE ... 59
5.7 PROTOTYPE EVALUATION AND RESULTS... 62
6 CONCLUSIONS ... 65
6.1 LIMITATIONS AND DIFFICULTIES ... 65
6.2 CONTRIBUTION ... 65
6.3 FUTURE WORK ... 66
14 ANNEX 7 – PROTOTYPE ITERATIONS ... 76
15 ANNEX 8 – FUNCTIONAL PROTOTYPE DATABASE MODEL ... 77
16 ANNEX 9 – PROTOTYPE EVALUATION ... 78
Figure 1 - Easi-Order ... 14
Figure 2 - Klever-Kart ... 14
Figure 3 - GIT prototype ... 14
Figure 4 - Intelligent Refrigerator Source: IRL ... 15
Figure 5 - Easy Grocery : 3D Visualization of Grocery Store ... 15
Figure 6 - Outcome Driven Innovation - the Universal Job Map - Source: Strategyn ... 16
Figure 7 - From customer jobs to solution design – Source: Strategyn ... 17
Figure 8 - Blueprint Example - Source: Arizona State University - School of Business ... 18
Figure 9 - Activity Modelling Vocabulary - Source: Constantine, 2006 ... 19
Figure 10 - Process of User-Centered Design ... 20
Figure 11 - Example of Context Map (Constantine, 2006) ... 20
Figure 12 - Example of Activity Map (Constantine, 2006) ... 20
Figure 13 - Gaps Model - Source: Parasuraman ... 22
Figure 14 - The Kano Model of Quality Source: WikiCommons ... 23
Figure 15 - Weighted preference of online service attributes Source Wilson-Jeanselme M, Reynolds J, 2006 ... 24
Figure 16 - Weighted preference of attributes for 3 online supermarketsSource Wilson-Jeanselme M, Reynolds J, 2006 ... 24
Figure 17 - Usability Goals - Source: Interaction Design (Preece, Rogers et al , 2002) ... 26
Figure 18 - Usability Engineering Lifecycle Source: Interaction Design Preece 2002 ... 28
Figure 19 - Five stages of consumer decision process (UIE study – uie.com) ... 30
Figure 20 - Completeness of consumer decision stages (guuui.com) ... 31
Figure 21 - Category Definition Example... 34
Figure 22 - Example of Beer Consumer Decision Tree - Source: ezpog.com ... 35
Figure 23 - Methodology ... 37
Figure 24 - Project Timeplan ... 37
Figure 26 – Activity Map for Grocery Shopping... 42
Figure 27 – Participation Map for grocery shopping ... 43
Figure 28 - Grocery Shopping Process at store... 44
Figure 29 - Online Grocery Retail Blueprint - oversimplified ... 50
Figure 30 - Blueprint Enter Order ... 51
Figure 31 - Decision Strategies ... 51
Figure 32 - Integration of client knowledge and service ... 53
Figure 33 - Personalized Shopping Environment ... 54
Figure 34 - Website Layout... 54
Figure 35 - A product shelf ... 55
Figure 36 - Category Attribute Definition - The Water Example ... 56
Figure 37 - Deriving Product Preferences and substitute suggestions ... 57
Figure 39 - Functional Prototype’s Initial screen ... 60
Figure 40 - Bringing a product into context... 60
Figure 41 - Product added to favourites ... 61
Figure 42 - Adding a product tag ... 61
Figure 43 - Detailed product Information ... 61
Figure 44- Suggestions based text search ... 61
Figure 45 - Section Browsing Flow ... 62
Figure 46 - Service Design Tools - Source: martin-kose.de ... 70
Figure 47 - First Iteration of Low-Resolution Prototype ... 76
Figure 48 - Second Iteration of Low-Resolution Prototype ... 76
Figure 49 - Third Iteration of Low-Resolution Prototype ... 76
Figure 50 - Fourth and Final Iteration of Low-Resolution Prototype ... 76
Figure 51 – Database model for functional prototype ... 77
Table 1 - Online Grocery Solutions Benchmarking ... 47
1 Introduction
1.1 Description of the Problem
In many economies over the world, services represent over 70% of the gross domestic product and figures indicate that this number is yet to increase. Under what is being frequently called a service economy, only in the last few years has any attention been given to the innovation in this sector. While innovation has been largely focused around the evolution of technology, services are complex systems of clients, employees and processes, all supported by technology. Under this pretence, a research community has been growing around the area of services, striving to consolidate the science behind the service industry, and foster the innovation in this sector.
Grocery Retail is one the oldest and most essential forms of retail services. Not only does grocery shopping represent a big part of a person’s monthly expenditure, it also can prove to be a time-consuming, stressful task that needs to be carried out by customers. Most major grocery retailers have therefore undertook the strategy of selling their products online, advertising a convenient, stress-free task that can be performed remotely. Ordering grocery online, although not allowing to physically evaluate the products before buying them (fact valued by a lot of customers), allows the consumer to bypass the trouble of driving to the store, walking around the store to find the products and transporting them back home. With a changing reality of working family households with an increasingly limited time to spare, hence putting a greater value on how they spend their time off work, it would be expected that online grocery sales would have taken off and be on the way to replacing the significance of physical stores. However, although the benefits of remote shopping have revolutionized many forms of business, grocery is at the bottom of the list in terms of online penetration.
A few approaches have been discussed and researched to address this matter. Grocery shopping is different from other forms of shopping, especially in its online component. On the one hand, it is a repetitive process, in which consumers are not looking to buy one single specific item that they have never bought before (such as the case of books or technology products), but instead work in a cyclic manner where very often the client buys the same items as usual to refill his/her consuming needs. On the other hand, the benefits of detailed product information are not as clear in grocery as they are in other forms of online retail, since consumers are more familiar with the type of products being bought. Approaches to address
Another approach to e-grocery shopping has been the use of customer data to personalize the shopping experience. Product recommendation algorithms have been suggested (Min H , 2006 ; Cumby et al 2005), to a wide range of extents, inclusively with the purpose of predicting the customer’s shopping list integrally, based on a number of indicators derived from customer data.
Some authors also suggest that the reason why clients cannot easily find their products online is related to an inadequate categorization of the retailer’s product range (Kornum, Bjerre, 2005), making it thus difficult for the client to find a desired product within the retailer’s assortment..
In fact, there seem to be sufficient tools and ideas that appear promising to improve the perceived value of shopping for grocery online. The reality is, however, that these approaches have not yet been integrated to devise a simple, well-structured and intelligent solution that reflects to consumer’s mindset and can be tested.
The purpose of this research is therefore to take from all these approaches, and follow a user-centred approach to designing a solution which can be tested by customers on the level of electronic service quality, namely service efficiency and customer perceived value.
1.2 Wipro Retail
Wipro Retail is a technology-based services company specialized in the retail sector. It came to be in 2006 when Wipro Technologies acquired Enabler, a company created originally by retailer for retailers. Wipro Retail’s client base consists mainly of worldwide high-profile retailers that rely on the deep know-how of the retail business offered by the company’s assets. Such clients include Morrisons, Supervalu, Tesco, Sonae, Ahold, Carrefour, Walmart, amongst many others, and extend throughout many retail industries (Fashion, Grocery, DIY, Department Stores and Wholesale).
Many of the retailers now requesting services from Wipro Retail are grocery retailers, relying on the company’s proven know-how and history of successful implementations. Although most projects implement customized Oracle Retail solutions, the company has fostered a mentality of innovation, offering new solutions fully adapted to each client’s needs.
As a part of the company’s innovation process, the need for a new solution in the area of grocery e-commerce has been identified, and the on-going process of understanding the customer behaviour patterns has triggered a new project aiming to develop a solution that integrates the complexity of operations behind a grocery retail business, and the simplicity needed to interface with an online solution that responds to an everyday need, such as grocery shopping. The purpose of a solution such as the one proposed would be to increase customer satisfaction and simplifying the buying process, hence motivating customers to buy online, and uplifting online sales.
1.3 Dissertation objectives
For this research, the goal set was to identify elements of online grocery commerce which could improve customer experience and efficiency in online grocery commerce, and attempt to design a solution which addresses the main faults found.
This goal can be separated is the following sub-goals:
• Understand and describe customer behaviour and context in grocery shopping o Identify the most important drivers of choice
o Prioritize customer needs when shopping online
o Describe common pattern of thought when shopping grocery • Identify and describe current tools and algorithms available
o Tools for online grocery shopping usability
o Tools for developing and analyzing shopping patterns • Propose front office – prototyping and validation
o Propose database meta-model for suggested solution
o Develop prototype aimed for simplicity using information about buying process, usability guidelines and customer intelligence to customizer user experience.
o Evaluate prototype
1.4
Organization
This dissertation is organized into five parts. We begin by reviewing related work and literature to accurately project a theoretical framework that supports the relevance of this investigation. In section 3, we describe the methodology followed in the course of the exercise. The report then describes the main observations and describes the finding in the study of client needs. In section 5, the proposed solution is presented based on the information acquired thus far, and discuss the evaluation and results of the functional prototype developed. Finally, we draw conclusion of the investigation and suggestion future possibilities of work in the subject discussed.
2 State of the Art
2.1 Grocery Retail
The Internet has changed the way we, as a society, live. Since the dawning of the Web, systems to aid our everyday lives have been developing rapidly, and its benefits are obvious to every business and individual. E-Commerce is the Web’s buzzword for online shopping and it has revolutionized the way retailers do their businesses.
Online Grocery shopping, however, has been falling behind expectations in relation to e-commerce in other areas (Ramus, Nielsen, 2005), particularly when considering share of total consumer spending against offline orders.
While businesses of all types have been trying to make their interaction with the customer more conversational, especially with the rise of the Internet as a means to communicate to a wider public at a lower cost, grocery retailing is one business that has not yet achieved this goal to all its potential, especially considering the huge amounts of data collected by retailers about their customers nowadays.
The following chapter briefly describes the evolution of e-grocery and more recent innovative views of electronic grocery commerce, namely in mobile computing.
2.1.1 The evolution of Grocery E-Commerce
In the prime of the dot com era, in the 90’s, US-based Webvan was created as the first major online grocery store. It focused mainly on technology, allowing clients to order their products online and using advanced functionality for the time like shopping carts and online payments from an early stage. Around 2001, though, Webvan filed for bankruptcy, leaving room for another online solution, mostly focused on its delivery processes and existing infra-structure to succeed. That company was Peapod later bought by Royal Ahold, and still today stands out as one of the leading Grocery E-Commerce sites, although delivering only for selected states in the USA. As described by (Lunce, Lunce, Maniam, 2005), for years, grocery was seen as a retail business which had no place in the Web.
Nowadays, however, grocery retailers battle each other for any piece of competitive advantage, and online sales are seen as one of the ways to go. Even traditional retailers have
In Portugal, the two main websites for online grocery shopping are Continente Online and @Jumbo. Both have similar interfaces, implementing a category browsing mindset, with searching capabilities included and shopping lists and shopping cart functionalities. An early evaluation, complemented with the studies at Wipro, showed that these websites are not as easy or efficient to use as they could be and to not simplify the customer buying process nor do they make use of the implicit consumer intelligence.
2.1.2 Mobile E-Grocery and the future of Grocery
Besides E-Commerce, other E-Grocery solutions have been developed and are research solutions have been proposed, that attempt to address the same problem of customer-centricity, many of which were implemented in mobile devices. This stresses the fact that there is a potential to assist client in their grocery shopping through technology.
One of the most well-known is the Easi-Order (Newcomb, Pashley, Stasko, 2003), an application installed in a PDA that focused on the creation of a personal shopping list that could be sent to the online store. This solution was implemented in several Safeway stores across the UK. The Shoppers Eye addressed the lack of awareness of customer in relation to existing buying opportunities. By carrying a handheld device around in the shopping mall, the customer was able to share its shopping list with retailers which in turn made their bids. Klever-Kart is a solution embedded on the shopping cart which provided the customer useful information on products, such as sales, nutrition, etc. The Georgia Institute of Technology proposed a solution of a PDA application very focused on simplicity and ease of use, aimed at aiding the consumer around the grocery stores, providing a map of the stores and integrated a shopping list functionality that helped the customer find the items on the list.
Figure 1 - Easi-Order Figure 2 - Klever-Kart Figure 3 - GIT prototype
For long now, grocery has also been pointed out as one of the prime targets of ubiquitous computing. The idea of intelligent refrigerators and a smart home in general, may involve a lot of research in aligning technology, retailer’s processes and client interfaces, and indeed some intelligent grocery system have been suggested, like iGrocer (Shakar, Nair, Helal, 2003) and MyGrocer (Kourouthanasis et al. 2002). The existence of these systems and research support the assumption that grocery shopping is based on repetitive patterns of purchase, as opposed to careful consideration on each purchase.
Figure 4 - Intelligent Refrigerator Source: IRL
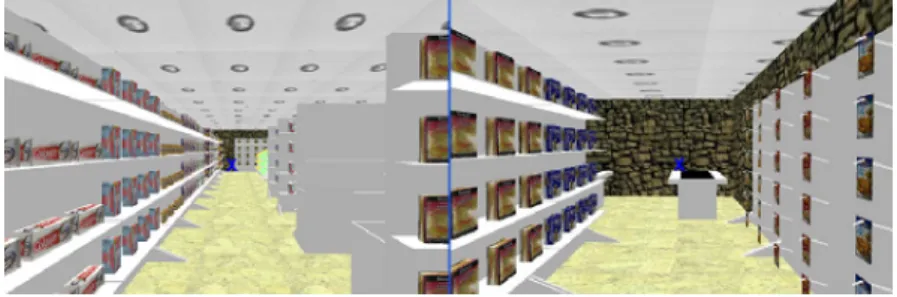
Easy Grocery (Sommerville, Stuart, Barlow, 2006) is another interesting work, which suggests the future of grocery shopping may be associated with better visual representation of products and store layout, through a user interface. The solution presented, suggests a 3D representation of the store, in which the user can navigate and select the products from the virtual shelves.
2.2 Customer Centricity
The common point between all service forms is the existence of a client for which the service is being provided. Not surprisingly, with the rise of the service dominant logic, several efforts have been made to better understand the customer context and design services to better serve him/her. The following section describes a few tools and ideas that assist the service-thinking centred on the customer.
2.2.1 Outcome-Driven Innovation
Innovative solutions can change the way people like, create entire markets and leave others to oblivion. Disruptive innovation, however, is not easy to come by, but without an innovative frame of mind, a company cannot think of its business as long-term. Companies like Apple and Google have actually assumed innovation as one of their implicit benefits, have are therefore always under pressure to come up with revolutionizing products. A focus on customer activities has therefore become evident, as a way of studying how to satisfy any client unfulfilled need and therefore be innovative at the eyes of the customer.
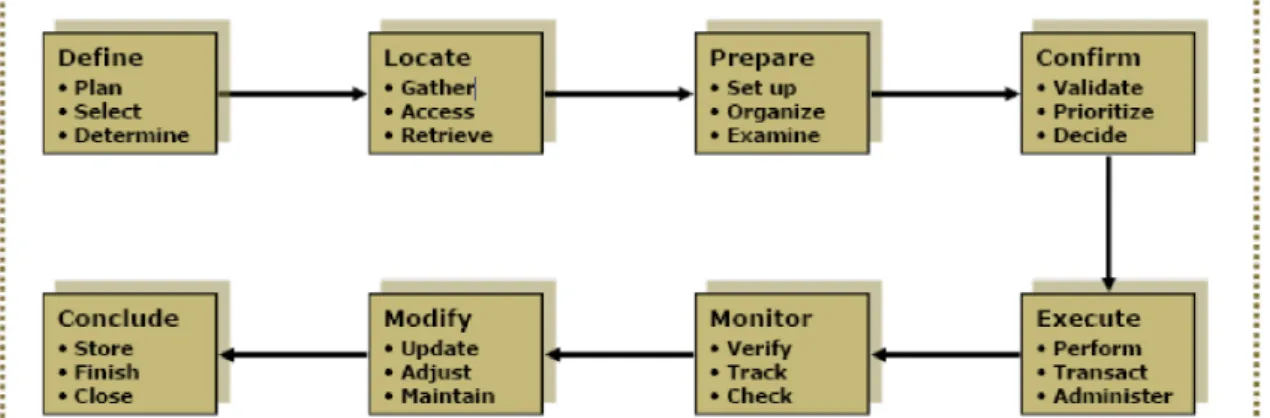
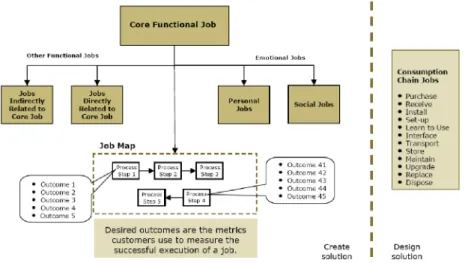
Outcome-Driven Innovation (ODI) is a method that aims to transform the process of Innovation from an unstructured ideas-first model, to a clear step-by-step framework that starts with the identification of customer needs and maps the needs to be satisfied with the opportunity their provide for successful innovation. The authors argue that customer needs must be taken into account as a part of a customer job, i.e. the customer wants to use the functionality of a product or service as a part of a bigger purpose. A product or service may satisfy more than one job, and customer jobs can be emotional (i.e social or personal) or functional. (Ulwick ,2009) defines the universal job map as a generalization of the process that most jobs needs to go through – Define, Locate, Prepare, Confirm, Conclude, Modify, Monitor and Execute.
Figure 6 - Outcome Driven Innovation - the Universal Job Map - Source: Strategyn Each step of the process is divided into actions, which have desired outcomes by clients, commonly perceived as user needs. By analysing each action taken in a customer job, a company can have a structured view of the customer needs implied in using a product in their
real context, and can be examined individually by importance and satisfaction yielded. The method of ODI then suggests an opportunity algorithm that weights the satisfaction against the importance and returns an opportunity indicator, showing the level of impact the innovation step can have in the market.
Figure 7 - From customer jobs to solution design – Source: Strategyn
This approach is important to this investigation because it supports the assumption that in a client-oriented business world, one has to start the analysis from the customer jobs and context to provide noteworthy innovations to a sector. Not only focusing on the functional jobs being carried out, outcome-driven innovation shows how to think outside the innovation box and inside the customer head.
2.2.2 Service Blueprinting
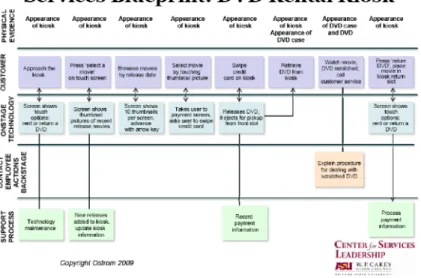
Service Blueprinting is practical tool that assists innovation is services. Sharing some similarities with BPMN and UML, this tool represents a simplified notation highly oriented towards the needs of service Innovation, in a manner that is understandable not only for the service designers, but also to clients and other company stakeholders, such as managers and frontline employees. As such, it allows collaborative design of the service process, leaving the least amount of ambiguity to the implementation phase. It can be used not only to develop new services, but also to improve existing ones. A Service Blueprint consists on a diagram
Figure 8 - Blueprint Example - Source: Arizona State University - School of Business
In the context of service blueprinting, three lines of separation are described and exemplified in the diagram. The line of customer interaction, which indicates between which actions of the system the client interacts with onstage actors; the line of customer visibility, which indicates from which point the customer looses visibility of the service operations, and the line of internal interaction, which indicates the stage where the service operations are solely backstage and performed within the company.
Service Blueprinting is a tool to assist the evaluation of the service operations and design of the customer experience, and although an initial framework is suggested by the original authors, several light variations of the diagrams exist in the literature, focusing on the service specifics.
2.2.3 Customer Experience in Online Grocery Shopping
A service transaction is an intangible, transformational process that occurs across a certain period of time. As such, it is essential that the customer has a positive experience when being served. (Meyer, Schwager, 2007) divide customer experience as the internal and subjective responses to direct or indirect contacts with the company. While direct contact refers to the course of the service being provided by the company, indirect contact involves other encounters with representations of the company, such as word-of-mouth, recommendations, news reports, etc.
In the context of online shopping in general, and grocery shopping in particular, usability plays a great role in customer experience, mainly in regards of an efficient and logical shopping experience (Freeman, 2006). Ease of use and intelligent product recommendations have been appointed as key benefits to drive positive customer experience when making use of a grocery e-commerce solution, serving as the main drivers of repeated purchase and
customer satisfaction. Hence, it comes with no surprise that Human Computer Interaction has been playing an increasingly important role in the design of e-commerce websites.
2.2.4 Activity Modelling
Some form of representation is necessary to illustrate the context of customers and their interaction with it. (Constantine, 2006) provides a user-centred approach to representing user context and its own vocabulary. This tool bares resemblances to Unified Modelling Language (UML) and BPMN (Business Process Modelling Notation), but focuses on the interaction of participants with the context.
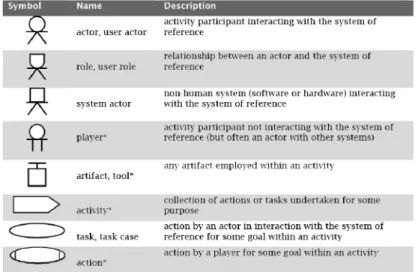
According to (Constantine, 2006), activity modelling is “a systematic approach to organizing and representing contextual aspects of tool use”. This method is based on the Activity Theory, a way of describing and characterizing the structure of human activity, and provides a set of guidelines, as well as a systematic set of tools to represent user context. (Constantine, 2006), describes a vocabulary specific to this representation, partly inherited from other framework of context representation, represented in figure 9.
Figure 9 - Activity Modelling Vocabulary - Source: Constantine, 2006
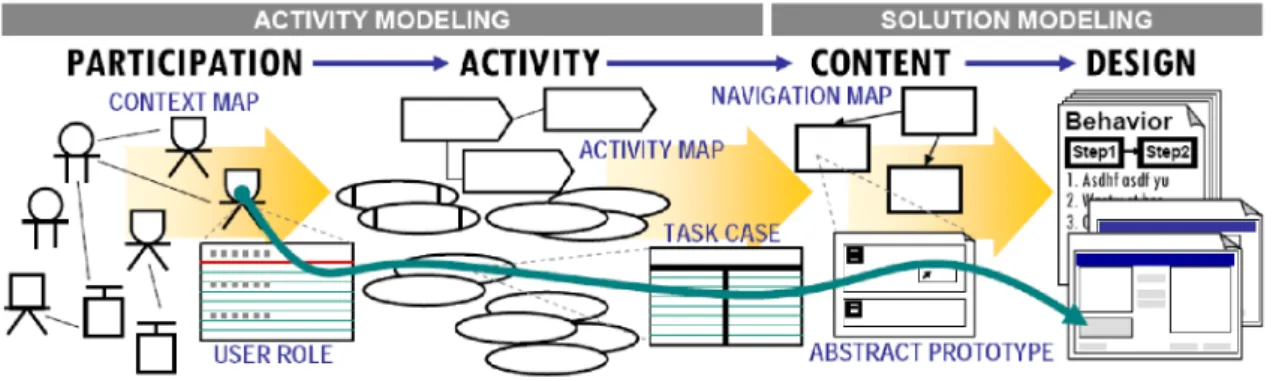
Assisted by the described vocabulary, users of activity modelling are then more able to represent user context, namely regarding interaction with tools and other participants. Activity modelling is based on user tasks and is meant to assist the design of user-centred tools (i.e software, services, etc). The stages of representation of assist design are represented in figure 10.
Figure 10 - Process of User-Centered Design
Context Maps allow representing the interaction of participants with involving players and tools, getting a sense of what influences of assists an actor along the course of his activity. Each actor and player should have a role defined in a participation map that interferes with the execution of the activity being described. An activity map, on the other hand, focuses on breaking down activities into tasks and actions. Although it is not meant to extensively describe all actions in the activity, it provides a way of noting the most relevant tasks and describes how they affect each other (i.e. whether one activity precedes another or whether they occur simultaneously).
Figure 11 - Example of Context Map (Constantine, 2006)
Figure 12 - Example of Activity Map (Constantine, 2006)
In the context of this investigation, activity modelling provides the tools to better understand and represent the context and behaviour of clients, when shopping at the grocery store. When part of the purpose is the context of client’s into an online solution, it becomes essential to have tools that assist representation of the activities. In section 4, we provide examples of the use of this method in mapping activities of clients when shopping for groceries at the store.
2.2.5 The significance of shopping lists
One of the activities of grocery shopping is the use of a shopping list to aid the shopping process. Although people have been using grocery lists for a long time, little attention has been given by the research community to this element of grocery shopping (Basset, Beagan, Chapman, 2008). Grocery lists are an assistant for the scripted behaviour of grocery shopping, while at the same time serving as a memory aid for the household grocery needs (Thomas,
Gardland 1993). Consumers use them in a variety of manners: some use extensive, detailed lists, perceptible to anyone that reads it, while others just list the items that are not commonly in their shopping process, avoiding forgetting about them. Grocery shoppers create lists in many kinds on formats, from blank pieces of paper, post-its, pre-made checklists or even PDA programs used for that sole purpose such as HandyShopper or PocketShop. Moreover, some customers create their lists mentally, while others do not plan their trip at all, relying on the store display to remember their household needs (Basset, Beagan, Chapman, 2008). Building a grocery list is often not an individual process. Items on a list reflect not only the consumer's intent, but those of the remaining people in the household. Hence, building a grocery list is often a collaborative process, either implicitly (by having a mother thinking about what her kids might want) or explicitly (by posting a draft of the list on the refrigerator and having different people adding their needs to the list). A research study conducted in Australia concluded that in most family households, the same person always does the shopping. In all but one participant of this same study, the person who did the shopping was female and most of the participants stated that they always use some form of grocery list.
2.3 Eletronic Service Quality Assessment
2.3.1 Service Quality
Service Quality is commonly defined as being the difference between what how a service should behave and how a service actually behaves. Nowadays, services are in fact complex systems, and the gap between how the system was initially defined the way it finally behaves when it reaches the final customer marks the difference between an adequate service and an inadequate one.
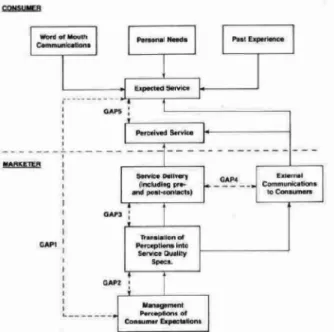
SERVQUAL is a method, initially proposed by Parasuraman, of evaluating the different gaps of service quality, in order to assess the client perception of the service. It describes the Gap Model represented in figure 13, which consists of describing 4 Gaps that separate customer expectations from perceptions.
• Gap 1 refers to the difference between what the customer expects and what the company thinks that the customer expects
• Gap 2 happens when the design standards set by the company do not meet the customer expectations
• Gap 3 occurs when the delivery of service does not perform according to specified and fails to meet standards
• Gap 4 is the gap created when the communication associated with the service does not accurately describe the service delivered
• Gap 5 is the described as being the products of all previously described gaps. This means that the gap will be as significant as the significance of all other gaps. Conversely, if all other gaps are resolved, then the perceived service and the expected service should not have a gap separating them.
2.3.2 Service Attributes
Like many objects of research in science, services are often broken down into characteristics, called service attributes. One of the approaches of evaluating service quality is by identifying and benchmarking the service attributes and the satisfaction they represent to clients.
When using a service, clients have expectations of how the service should work. The Kano Model of Quality, initially conceived for to evaluate product development but later adapted to evaluate service quality, represents a way of looking at service attributes and their performance and classifies them as follows:
• Satisfiers represent those attributes which clients expect from the service and how it should behave. Presence of these characteristics will not make satisfied customer, however, lacking of them will make client unhappy.
• Delighters are the characteristics which go beyond client expectations. These will bring and edge to customer satisfaction, but do not replace those that satisfy the user’s most basic needs.
• Dissatisfiers are those that represent the basic fulfilment of the client need, without which clients will be unsatisfied.
attributes. The findings (represented in figures 15 and 16), assert that ordering time is at the top of the list for online shoppers.
Figure 15 - Weighted preference of online service attributes Source Wilson-Jeanselme M, Reynolds J,
2006
Figure 16 - Weighted preference of attributes for 3 online supermarketsSource
Wilson-Jeanselme M, Reynolds J, 2006
The significance of this result for the purposes of this investigation is clear. The high perceived value of decreased ordering time by online customers, shows that there is a need for more efficient online interfaces.
2.3.3 Eletronic Service Quality: E-S-QUAL
Several authors argue as to what the dimensions to evaluate electronic service quality should be considered (Kim, Lennon, 2006). There has been thus an effort to define a standard framework to evaluate service quality of online solution, based on the more traditional SERVQUAL, initially developed to evaluate service quality of services in general. Service Quality Frameworks are divided into dimensions, which are levels at which the object of evaluations is considered. Each framework provides different dimensions, and often different naming for similar dimensions (See annex 6 for a list of frameworks).
One of these frameworks, was developed by Parasuruam et al. (2005), based on the participation of sufficient respondents with online experience. E-S-QUAL subdivides into two levels of detail:
1. E-S-QUAL Core, which describes the dimensions of:
a. Efficiency – “the ease and speed of accessing and using the site” (Parasuram et al 2005), referring to ease of website access; ease in finding information and navigating to a desired location, and minimal effort on checkout.
b. Fulfilment –“the extent to which the site’s promise about order delivery and item availability are fulfilled” (Parasuram et al. 2005),implied by the availability of items in stock, and the capability of delivering them in the promised timeframe
c. System Availability – “the correct technical functioning of the website” (Parasuram et. Al 2005), which asserts the importance of eliminating broken links and bugs that interfere with the predicted behaviour of the website, and d. Privacy – “the degree to which the site is safe and protects customer
perceived value of a website the notion that private information will not be misused;
2. E-S-QUAL Subscale (E-RecS-QUAL) , describes in three dimensions:
a. Responsiveness – “the effective handling of problems and returns through the website” (Parasuram et al. 2005), stressing the importance of continuity of the order cycle in the online solution,
b. Compensation – “the degree to which the site compensates customers for the problems”, such as returning handling fees and shipping costs with minimal effort, and
c. Contact – “the availability of assistance through phones or online representatives”, referring to the capability of accessing help resources through the website, or that they are duly references in it .
Since convenience and saving of time is one of the main reasons for shopping online
(Ranganathan and Ganapathy, 2002), efficiency is possibly one of the most important factors in grocery online retailing. Kim, Lennon (2006), adapted the framework to include three further dimensions, which were considered relevant to apparel retailers based on prior studies:
a) Personalization – giving customer personal attention, understanding their specific needs,
b) Information – Referring to both company and product related information, checked for completeness and clarity, and
c) Graphic Styles – which refers to product images, layout, print size, which not only provide greater usability, but also are able to influence the customer when shopping online.
The addition of these three dimensions was argued in the context of apparel online shopping, however, the observation and research done so far suggests that these should also be considered in online grocery shopping, namely graphic styles and personalization.
2.4 Principles of Interaction Design
Usability is an area being increasingly valued by businesses facing demanding clients unwilling to spend time learning how to interact with the object. The recent trend of touch screens and simplified interfaces has apparently won the heart and preference of many customers, which consider easy-to-use solutions as the most innovative. Online services are partially a form of self-service, and the importance of the way the client fulfil his duty in the co-creation of the service is directly linked to how well he can use the system.
2.4.1 Usability Principles
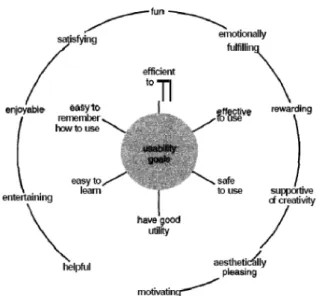
(Preece, Rogers et al , 2002) defined usability as “a measure of the ease with which a system can be learned or used, its safety, effectiveness and efficiency, and the attitude of its users towards it”. Although the most intuitive goals of usability are associated with “ease of use”, (Preece, Rogers et al , 2002) has defined two types of usability attributes: “usability goals” (effectiveness, efficiency, safety, utility, learnability and memorability), another set of attributes define the “user experience” – satisfying, enjoyable, fun, entertaining, helpful, motivating etc. Both are represented in figure 17.
Figure 17 - Usability Goals - Source: Interaction Design (Preece, Rogers et al , 2002) While usability applies to everything capable of being “used”, be it product, service or system, a lot of attention has been put into the usability of online software, with the rise of the Internet as a form of remote business. Jakob Nielsen is considered to be one of the usability gurus of the Web and has done extensive research on the usability of websites. He proposed a set of 10 heuristics, initially proposed to evaluate websites, which are well accepted within the community, and help usability designers to follow the best practices when developing websites:
o The system should always keep users informed about what is going on, through appropriate feedback within reasonable time.
• Match between system and the real world
o The system should speak the users' language, with words, phrases and concepts familiar to the user, rather than system-oriented terms. Follow real-world conventions, making information appear in a natural and logical order. • User control and freedom
o Users often choose system functions by mistake and will need a clearly marked "emergency exit" to leave the unwanted state without having to go through an extended dialogue. Support undo and redo.
• Consistency and standards
o Users should not have to wonder whether different words, situations, or actions mean the same thing. Follow platform conventions.
• Error prevention
o Even better than good error messages is a careful design which prevents a problem from occurring in the first place. Either eliminate error-prone conditions or check for them and present users with a confirmation option before they commit to the action.
• Recognition rather than recall
o Minimize the user's memory load by making objects, actions, and options visible. The user should not have to remember information from one part of the dialogue to another. Instructions for use of the system should be visible or easily retrievable whenever appropriate.
• Flexibility and efficiency of use
o Accelerators - unseen by the novice user - may often speed up the interaction for the expert user such that the system can cater to both inexperienced and experienced users. Allow users to tailor frequent actions.
• Aesthetic and minimalist design
o Dialogues should not contain information which is irrelevant or rarely needed. Every extra unit of information in a dialogue competes with the relevant units of information and diminishes their relative visibility.
• Help users recognize, diagnose, and recover from errors
o Error messages should be expressed in plain language (no codes), precisely indicate the problem, and constructively suggest a solution.
• Help and documentation
o Even though it is better if the system can be used without documentation, it may be necessary to provide help and documentation. Any such information should be easy to search, focused on the user's task, list concrete steps to be carried out, and not be too large.
1. Informative Homepage
2. Pages should follow a clear left to right path 3. Searching capabilities should be visible and usable 4. Searching available across multiple columns 5. Logical ordering results with consistent naming 6. Separate column for each part of the description 7. Each row differentiated
8. Clear method for item and quantity selection 9. Buttons differentiated from text and graphics 10. Simple instructions
The guidelines described in this chapter, although not offering solutions to the problem in question, assist us to pursue our goal without committing many of the most common mistakes already identified by usability experts.
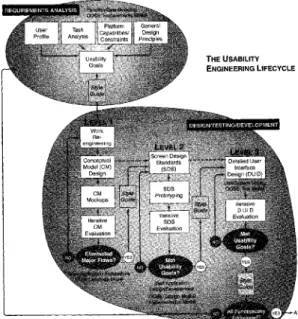
2.4.2 Usability Development Cycle
Developing products or services should start with the analysis of the user needs that the product or service should fulfil. However, there is often a discrepancy between what the designers think the consumer wants and what the consumer actually needs. The concept of user iteration is based on the principle that a project that involves developing something “usable” should be developed progressively in parts. Once each part is complete, it should be shown to potential clients in order to detect early misalignment between the solution and the problem. Evidence and experience in this sector shows that the earlier the problem is identified, the easier they are to correct.
Figure 18 - Usability Engineering Lifecycle Source: Interaction Design Preece 2002
(Preece, Rogers et al , 2002) proposes a cycle of usability engineering that describes a methodology to be followed when undertaking an engineering project. The methodology starts with a phase of requirement analysis, where the project team should understand the
context of the users they are designing for, their tasks, profiles and constraints. Following the usability goals, previously described by the same author, this phase should evolve to the development of a conceptual model which maps the user’s image to the designer’s image of the system. The design/testing/development model should then work its way iteratively to satisfy all usability goals and functionalities, with the help of prototypes and mock-ups from an early stage, avoiding thus flaws in the design phase.
The described cycle provides guidelines to set the cornerstones of the methodology used in this project. As described in section 3, the course of action taken before developing the functional prototype involved users along 4 iterations before the final prototype.
2.4.3 Conceptual Models
According to (Preece, Rogers et al , 2002), conceptual models are “a description of the proposed system in terms of set of integrated ideas and concepts about what it should do, behave and look like, that will be understandable by the users in the manner intended.” With an appropriate conceptual model, users understand the object of interaction as a projection of their actions. They serve as a bridge from what the object’s designer has in mind and what the user perceives.
Two main categories of conceptual models are suggested by (Preece, Rogers et al , 2002): • Conceptual Models based on activities – models designed to influence a user to use
the system in question with a certain activity pattern. Four kinds of activities are further suggested by (Preece, Rogers et al , 2002):
o Instructing o Conversing
o Manipulating and Navigating o Exploring and Browsing
• Conceptual Models based on objects – models designed to use the user’s common knowledge about real-world objects, in order to learn how to interact with the system. For example, if the interface system looks like a book, the user will be inclined to click or touch the right-hand side border of the book to flip to the next page.
2.5 Anticipating customer decisions
Besides the behavioural activities of the customer, it is important to also map the customer’s implicit knowledge and decision patterns into the service solution, in order to have client enjoy a more fulfilling and efficient shopping experience. Product recommendation is at the base of personalized service for the case of online retailers. The following chapter reviews studies about the customer decision-patterns, aiming to better understand how customers decide about their products.
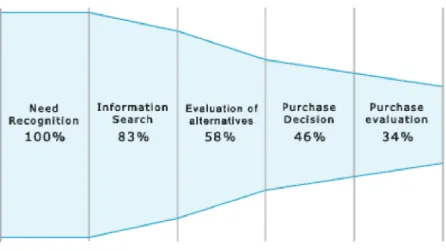
2.5.1 The consumer decision process
Some authors, argue that the decision process of a consumer is described as having five stages, starting with the recognition of the client need for a purchase, searching for information about the product, evaluating the possible alternative, deciding on which product to buy, and finally, evaluating the purchase.
Figure 19 - Five stages of consumer decision process (UIE study – uie.com) A study from a usability consultancy on the online buying process assessed that often consumers cannot follow their natural decision process when using online solutions. The study states that “9% wasn't able to find the products they were looking for because they couldn't identify the right product category or find product options using the search facility”. Moreover, “8% of the shoppers who succeeded in finding products gave up because the product lists didn't provide enough information to identify purchase options, or because they were confused by going back and forth between product lists and product description pages in order to decide if the products would fit their basic needs”. These results show a deficiency in the websites analysed, suggestion the existing need to understand the customer’s decision-making process when designing an online service.
Figure 20 - Completeness of consumer decision stages (guuui.com)
As figure 21 illustrates, the problem deepens as the process reaches its final stages, resulting in lost sales due, when the customer had in fact already identified a need for a purchase. The same UIE study shows that out of 100 purchase-ready customers, only 34 actually accomplished their goals.
2.5.2 Decision Models
(Richarme, 2001) describes 3 Models identified throughout the literature, each improving from the shortcoming of predecessors. He further explains that these models yield 7 decisions-making strategies which drill down the models to a more algorithm-like approach. Being the longest standing decision making model, the Utility model dates 300 years back, and proposes that consumers base their decisions on the expected outcomes of the choice. In this model, consumers are viewed as rational actors, both consistent and constant in their decisions, in order to achieve their desired goals, based on the calculated utility of each option. (Nicholas Bernoulli, John von Neumann, Oskar Morgenstern). However, consumers do not always behave rationally or consistently and often are even not aware of all the factors involved in their decision making. The Utility theory had, therefore, severe shortcoming, when used to predict consumer behaviour.
In the 70's, Kahneman and Tversky complemented the Satisficing theory, which had shortcoming in matters of prediction, introducing the concept of value (instead of utility, as in the Utility theory). It introduces the concept of gain and loss, evaluated from a reference point set by the decider. It consists of two phases, editing and evaluation. In the editing phase, the decider prunes his/her alternatives based on some heuristic. He/she then sets a reference points and evaluates the relative value of the remaining alternatives.
2.5.3 Decision Strategies
Compensatory decision strategies are ones that allows for the weight of one attribute to compensate the lesser value of another attribute, i.e a car may have a low mileage consumption, which can compensate for the shortage of seating space. The two compensatory decision strategies are called equal weight strategy, when attributes have equal weight; or weighted additive strategy, different attributes have different weights and they are all weighted against each other.
With non-compensatory strategies, on the other hand, attributes are weighted without respect to other attributes, and even though the weight of all attributes might be greater in one product, if it fails another attribute, it is not considered. The first of these strategies is called satisficing, and it considers the first product that meets a defined cut off value for all attributes is the one considered. Elimination-by-aspects sets a cut-off value for the most important attribute, allowing all products that meet this cut-off value to proceed to the next attribute in the hierarchy. Lexicographic evaluates the most important attribute and if a product is clearly superior to others in this attributes, it selects that product and halts the decision process, otherwise it continues to the next most important attribute.
The last two decisions strategies are called partially compensatory strategies, when strategies are matched against each other in a serial fashion. Using majority of conforming dimensions, the first two competing products are evaluated across all attributes and the one with higher value is retained. The winner is then compared to its next competitor in a second iteration of the process. Frequency of good and bad features, is a strategy that simultaneously compares all relevant attributes, flagging whether each of them meets a certain cutoff value. Then the product with most qualified attributes is retained.
2.5.4 Marketing Theories for decision-making
A Marketing theory called Consideration may help to restrict the problem space of the decision making process. For instance, when a consumer is asked where he wants to dine this evening, he has a shortlist of restaurants under consideration, suggesting that the decision making only needs to happen within that subset. Multistage decision-making suggests that consumers make decisions in a series of steps of increasing complexity.
Another theory called Involvement suggests that the cognitive effort necessary to make a decision directly depends on the importance placed by the customer in the acquisition of a product, i.e. when it comes to quality of life, or buying presents for others. This importance can come from personal reasons or social/peer influence.
2.6 Categorizing Product Data
Product Categorization refers to the aggregation of products into groups that allows maintaining the retailer’s assortment in a logical manner. This categorization can be done for a number of reasons, the most frequent of which being the separation of business strategies and resource allocation for different product segments.
2.6.1 Product Typologies
One form of aggregation of products is into typologies. Typologies describe different types of products in the way they are consumed. Although there have been several suggestions for product typologies (Campbell Stonehouse Houston, 2002), some of which currently being used, the most enduring has been one separating products into convenience, shopping and speciality good (Coopeland,1923) :
• Convenience Goods are products whose purchase is relatively frequent, at low prices, and where the customer sees little interest or risk in the purchase, such as batteries or low carbonated drinks (Campbell Stonehouse Houston, 2002). As a consequence, these are the kind of products that a supplier will need to make available in the most number of outlets, since the shopper will usually buy it at the most convenient location.
• Shopping Goods, unlike convenience goods, are normally more expensive and the consumer perceives more risk and has more interest in the purchase, and therefore will most likely compare prices between different locations before making a decision. Examples of these are cars, or personal computers. In these products, there is an increased importance of availability of product information, since most often they require some technical knowledge, for an informed decision.
• Speciality Goods, are at the edge of customer preference, often carrying so much prestige, that customer may insist on buying only one brand. Usually these products speak only to a niche market, like professional photography.
Most grocery items fall under the convenience goods category, although suppliers often widen their range to provide both, low-risk decision products, and fine-taste items to the consumer in given categories. In fact, clients have different ways of looking at a category, and one could
Figure 21 - Category Definition Example
Agreeing upon a category definition is a timely process that often is re-iterated over time and speaks directly to the retailer’s business strategy and counts with the active collaborative participation of suppliers and should always revolve around the perceived consumer needs. Some key benefits of an appropriate category definition are:
• better alignment of retailer/supplier with the consumer – by defining the strategies for categories around the consumer needs,
• better aligned relationship between retailer and supplier – by having a common vision for the main subject of their business together,
• new perspectives of category strategies – re-evaluation of category definition often leads to new perspectives on business planning.
2.6.3 Consumer Decision Trees
Consumer Decision Trees (CDTs) are a tool often used by retailers to assist category definition and plan their assortment. In fact, a study Meyers Research Center stated that 84% of major retailers inquired use consumer decision trees with the purpose of building more efficient product assortments. An instantiation of consumer decision tree for a given category consists on weighting the attributes of the category’s products, placing those with greater importance to the consumer decision above those with lesser importance below. Each level of a CDT represents a different attribute, whereas each branch inside a level represents an attribute value for that attribute. Figure 23 shows a sample CDT for the beer category. Creating a CDT also includes defining which levels of the priority systems are “switching” levels and which are “walking” levels (i.e “walking” levels are alternatives which the consumers are unlikely to be willing to switch from the initially desired product, whereas “switching” levels are those which consumers may be willing to switch from the initially desired attribute if unavailable).
Figure 22 - Example of Beer Consumer Decision Tree - Source: ezpog.com
CDTs also serve as tools to assist the creation of planograms, which define the layout of products in the store shelves within a category – i.e. if type of beer (regular or light) is the highest-priority attribute for the beer category, then products are likely to be grouped by type before any other attribute (having light beers grouped together and separate from regular beers).
3 Methodology
The methodology for the research project was carefully constructed and divided into 4 different stages, each of which took inputs from the preceding ones.
Figure 23 - Methodology
The following diagram describes the timeline in which the project was projected, considering the available time for the research:
The subsections of this chapter describe the in more detail each of the project phases, and how they fit the proposed research objectives.
3.1 Phase 1: Preparation
3.1.1 Review of Literature and Studies
The review of previous literature and recent studies is important for any research project with a well defined theoretical ground. While on the one hand market studies and reports confirmed assumptions and supported the decisions taken in an investigation, the review of other work on the several areas that affect this project provided an insight of best practices and conclusions from other authors, some of which were considered very important for the development of the research projects.
The main areas of reviewed literature were: • Usability and Interaction Design • Service Quality and Service Experience • Service Innovation
• E-Commerce Best Practices and Trends • Category Management
• Decision Theory
3.1.2 Unstructured Interviews
As a form of project initiation, it felt important for the researchers to get acquainted with the subject of research in an exploratory manner. Seen as understanding the customer mindset when shopping for grocery was one of the objectives of this dissertation, 6 participants were interviewed in an unstructured manner, mainly to understand how they thought their shopping experience could improve with the help of technology.
3.1.3 Collection of shopping lists
Starting from an assumption supported by previous studies and observation that grocery shopping lists are an important assistant for grocery shopping for many customers, 20 shopping lists were collected. The main intention behind this task was to understand how they were constructed; the level of detail of each list item, and to what level the contents of the shopping list matched the actual shopping.
3.1.4 Review of Previous studies at Wipro
Previous research projects existed at Wipro, and were also taken into account for this research project. The studies consisted on a series on unstructured interviews and researched
what drivers and patterns of behaviour were implicit in consumer decision-making when grocery shopping. It also included some conclusions on online grocery shopping, namely, the reasons for satisfaction/dissatisfaction when using an online solution and proposed improvements based on their past experience.
3.1.5 Current Online Solutions: Benchmarking
During this task, five grocery online solutions were benchmarked for their main features and usability. This task was performed only by the researcher and not by a sample of participants, although in some occasions, participants were asked how they felt about a certain functionality of a website they had never used. The purpose of this step was to evaluate the tools used in grocery e-commerce websites, their strategies and the main faults.
3.2 Phase 2: Analysis of Consumer Behaviour
3.2.1 Online Grocery E-Commerce
This stage consisted of asking five participants who normally used the Internet to shop for grocery to simulate their shopping while being recorded by screen-recoding software and a microphone. The participants were also asked to express their frustrations and comment on their decision as they found suitable. This phase would allow the researchers to assess the main frustrations that affected the customer experience when shopping online for groceries and listen to suggestions made by the customers while experiencing the shopping process.
3.2.2 Grocery shopping at the store
Also important to understand how the customer mindset might be mapped into an electronic solution, was to observe shoppers in their physical shopping environment – the grocery store. During this stage, seven participants were accompanied by a researcher during their grocery shopping process. The supermarket chosen was Continente in Matosinhos, and participants were asked to express their frustrations and comment their decision-making when suitable.
3.3.1 Development of Conceptual Model
The conceptual model explained how the system could be understood with the help of the client’s common sense. In the first stage, it consisted of a verbal description of how the interface could be interpreted, and then evolved to a diagram which showed the users how the solution could be interpreted.
3.3.2 Low-Resolution Prototyping and Iterations
Low-Resolution prototypes aimed to show to users the layout and appearance of the screen. Prototypes were all developed in MS-Office PowerPoint, allowing thus move change the position of elements, according to user suggestions. The prototypes reflected the main changes in the screen, in order to reflect transformations on the appearance.
3.4 Phase 4: Functional prototype and User Evaluation
The final stage of the project was the development of a functional prototype to allow users to test and experiment with and evaluate the proposed solution and its suitability to the objectives. The specific objective of the phase of the prototyping was to evaluate the user’s reaction to the proposed features with the functionality and collect feedback. Although it was not feasible to have a full product range available in a mock solution, some data was inserted in this stage of the prototype. The prototype was developed using javascript web libraries and server-side Java Server Pages querying an Oracle Express database.
The development of the prototype had 3 essential parts: 1. Design of Data Model
2. Recommendation Algorithms and Model 3. Interface Development
The questionnaire to evaluate the solution was based on the ES-QUAL standard for efficiency, in order to attain a sense of how efficient the users felt the customer experience was.
4 Study of client needs and context
4.1 Client activities at grocery store
As a part of the data gathering phase of this project, clients were observed and interviewed while making their usual shopping in supermarkets. This phase of the research included the accompanying of seven participants in their grocery shopping routine. A description of the participants can be found in annex 4.
Only one of the participants did not use a shopping list. When inquired why they used the shopping list, the reasons provided coincided with the findings of previous research on the subject:
• Case 1: To avoid forgetting items that one normally does not buy
• Case 2: To follow a scripted behaviour, hence accelerating the shopping process • Case 3: To make sure the order stays within budget
As for the participant that did not use a shopping list, she explained that she goes shopping very often (2/3 times a week) and buys only for a few days, hence very few products, being thus able to remember everything and having no need to write it down.
All participants used a shopping cart, and all cross-compared their shopping lists with the contents of the cart to check completeness. The order in which the participants picked up their products did not match the order in which the shopping list was written. Instead, participants chose an aisle or a section (i.e. Frozen Food) and picked up all items they needed from that section. At this point it was noticeable that many impulse purchases happen due to adjacency to a desired product, for example, stain-remover next to laundry detergent, which is a more common purchase. Very seldom did a participant return to an aisle previously visited, since before leaving an aisle or section, participants scanned the list to account for missing items from that area.
Another relevant observation was that when participants went to pick up a product they did not commonly buy, they were often overwhelmed with the product range available to their choice, hence unsure of which one to buy. At this stage it was possible to observe the participants narrowing down the product range according to their needs. In most cases, the