1
I
12 3
Influence of Environmental and Political Determinants on Food Choices in a
4Sample of Portuguese Population
56 7
Ana Cristina Ferrão1*, Raquel P. F. Guiné1, Paula Correia1, Manuela Ferreira2 8
9
1CI&DETS/CERNAS Research Centres, Polytechnic Institute of Viseu, Campus Politécnico, Repeses, Viseu, 10
Portugal. 11
2CI&DETS/UICISA:E Research Centres, Polytechnic Institute of Viseu, Campus Politécnico, Repeses, Viseu, 12 Portugal. 13 14 15 *Corresponding author: 16
Ana Cristina Ferrão 17
Escola Superior Agrária de Viseu, Quinta da Alagoa, Estrada de Nelas, Ranhados, 3500-606 Viseu, Portugal. 18 Tel: + 351 232 446 640; Fax: +351 232 426 536 19 E-mail: [email protected] 20 21 22 23
Published article / Citation:
Ferrão AC, Guiné RPF, Correia P, Ferreira M (2020) Influence of Environmental and Political Determinants on Food Choices in a Sample of Portuguese Population. Current Nutrition and Food Science, 16(5), 689– 697.
Author
version
2
ABSTRACT 24
Background: There is an increasing concern regarding the impacts of food choices on the 25
environment. Therefore, in order to plan actions to promote more sustainable diets it is crucial to 26
understand the influence of environmental and political determinants on people’s food choices. 27
Objective: This work aimed at studying the extent to which environmental and political determinants 28
influence people’s food choices in a sample of the Portuguese population. 29
Methods: It was undertaken a descriptive cross-sectional study on a non-probabilistic sample of 1314 30
participants living in the Centre of Portugal. The questionnaires were applied after informed consent 31
only to adults (aged 18 or over) and the data were collected from January and December 2017 among 32
the Portuguese population. 33
Results: The participants’ food choices were, in general, influenced by environmental and political 34
determinants (0.77 ± 0.53, in a scale from -2 to +2). It was also observed that the elderly, men and the 35
participants who had a university degree were more influenced by these determinants. These findings 36
were similar for those who lived in urban areas, the retired, the participants who had a professional 37
activity or studies in agriculture areas and those who were responsible for buying their own food. 38
Furthermore, there were found significant differences between age groups, genders and the levels of 39
education. There were also observed significant differences between the different living environments, 40
professional status, regarding the areas of work or studies and also between the participants who were 41
responsible for buying their one food and the ones who were not. These findings are very important, 42
because highlight the complicity of people’s food choices and are determinant for the development of 43
strategies that can improve people’s eating habits. 44
Conclusion: This paper fulfils an identified need to study the environmental and political determinants 45
underlying the Portuguese food choices. 46
47
Keywords: Diet, eating, environmental and political determinants, food choices, survey, sustainable 48
diets. 49
50 51
3
1. INTRODUCTION 52
The determinants underlying food choices have been a theme of interest in many scientific reports. 53
Among the main determinants that influence dietary choices are environmental, socioeconomic, 54
cultural, political, cognitive and affective factors, as well as hunger and sensory perceptions [1,2]. 55
Moreover, according to Crockett and Wallendorf [3], people increasingly express their political ideals, 56
which is reflected in their acts of consumption. Food choices have an impact on the environment in 57
several ways, such as climate change, land, water and energy use, as well as in biodiversity [4]. 58
Moreover, all these factors may have major, and negative, consequences for human wellbeing [5]. In 59
a world facing numerous environmental and political challenges, consumers are becoming more 60
concerned about animal welfare, economic efficiency, child labour, local communities and the 61
environmental sustainability of their diets [6–8]. In a French study by Mathé [9] it was found that the 62
number of consumers concerned by environmental degradation, worker's rights and animal welfare 63
increased from 7% to 20% between 1995 and 2007. 64
Nowadays, the food system all over the world is unsustainable, being extremely fragile to any 65
climatic, socioeconomic, political or financial crisis [10]. Food production is responsible for 66
approximately 30% of global greenhouse gas (GHG) emissions, as well as for 70-80% of all human 67
withdrawals and it is a significant cause of water pollution [11–13].On the other hand, there is an 68
inequality in food supply, characterized by food excesses in developed countries and insufficient food 69
intake in undeveloped countries [11,13,14]. Food waste is another concern of today’s society, because 70
every year about one third of the world food production is wasted, which corresponds to 1.3 billion 71
tons per year [15]. In Europe, approximately 88 million tons of food are wasted annually. Food waste 72
occurs along the entire food chain, and it is estimated that a large proportion is from family origin (47 73
million tons per year) [16]. Therefore, it is crucial the adoption of more sustainable diets. According 74
to the Food and Agriculture Organization (FAO), sustainable diets correspond to diets with low 75
environmental impacts that contribute to food and nutritional security, as well as to a healthy life for 76
both present and future generations. These diets are protective and respectful of biodiversity and 77
ecosystems, culturally acceptable, accessible, economically fair, nutritionally adequate, safe and 78
healthy, while optimizing natural and human resources [10]. In this context, it is of the utmost urgency 79
the development of effective policies that can increase people’s awareness about the environmental 80
impacts of their diets. For that purpose, it is essential to do more research about people’s behaviour 81
towards political and environmental friendly food choices. 82
This study is included in the multinational project entitled “Psycho-social motivations associated 83
with food choices and eating practices (EATMOT)” which aims to perform a research about some 84
4
psychic and social motivations that determine people’s dietary practices in relation to their food 85
choices or eating habits. 86
The main goal of this study was to evaluate in what extent the participants’ food choices were 87
influenced by environmental and political determinants. Since social and demographic characteristics 88
are important factors for dietary patterns, it was also analysed how some sociodemographic factors 89
and participants’ food regimen influenced the environmental and political determinants underlying 90
food choices. 91
92
2. MATERIALS AND METHODS 93
2.1. Instrument 94
The questionnaire that was used for this study was based on a review of other existing instruments 95
[17–23] and included some questions destined to the characterization of the sample, as well as a set of 96
questions intended to access in what way participants’ food choices were influenced by environmental 97
and political determinants. Hence, the participants were asked to indicate their extent of agreement 98
towards the statements showed in Table 1, measured on a 5-point Likert scale varying from 1 to 5: 1 99
(totally disagree), 2 (disagree), 3 (neither agree nor disagree), 4 (agree) and 5 (strongly agree) [24]. 100
101
Table 1. Statements used to access environmental and political determinants.
102
Environmental and political determinants
1. It is important to me that the food I eat is prepared/packed in an environmental friendly way. 2. When I cook I have in mind the quantities to avoid food waste.
3. It is important to me that the food I eat comes from my own country.
4. I prefer to eat food that has been produced in a way that animals' rights have been respected. 5. I choose foods that have been produced in countries where human rights are not violated. 6. I avoid going to restaurants that do not have a recovery policy of food surplus.
7. I prefer to buy foods that comply with policies of minimal usage of packaging. 103
5
2.2. Data collection 105
The data collection occurred between January and December 2017 among a sample of 1314 106
participants living in a Centre region of Portugal. Only adults (aged 18 or over) were included in the 107
study, and their participation was voluntary and after informed consent. It was guaranteed the 108
confidentiality of the answers and all ethical issues were followed when designing and applying the 109
questionnaire, which was approved by the Ethical Committee with reference nº 04/2017. 110
111
2.3. Statistical Analysis 112
In order to evaluate in what way the participants’ food choices were influenced by environmental 113
and political determinants, first of all it was necessary to calculate an average of the scores obtained 114
for all the items included in Table 1. For this purpose, it was necessary to reformulate the scale to allow 115
the calculation of an average score without the influence of the score attributed to the mean point of 116
the Likert scale (3 = neither agree nor disagree). Therefore, the items were recoded into a new scale 117
ranging from -2 and +2, by subtracting the value 3 from all previous scores, so that 1 became -2, 5 118
became +2, 3 became zero and so on. In this way, when computing the sum, the effect of those who 119
had no opinion was not considered. The new scale was defined with the following interpretation, 120
having in mind a uniform and plausible interval range: [-2.0 ; -1.5[ - food choices not at all influenced 121
by environmental and political determinants; [-1.5 ; -0.5[ - food choices not influenced by 122
environmental and political determinants; [-0.5 ; 0.5[ - food choices slightly influenced by 123
environmental and political determinants; [0.5 ; 1.5[ - food choices influenced by environmental and 124
political determinants; [1.5 ; 2.0] - food choices strongly influenced by environmental and political 125
determinants. Then, it was calculated an average of the scores obtained for all the items included in 126
this section of the questionnaire. 127
For the treatment of the data, basic descriptive statistic tools were used, complemented with 128
parametric tests, namely the Student´s t-test for the comparison of means between two groups and one-129
way ANOVA for the comparison of means between three or more groups. In ANOVA’s case, in order 130
to assess the differences between groups it was used the post-hoc Tukey HSD test, also known as the 131
Tukey's HSD (Honestly Significant Difference) test. This statistical test is used to identify which 132
means are significantly different from each other, and consists in a single-step multiple comparison 133
procedure, coupled to ANOVA. In this test the difference between means is evaluated to see whether 134
or not it is greater than the standard error [25–27].All data analysis was made using the SPSS program, 135
version 25 from IBM, Inc. and in all tests the level of significance considered was 5%. 136
6
2.4. Sample Characterization 138
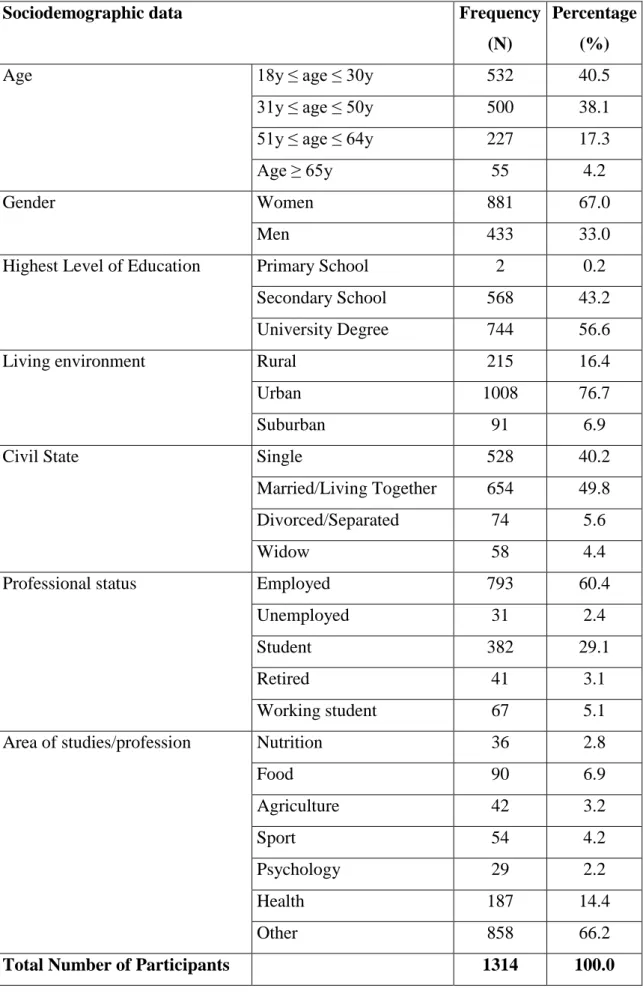
The sociodemographical characteristics of the respondents in the sample are outlined in Table 2. 139
This study included 1314 participants living in Portugal, from which 67.0% were women and 33.0% 140
were men. The age varied between 18 and 84 years, being on average 37.4 ± 14.7 years for the whole 141
sample. The average age of the female participants was lower than that of the male participants (35.8 142
± 14.1 and 40.5 ± 15.4 years, respectively). The variable age was classified into categories according 143
to: young adults, from 18 to 30 years, accounting for 40.5%; average adults, from 31 to 50 years, 144
representing 38.1%; senior adults, from 51 to 64 years, corresponding to 17.3%; elderly, 65 or more 145
years, representing 4.2%. 146
The majority of the participants had a high level of education (56.6% with a university degree), 147
while 43.2% had completed secondary school and just a minor portion (0.2%) had the lowest level of 148
education (primary school) as their terminal education. 149
Regarding the living environment, 76.7% lived in urban areas, 6.9% in suburban surroundings and 150
16.4% in rural areas. 151
As for the civil state, 49.8% of the participants were married or lived as a marital couple, 40.2% 152
were single, 5.6% were divorced or separated and 4.4% were widowed. 153
Table 2 also shows that most of the participants (60.4%) were employed, 29.1% were students 154
and only a few of them corresponded to the other professional status. It was further observed that the 155
majority of the participants (66.2%) did not have a professional activity or studies related to any of the 156
areas suggested in the questionnaire (nutrition, food, agriculture, sport, psychology, or other health 157
areas). Most of the participants indicated that they were responsible for buying their own food (93.0%), 158
against only 7.0% that answered that they were not. 159
7
Table 2. Sociodemographical characterization of the sample at study.
161
Sociodemographic data Frequency
(N)
Percentage (%)
Age 18y ≤ age ≤ 30y 532 40.5
31y ≤ age ≤ 50y 500 38.1
51y ≤ age ≤ 64y 227 17.3
Age ≥ 65y 55 4.2
Gender Women 881 67.0
Men 433 33.0
Highest Level of Education Primary School 2 0.2
Secondary School 568 43.2
University Degree 744 56.6
Living environment Rural 215 16.4
Urban 1008 76.7
Suburban 91 6.9
Civil State Single 528 40.2
Married/Living Together 654 49.8
Divorced/Separated 74 5.6
Widow 58 4.4
Professional status Employed 793 60.4
Unemployed 31 2.4
Student 382 29.1
Retired 41 3.1
Working student 67 5.1
Area of studies/profession Nutrition 36 2.8
Food 90 6.9 Agriculture 42 3.2 Sport 54 4.2 Psychology 29 2.2 Health 187 14.4 Other 858 66.2
8
Table 3 presents the participants’ specific food regimen and the results showed that the majority 162
of them (86.0%) did not follow any specific food regimen, being this percentage higher for men 163
(93.3%) when compared to women (82.4%). On the other hand, a higher percentage of the female 164
participants, 9.2%, followed a food regimen based on a caloric restriction, when compared to the male 165
participants, 3.2%. 166
167
Table 3. Participants’ specific food regimen, according to gender.
168
Specific Food Regimen Global Women Men
% % % Raw foodism 0.0 0.0 0.0 Fruitarianism 0.2 0.2 0.2 Vegetarianism 3.4 4.3 1.4 Veganism 0.5 0.7 0.0 Flexitarianism 1.1 1.5 0.5 Caloric restriction 7.2 9.2 3.2 Religious restriction 0.5 0.5 0.5 Other 1.1 1.3 0.9 None 86.0 82.4 93.3 169
3. RESULTS AND DISCUSSION 170
3.1. Environmental and political determinants for food choices 171
Table 4 presents the results for the participants’ opinions about some environmental and political 172
issues and as it can be observed 58.5% of the respondents indicated that for them it is important that 173
the food they eat is prepared/packed in an environmental friendly way. Besides, more than a half of 174
the participants, 55.2%, agreed that they prefer to buy food that complies with policies of minimal 175
usage of packaging. Regarding the importance of avoiding food waste, 52.3% of the respondents 176
answered that they try to have in mind food quantities when they cook. However, when they were 177
asked if they avoided restaurants that do not have a recovery of food surplus policy, a significant 178
percentage of the participants neither agreed nor disagreed with that statement (44.8%). As for the 179
importance of eating foods from their own country, 46.0% of the respondents agreed with that fact. 180
Furthermore, it was also observed that participants’ opinions were more divided regarding the ethical 181
concerns about animals’ and humans’ rights. In fact, previous research suggested that there is a 182
relatively high awareness among the population that food production has an impact on climate change, 183
9
but less than 20% of the people know how to change their diet into one that is more sustainable [28]. 184
In a more recent study by Hoek et al. [12], it was found that, in general, there is a low level of awareness 185
and understanding about the impact of foods on the environment. 186
10
Table 4. Participants’ opinions about some environmental and political issues.
188
Statements about environmental and political issues
Scale1 1 (%) 2 (%) 3 (%) 4 (%) 5 (%) 1. It is important to me that the food
I eat is prepared/packed in an environmental friendly way
0.8 3.7 14.9 58.5 22.2
2. When I cook I have in mind the
quantities to avoid food waste 0.5 1.5 5.7 52.3 39.9 3. It is important to me that the food
I eat comes from my own country 1.5 6.8 19.8 46.0 25.9 4. I prefer to eat food that has been
produced in a way that animals' rights have been respected
2.4 2.6 19.0 38.2 37.8
5. I choose foods that have been produced in countries where human rights are not violated
5.1 17.5 53.8 15.8 7.7
6. I avoid going to restaurants that do not have a recovery policy of food surplus
2.5 10.3 44.8 33.2 9.2
7. I prefer to buy foods that comply with policies of minimal usage of packaging
1.3 4.1 24.1 55.2 15.2
1Scale: 1 (totally disagree), 2 (disagree), 3 (neither agree nor disagree), 4 (agree) and 5 189
(strongly agree) 190
191
3.1.1. Individual and professional characteristics 192
For the sample at study, the mean score obtained for the influence of environmental and political 193
determinants on participants’ food choices was equal to 0.77 ± 0.53, meaning that, in general, 194
participants’ food choices were influenced by those determinants. 195
Table 5 presents the results for the relations between sociodemographical characteristics and the 196
influence of environmental and political determinants, and as it can be observed for elderly the mean 197
score was 1.07 ± 0.40, for senior adults was 0.91 ± 0.47, for average adults the value was equal to 198
0.90 ± 0.48 and with a lowest score came the group of young adults (0.56 ± 0.54), meaning that, in 199
general, the food choices of the participants were influenced by environmental and political 200
determinants. The results of the ANOVA test showed that there was a significant difference among 201
11
age groups. This tendency was in agreement with the results of the study performed by Sautron et al. 202
[29], where it was found that environmental and political concerns tend to increase with age. 203
Regarding gender, it was found that both men and women were influenced by environmental and 204
political issues when making their food choices, with a higher mean score for men (0.81 ± 0.50) when 205
compared to women (0.76 ± 0.55). In this case, there were also found significant differences between 206
genders. These findings are not in accordance to the ones obtained in previous studies, where it was 207
observed that women tended to be more thoughtful about food and health issues and they seem to have 208
more moral and ecological doubts about eating certain foods than men [30–33]. However, the findings 209
of the mentioned studies were not so recent as our work, and because in the latest years a higher 210
awareness for ecological issues has arisen, maybe the differences between genders concerning diet 211
ecological aspects were faded. 212
According to scientific evidences, it is often observed that individuals with higher education levels 213
tend to be more environmentally friendly [34]. The results of this study corroborate those findings, 214
being the participants who had a university degree the ones that obtained a higher mean score for the 215
influence of environmental and political determinants (0.87 ± 0.50). However, for all levels of 216
education the results showed that participants’ food choices were influenced by environmental and 217
political determinants (mean values between 0.5 and 1.5). According to the results of the ANOVA test, 218
it was observed that the differences between the levels of education were significant. More specifically, 219
the mean values of the participants who had a university degree and primary school as their terminal 220
education were statistically different from the mean values of the participants who had secondary 221
school as their terminal education. In previous research it was also found that the level of education 222
influences behaviour directly and indirectly by raising environmental concerns [35]. In fact, education 223
provides relevant prior information that consumers can use in their shopping decisions, and facilitates 224
the search as well as the acquisition of information about the environmental impact of their food 225
choices and decisions [36]. 226
Concerning the living environment, with a higher mean score came the participants who lived in 227
urban areas (0.86 ± 0.48), followed by the participants who lived in suburban areas (0.51 ± 0.62) and 228
finally the ones who lived in rural areas (0.48 ± 0.55), meaning that the food choices of the participants 229
who lived in urban and suburban areas were influenced by environmental and political determinants, 230
but the food choices of the participants who lived in rural areas were only slightly influenced by those 231
determinants. Furthermore, were also found significant differences among the participants who lived 232
in different areas. 233
12
The results of the ANOVA test also showed significant differences among the different 234
professional status, being the participants that were retired the ones that obtained a higher mean score 235
(0.99 ± 0.36) and the participants that were students the ones obtaining the lowest value (0.51 ± 0.55). 236
However, since the mean values were between 0.5 and 1.5, independently of the professional status, 237
participants’ food choices were influenced by environmental and political determinants. Furthermore, 238
it was also analysed the relation between the professional activity or areas of study and the 239
environmental and political determinants underlying participants’ food choices. As it was expected, 240
were found significant differences among the different work or studies areas. The highest mean value 241
achieved was for the participants that had a professional activity or studies related to agriculture (0.85 242
± 0.57), and the lowest mean score was for those who had a professional activity or studies related to 243
nutrition (0.45 ± 0.62). With the exception of the participants who had a professional activity or studies 244
in a nutrition-related area, for all the other cases, participants’ food choices were influenced by political 245
and environmental determinants. For those who had a professional activity or studies related to 246
nutrition, the data revealed that their food choices were only slightly influenced by environmental and 247
political determinants. Previous studies suggested that women, the young, those more educated, with 248
higher income, liberal or left leaning, urban residents and those well informed about environmental 249
issues, tend to be more environmentalists [37–40]. On the contrary, in other studies it was found that 250
sociodemographic factors had a weak or even contradictory influence, not only on pro-environmental 251
behaviour, but also on the characteristics of sustainable consumers [41–44]. 252
The results of the Student’s t-test showed that there were significant differences between the 253
participants who were responsible for buying their own food and those who were not, being the 254
participants who were responsible the ones that obtained a highest mean score (0.81 ± 0.51), meaning 255
that the food choices of these participants were influenced by environmental and political 256
determinants. For the participants that were not responsible for buying their own food, the results 257
revealed that their food choices were only slightly influenced by environmental and political 258
determinants (0.31 ± 0.55). 259
13
Table 5. Relations between some sociodemographical factors and the environmental and political
261
determinants (scale from -2 = food choices not at all influenced by environmental and political determinants 262
to +2 = food choices strongly influenced by environmental and political determinants). 263
Variable Mean ± SD p-value
Age group 18y ≤ age 30y 0.56 ± 0.54a 0.0011 31y ≤ age 50y 0.90 ± 0.48b
51y ≤ age 64y 0.91 ± 0.47b Age 65y 1.07 ± 0.40c
Gender Women 0.76 ± 0.55 0.0472
Men 0.81 ± 0.50 Level of
Education
Primary School 0.86 ± 0.20a 0.0001 Secondary School 0.64 ± 0.54b University 0.87 ± 0.50a Living Environment Rural 0.48 ± 0.55a 0.0001 Urban 0.86 ± 0.48b Suburban 0.51 ± 0.62a Professional status Employed 0.89 ± 0.48bc 0.0001 Unemployed 0.65 ± 0.49a Student 0.51 ± 0.55a Retired 0.99 ± 0.36c Working student 0.75 ± 0.58ab Work or studies related areas Nutrition 0.45 ± 0.62a 0.0001 Food 0.70 ± 0.48ab Agriculture 0.85 ± 0.57b Sport 0.52 ± 0.53a Psychology 0.50 ± 0.71a Health 0.63 ± 0.56ab Others 0.86 ± 0.50b Is responsible for
buying the food
Yes 0.81 ± 0.51 0.0002 No 0.31 ± 0.55
1ANOVA for comparison of 3 or more groups (Level of significance 5%).Mean 264
values with the same letter are not statistically different (p<0.05). 265
14
2Student’s t-test for independent samples for comparison of 2 groups (Level of 266 significance 5%). 267 268 269 3.1.2. Eating practices 270
The adoption of a particular dietary regimen involves a particular way of being or experiencing 271
the world and there are many variants in dietary restriction and in motivations for adopting such diets 272
[45]. Table 6 presents the relations between participants’ specific food regimen and the environmental 273
and political determinants, and as it can be observed the highest mean score achieved was for the 274
participants who were flexitarians (0.94 ± 0.50), followed by the participants that were vegetarians 275
(0.82 ± 0.61) and the lowest mean score was for those who followed a frutarianism regimen (0.33 ± 276
0.84). Surprisingly, the mean score obtained for vegan’s participants was equal to 0.58 ± 0.34, lower 277
than the mean value of the participants that did not follow any specific food regimen (0.78 ± 0.53). 278
However, no significant differences were found among the different food regimens. Nevertheless, with 279
the exception of the participants that followed frutarianism and other specific food regimens, in the 280
other cases, participants’ food choices were influenced by environmental and political determinants 281
(mean values between 0.5 and 1.5). In the specific case of the fruitarians and the participants that 282
adopted other special dietary regimens, the results showed that their food choices were only slightly 283
influenced by environmental and political determinants (mean values between -0.5 and 0.5). According 284
to previous studies, vegetarianism is beneficial to health, the environment, farm animals and world 285
hunger [46–48]. In fact, the major motivations for people becoming vegetarians are concerns for health 286
and for animal welfare [45]. When compared to omnivorous, vegans and vegetarians usually have 287
higher engagement of empathy related brain areas while observing negative scenes of both humans 288
and animals [49], which often translates into greater concerns about harm and fairness, loyalty, 289
authority, respect, purity and sanctity [50]. In another study, it was found that flexitarians tended to be 290
more concerned about animal welfare than omnivorous, but less concerned than vegetarians [51]. 291
15
Table 6. Relations between participants’ specific food regimen and the environmental and political 293
determinants (scale from -2 = food choices not at all influenced by environmental and political determinants 294
to +2 = food choices strongly influenced by environmental and political determinants). 295
Variable Mean ± SD p-value
Specific food regimen Raw foodism ---2 0.1041 Frutarianism 0.33 ± 0.84 Vegetarianism 0.82 ± 0.61 Veganism 0.58 ± 0.34 Flexitarianism 0.94 ± 0.50 Caloric restriction 0.72 ± 0.45 Religion restrictions 0.50 ± 0.34 Other 0.49 ± 0.52 No special regimen 0.78 ± 0.53
1ANOVA for comparison of 3 or more groups (Level of significance 5%). 296
2There were no occurrences. 297
298 299
4. CONCLUSION 300
From this study it can be concluded that, in general, the participants’ food choices were influenced 301
by environmental and political determinants. The exceptions were the participants who lived in rural 302
areas, those who had a professional activity or studies related to nutrition, the fruitarians and also the 303
participants who followed other specific food regimens that were not mentioned in the questionnaire. 304
For these participants, their food choices were only slightly influenced by environmental and political 305
determinants. 306
Overall, the results of this study confirmed that sociodemographical characteristics influence the 307
participants concerns with environmental and political determinants, which is reflected in their food 308
choices. There were found significant differences in the extent to which environmental and political 309
determinants influence participants’ food choices regarding age group, gender, civil state, level of 310
education, living environment, professional status, area of studies or work and the fact that the 311
participants were responsible for buying their own food or not. On the other hand, there were no 312
significant differences among the participants that had different food regimens. According to the 313
individual’s and professional characteristics, the highest mean scores achieved were for the seniors, 314
retired, men, who had a university degree, who lived in an urban area, those that were responsible for 315
buying their own food and also for the participants that had a professional activity or studies related to 316
16
agriculture. Concerning the specific food regimen, flexitarians showed to be more influenced by 317
environmental and political determinants than the participants who followed other specific food 318
regimes. Nevertheless, there were no mean scores equal or higher than 1.5, which means that in none 319
of the cases the participants’ food choices were strongly influenced by environmental and political 320
determinants. 321
The findings of this study are very important, because they allow to characterize in what extent 322
Portuguese people’s food choices are influenced by environmental and political determinants. This 323
knowledge is crucial to promote and implement policies, as well as approaches, that may contribute to 324
more sustainable food choices. 325
The main limitation of this study is related to the fact that some of the statements included in the 326
questionnaire measured concerns and not attitudes, and therefore did not allow, at this stage, to verify 327
if the participants’ concerns about environmental and political issues actually translate into 328
environmentally friendly food behaviours. 329
330
5. DECLARATION OF INTEREST 331
The authors have no conflict of interest to declare. 332
333
6. ACKNOWLEDGMENT 334
This work was prepared in the ambit of the multinational project EATMOT from CI&DETS 335
Research Centre (IPV - Viseu, Portugal) with reference PROJ/CI&DETS/CGD/0012. 336
337
7. REFERENCES 338
[1] Monteleone E, Spinelli S, Dinnella C, Endrizzi I, Laureati M, Pagliarini E, et al. Exploring influences on 339
food choice in a large population sample: The Italian Taste project. Food Qual Prefer 2017;59:123–40. 340
doi:10.1016/j.foodqual.2017.02.013. 341
[2] Sleddens EFC, Kroeze W, Kohl LFM, Bolten LM, Velema E, Kaspers PJ, et al. Determinants of dietary 342
behavior among youth: an umbrella review. Int J Behav Nutr Phys Act 2015;12:7. doi:10.1186/s12966-343
015-0164-x. 344
[3] Crockett D, Wallendorf M. The Role of Normative Political Ideology in Consumer Behavior. J Consum 345
Res 2004;31:511–28. doi:10.1086/425086. 346
[4] Macdiarmid JI. Is a healthy diet an environmentally sustainable diet? Proc Nutr Soc 2013;72:13–20. 347
doi:10.1017/S0029665112002893. 348
[5] WHO. Ecosystems and Human Well-being : Health Synthesis. A Report of the Millenium Ecosystem 349
Assessment. Geneva: World Health Organization; 2005. 350
17
[6] Birch D, Memery J, De Silva Kanakaratne M. The mindful consumer: Balancing egoistic and altruistic 351
motivations to purchase local food. J Retail Consum Serv 2018;40:221–8. 352
doi:10.1016/j.jretconser.2017.10.013. 353
[7] Kjærnes U. Ethics and Action: A Relational Perspective on Consumer Choice in the European Politics of 354
Food. J Agric Environ Ethics 2012;25:145–62. doi:10.1007/s10806-011-9315-5. 355
[8] Watkins L, Aitken R, Mather D. Conscientious consumers: a relationship between moral foundations, 356
political orientation and sustainable consumption. J Clean Prod 2016;134:137–46. 357
doi:10.1016/j.jclepro.2015.06.009. 358
[9] Mathé T. How do consumers define sustainable foods. CRÉDOC Cah Rech 2009. 359
[10] FAO. Sustainable Diets and Biodiversity-Directions and solutions for policy, research and action. Rome: 360
Food and Agriculture Organization of the United Nations; 2012. 361
[11] Garnett T. Food sustainability: problems, perspectives and solutions. Proc Nutr Soc 2013;72:29–39. 362
doi:10.1017/S0029665112002947. 363
[12] Hoek AC, Pearson D, James SW, Lawrence MA, Friel S. Shrinking the food-print: A qualitative study 364
into consumer perceptions, experiences and attitudes towards healthy and environmentally friendly food 365
behaviours. Appetite 2017;108:117–31. doi:10.1016/j.appet.2016.09.030. 366
[13] Tilman D, Clark M. Global diets link environmental sustainability and human health. Nature 367
2014;515:518–22. doi:10.1038/nature13959. 368
[14] Waterlander WE, Ni Mhurchu C, Eyles H, Vandevijvere S, Cleghorn C, Scarborough P, et al. Food 369
Futures: Developing effective food systems interventions to improve public health nutrition. Agric Syst 370
2018;160:124–31. doi:10.1016/j.agsy.2017.01.006. 371
[15] Food and Agriculture Organization. Global food losses and food waste - extent, causes and prevention. 372
Rome: 2011. 373
[16] European Food Information Council. Let´s reduce food waste. Food Saf 2017. 374
[17] Aikman SN, Crites SL, Fabrigar LR. Beyond Affect and Cognition: Identification of the Informational 375
Bases of Food Attitudes1. J Appl Soc Psychol 2006;36:340–82. doi:10.1111/j.0021-9029.2006.00011.x. 376
[18] Jackson B, Lynne Cooper M, Mintz L, Albino A. Motivations to eat: Scale development and validation. J 377
Res Personal 2003;37:297–318. doi:10.1016/S0092-6566(02)00574-3. 378
[19] Lindeman M, Väänänen M. Measurement of ethical food choice motives. Appetite 2000;34:55–9. 379
doi:10.1006/appe.1999.0293. 380
[20] Renner B, Sproesser G, Strohbach S, Schupp HT. Why we eat what we eat. The Eating Motivation Survey 381
(TEMS). Appetite 2012;59:117–28. doi:10.1016/j.appet.2012.04.004. 382
[21] Roininen K, Lähteenmäki L, Tuorila H. Quantification of Consumer Attitudes to Health and Hedonic 383
Characteristics of Foods. Appetite 1999;33:71–88. doi:10.1006/appe.1999.0232. 384
[22] Steptoe A, Pollard TM, Wardle J. Development of a measure of the motives underlying the selection of 385
food: the food choice questionnaire. Appetite 1995;25:267–84. doi:10.1006/appe.1995.0061. 386
18
[23] van Strien T, Frijters JER, Bergers GPA, Defares PB. The Dutch Eating Behavior Questionnaire (DEBQ) 387
for assessment of restrained, emotional, and external eating behavior. Int J Eat Disord 1986;5:295–315. 388
doi:10.1002/1098-108X(198602)5:2<295::AID-EAT2260050209>3.0.CO;2-T. 389
[24] Likert R. A technique for the measurement of attitudes. Arch Psychol 1932;22 140:55. 390
[25] Santos SCRVL, Guiné RPF, Barros A. Effect of drying temperatures on the phenolic composition and 391
antioxidant activity of pears of Rocha variety (<Emphasis Type="Italic">Pyrus communis</Emphasis> 392
L.). J Food Meas Charact 2014;8:105–12. doi:10.1007/s11694-014-9170-y. 393
[26] Rodrigues T, Lima MJ, Guiné R, Lemos E. Evaluation of Eating Habits among Portuguese University 394
Students: A Preliminary Study. World Acad Sci Eng Technol 2013;79:481–5. 395
[27] Guiné RPF, Henriques F, Barroca MJ. Influence of drying treatments on the physical and chemical 396
properties of cucumber. J Food Meas Charact 2014;8:195–206. doi:10.1007/s11694-014-9180-9. 397
[28] Department for Environment, Food and Rural Affairs. Attitudes and Behaviours around Sustainable Food 398
Purchasing. London: 2011. 399
[29] Sautron V, Péneau S, Camilleri GM, Muller L, Ruffieux B, Hercberg S, et al. Validity of a questionnaire 400
measuring motives for choosing foods including sustainable concerns. Appetite 2015;87:90–7. 401
doi:10.1016/j.appet.2014.12.205. 402
[30] Arganini C, Saba A, Comitato R, Virgili F, Turrini A. Gender Differences in Food Choice and Dietary 403
Intake in Modern Western Societies. In: Prof. Jay Maddock, editor. Public Health - Soc. Behav. Health, 404
Croatia: InTech; 2012, p. 570. 405
[31] Beardsworth A, Bryman A, Keil T, Goode J, Haslam C, Lancashire E. Women, men and food: the 406
significance of gender for nutritional attitudes and choices. Br Food J 2002;104:470–91. 407
doi:10.1108/00070700210418767. 408
[32] Teratanavat R, Hooker NH. Consumer Valuations and Preference Heterogeneity for a Novel Functional 409
Food. J Food Sci 2006;71:S533–41. doi:10.1111/j.1750-3841.2006.00120.x. 410
[33] Verbeke W, Vackier I. Profile and effects of consumer involvement in fresh meat. Meat Sci 2004;67:159– 411
68. doi:10.1016/j.meatsci.2003.09.017. 412
[34] Meyer A. Does education increase pro-environmental behavior? Evidence from Europe. Ecol Econ 413
2015;116:108–21. doi:10.1016/j.ecolecon.2015.04.018. 414
[35] Panzone L, Hilton D, Sale L, Cohen D. Socio-demographics, implicit attitudes, explicit attitudes, and 415
sustainable consumption in supermarket shopping. J Econ Psychol 2016;55:77–95. 416
doi:10.1016/j.joep.2016.02.004. 417
[36] Whitmarsh L, Seyfang G, O’Neill S. Public engagement with carbon and climate change: To what extent 418
is the public ‘carbon capable’? Glob Environ Change 2011;21:56–65. 419
doi:10.1016/j.gloenvcha.2010.07.011. 420
[37] Olofsson A, Öhman S. General Beliefs and Environmental Concern: Transatlantic Comparisons. Environ 421
Behav 2006;38:768–90. doi:10.1177/0013916506287388. 422
[38] Sánchez M, López-Mosquera N, Lera-López F. Improving Pro-environmental Behaviours in Spain. The 423
Role of Attitudes and Socio-demographic and Political Factors. J Environ Policy Plan 2016;18:47–66. 424
doi:10.1080/1523908X.2015.1046983. 425
19
[39] Torgler B, García-Valiñas MA. The determinants of individuals’ attitudes towards preventing 426
environmental damage. Ecol Econ 2007;63:536–52. doi:10.1016/j.ecolecon.2006.12.013. 427
[40] Witzke HP, Urfei G. Willingness To Pay for Environmental Protection in Germany: Coping With the 428
Regional Dimension. Reg Stud 2001;35:207–14. doi:10.1080/713693807. 429
[41] Deng J, Walker GJ, Swinnerton G. A Comparison of Environmental Values and Attitudes Between 430
Chinese in Canada and Anglo-Canadians. Environ Behav 2006;38:22–47. 431
doi:10.1177/0013916505278458. 432
[42] Diamantopoulos A, Schlegelmilch BB, Sinkovics RR, Bohlen GM. Can socio-demographics still play a 433
role in profiling green consumers? A review of the evidence and an empirical investigation. J Bus Res 434
2003;56:465–80. doi:10.1016/S0148-2963(01)00241-7. 435
[43] Doran CJ. The Role of Personal Values in Fair Trade Consumption. J Bus Ethics 2009;84:549–63. 436
doi:10.1007/s10551-008-9724-1. 437
[44] Verain MCD, Bartels J, Dagevos H, Sijtsema SJ, Onwezen MC, Antonides G. Segments of sustainable 438
food consumers: a literature review. Int J Consum Stud 2012;36:123–32. doi:10.1111/j.1470-439
6431.2011.01082.x. 440
[45] Shapiro K. “I am a Vegetarian”: Reflections on a Way of Being. HEA 2014. 441
[46] Dietz T, Frisch AS, Kalof L, Stern PC, Guagnano GA. Values and Vegetarianism: An Exploratory 442
Analysis1. Rural Sociol 1995;60:533–42. doi:10.1111/j.1549-0831.1995.tb00589.x. 443
[47] Harper GC, Makatouni A. Consumer perception of organic food production and farm animal welfare. Br 444
Food J 2002;104:287–99. doi:10.1108/00070700210425723. 445
[48] Kalof L, Dietz T, Stern PC, Guagnano GA. Social Psychological and Structural Influences on Vegetarian 446
Beliefs. Rural Sociol 1999;64:500–11. doi:10.1111/j.1549-0831.1999.tb00364.x. 447
[49] Filippi M, Riccitelli G, Falini A, Salle FD, Vuilleumier P, Comi G, et al. The Brain Functional Networks 448
Associated to Human and Animal Suffering Differ among Omnivores, Vegetarians and Vegans. PLOS 449
ONE 2010;5:e10847. doi:10.1371/journal.pone.0010847. 450
[50] Graham J, Haidt J, Nosek BA. Liberals and conservatives rely on different sets of moral foundations. J 451
Pers Soc Psychol 2009;96:1029–46. doi:10.1037/a0015141. 452
[51] De Backer CJS, Hudders L. Meat morals: relationship between meat consumption consumer attitudes 453
towards human and animal welfare and moral behavior. Meat Sci 2015;99:68–74. 454
doi:10.1016/j.meatsci.2014.08.011. 455
456 457