221X2013000200010
23
Chemical changes of heat treated pine and eucalypt wood monitored
4by FTIR
5 6 Abstract 7A hardwood, Eucalyptus globulus Labill., and a softwood Pinus pinaster Aiton., were heat treated at
8
temperatures between 170 and 210ºC in an oven and in an autoclave. The samples were pre-extracted with
9
dichloromethane, ethanol and water and ground prior to Fourier Transform Infrared (FTIR) spectroscopic
10
analysis.
11
The heat treatment caused significant changes in the chemical composition and structure of wood, in
12
lignin and polysaccharides. Hemicelluloses were the first to degrade as proved by the initial decrease of the 1730
13
cm-1 peak due to the breaking of acetyl groups in xylan. Hardwood lignin changed more than softwood lignin, 14
with a shift of maximum absorption from 1505 cm-1 to approximately 1512 cm-1 due to decrease of methoxyl 15
groups, loss of syringyl units or breaking of aliphatic side-chains. The macromolecular structure becomes more
16
condensed and there is a clear increase of non-conjugated (1740 cm-1) in relation to conjugated groups (1650 cm -17
1). However, the changes induced by the thermal treatment are difficult to monitor by FTIR spectroscopy due to 18
the different chemical reactions occurring simultaneously.
19 20 21
Keywords: Eucalyptus globulus, FTIR, Heat treatment, Pinus pinaster
22 23
Introduction
24
Heat treatment is one of the processes for modifying the wood with greater 25
commercial success. There are different treatments: the Thermowood® process, originated in 26
Finland, uses steam (Viitanen et al. 1994), the Plato® process, developed in the Netherlands, 27
uses a combination of steam and heated air (Tjeerdsma et al. 1989), the Retiwood® process, 28
of French origin, uses an inert gas (Dirol and Guyonnet 1993), the OHT® from Germany, 29
uses hot oil (Sailer et al. 2000) and the Perdure® process, initially developed in France but 30
later sold to a company from Canada (Kocaefe et al. 2008a) uses steam. 31
Heat treatments lower the equilibrium moisture content of wood (Jämsa and 32
Viitaniemi 2001; Wang and Cooper 2005; Esteves et al. 2007a, b; 2008a), increase its 33
dimensional stability (Viitaniemi et al. 1997; Yildiz 2002. Wang and Cooper 2005. Esteves et 34
al. 2007 a, b), and increase its durability (Dirol and Guyonnet 1993. Kamdem et al. 2002) and 35
its darkness (Mitsui et al. 2001; Bekhta and Niemz 2003; Esteves et al 2008c). The main 36
disadvantage of these heat processes is the reduction of the wood mechanical strength 37
properties, such as static and dynamic bending strength (Yildiz 2002; Esteves et al. 2007 b) 38
and resistance to compression (Unsal and Ayrilmis 2005). 39
There are chemical changes in the the wood during heating. They start by 40
deacetylation of hemicelluloses followed by depolymerization catalysed by the released acetic 41
acid (Tjeerdsma et al. 1998; Sivonen et al. 2002; Nuopponen et al. 2004). Simultaneously 42
hemicelluloses undergo dehydratation with the decrease of hydroxyl groups (Weiland and 43
Guyonnet 2003). In accordance with Esteves et al. (2008 b) hemicelluloses are affected first, 44
followed by cellulose and lignin. 45
FTIR is widely used in quantitative and qualitative analysis of wood because of its 46
capacity to give information on the presence of functional groups, on composition and on 47
some specific structural features. 48
The main objective of this paper was to track the chemical changes occurring along 49
the heat treatment (two different treatments, one with hot air and the other with steam) of a 50
hardwood (Eucalyptus globulus) and a softwood (Pinus pinaster) by FTIR. 51
52
Material and methods
53 54
Two of the most important tree species in Portugal were tested: the hardwood 55
Eucalyptus globulus Labill. and the softwood Pinus pinaster Aiton.. The pine samples were 56
taken from the sapwood of a 40 year old tree from the Portuguese region of Águeda. For the 57
eucalypt samples only heartwood was used from a tree with approximately 1 m in diameter, 58
from the same region. The samples were treated in an oven and in an autoclave under several 59
operating conditions. 60
Cubic samples were prepared, with 40 mm edge, free from knots, resin canals or other 61
singularities, with faces parallel to radial, tangential and longitudinal directions. The samples 62
were stabilized during three weeks in a room conditioned at 50% relative humidity and 20°C. 63
The equilibrium moisture content and the mass of all samples were determined. 64
65 66
Oven heat treatments
67
The stabilized samples were treated in a Selecta 125 litre oven without forced 68
convection but with an outlet for gases exhaustion. The trials were conducted in the presence 69
of air during 2, 6, 12 and 24 h, at 170ºC and 180°C. The time to reach the treatment 70
temperature was one hour. Four samples were used in each test, making up a total of 32 71
samples for each species. At the end of the heat treatment all samples remained for one hour 72
in a desiccator and were weighted. The mass loss was determined for each sample in relation 73
to its initial dry mass in accordance with: 74
Mass loss (%) = (dry mass- treated mass) /dry mass * 100 75
T0 T1 P1 P2 Superheated Steam (320-340ºC) Saturated Steam (150ºC) 3 T2 Superheated steam (Waals heating) 5 4 Tc
Prototype (AMORIM, Natural Cork Boards Factory, Silves)
T3 4 3 2 H 2 H H 1 H 1 H H HH HH Closed Closed Open Open Closed
where the dry mass is the mass of the specimen without treatment, and the treated mass 76
corresponds to the dry mass of the specimen after heat treatment. 77
Autoclave heat treatment 78
The heat treatment in autoclave was carried out in an industrial prototype (Fig. 1), 79
used for the production of expanded cork agglomerates, installed in an industrial plant of the 80
Amorim Group located in Silves, Portugal. 81 82 83 84 85 86 87 88 89 90 91 92
Figure 1. Autoclave used in the heat treatment in the absence of oxygen. 93
94
The autoclave (1 m2 x 0.5 m in height), is divided into two parts by a metal plate
95
placed vertically. The heating was achieved by superheated steam jacket as well as a mixture 96
of superheated and saturated steam (Figure 1) from bottom to top. Since the experiments were 97
made with a free autoclave volume, without any flow resistance, the steam rises vertically 98
through the plate holes but with a preferentially horizontal direction from left to right with 99
some projection against the wall on the right side, rising and moving then to the left. 100
Tests were performed at normal pressure and temperatures between 190°C and 210°C 101
for 2, 6 and 12 h. It was not possible to test the samples at lower temperatures since the 102
minimum working temperature for the autoclave was 190ºC. The heating in the autoclave was 103
done slowly up to 130°C through the sleeve and between 130°C and the working temperature 104
the heating was quick and done with a mixture of saturated and superheated steam introduced 105
inside the autoclave. The temperature of the treatment was maintained through the heating by 106
the autoclave sleeve. The samples were taken from the autoclave after the treatment and 107
placed in a desiccator. The mass loss was determined for each sample in relation to its initial 108
dry mass as mentioned before. 109
For FTIR analysis, samples with approximately the same mass loss were chosen for 110
both species and treatments. For each treatment, at least three samples were chosen, one with 111
mass loss less than 1%, another one with mass loss around 3% which is generally considered 112
the necessary mass loss to obtain a good stability, and a higher mass loss. For eucalypt treated 113
in the autoclave a sample with mass loss less than 1% could not be obtained because all of the 114
samples had a higher mass loss due to the treatment. 115
116
FTIR Analysis
117
Treated and untreated samples were cut into small pieces and then ground separately 118
in a knife mill Retsch SMI, followed by a Thomas mill. The crushed material was subject to a 119
screening using a Retsch AS200basic with 40, 60 and 80 mesh sieves. The sieving was 120
carried out during a period of 20 minutes at a speed of 50 rpm. The sample was separated into 121
4 fractions (>40, 40-60, 60-80 and <80 mesh). The samples from the 40-60 fraction were then 122
extracted with dichloromethane, ethanol and water and air dried, according to Tappi Standard 123
(T 264 om-88). After that 200 mg of air-dried wood were weighted, placed in an oven at 60°C 124
overnight. The next day the samples were ground in a ball mill (Mixer Mill MM2, Retsch) for 125
30 min at maximum power and left in a desiccator over phosphorus pentoxide. Heat treated 126
pine and eucalypt wood samples with similar mass losses were chosen to collect the spectra. 127
One spectrum was collected for each treatment-time-species combination. 128
The spectra were obtained with 1.50 to 1.55 mg of material with 200 mg of dry KBr 129
ground in a ball mill (Mixer Mill MM2, Retsch) for 20 s. Disk (13 mm in diameter) were 130
formed on a 10 tons load hydraulic press. The sample and reference spectra were obtained 131
with 32 scans in a Bio-Rad FTS spectrometer 165 with a DTGS detector at 4 cm-1 resolution
132
for the 500-4000 cm-1 range. As reference we used the empty sample compartment. The
133
spectra were analysed with the program OPUS (Bruker), fixing the baseline on 20 points. No 134
normalization was made since no band stayed unaltered throughout the treatment. To clarify 135
some results the band height ratio between 1740 and 1650 cm-1 was determined according to
136
Faix and Böttcher (1992). 137
138
Results and Discussion
139
140
Figures 2 and 3 present the FTIR spectra of pine and eucalypt wood without treatment 141
and after heat treatment in the oven. Eucalypt wood treated at 170ºC for 2, 6, 12, and 24 h had 142
mass losses of 0.1%, 1.1%, 2.7% and 3.7%, respectively. While pine wood treated at 180ºC 143
during 2, 6, 12, and 24 h had mass losses of 0.8%, 1.4%, 4.0% and 7.4%, respectively. 144
Figures 4 and 5 present the FTIR spectra of pine and eucalypt wood without treatment 145
and after treatment in autoclave. Eucalypt wood treated at 190ºC during 2 and 12 h had mass 146
losses of 4.8% and 9.0% respectively. While pine wood treated at 190ºC during 2 and 6 h and 147
at 210ºC during 12 h had mass losses of 0.4%, 3.5% and 13.2% respectively. In order to show 148
more than one spectrum in each figure a shifting in the y axis was made. 149
150
Figure 2. FTIR spectra of pine wood: from top to bottom without treatment initial and after 151
treatment in an oven at 180ºC for 2 h, 6 h, 12 h and 24 h 152 153 500 1000 1500 2000 2500 3000 3500 4000 A bs or ba nc e Wavenumber (cm-1) 500 1000 1500 2000 2500 3000 3500 4000 A b so rb an ce Wavenumber (cm-1)
Figure 3. FTIR spectra of eucalypt wood: from top to bottom without treatment initial and 154
after treatment in oven at 170ºC for 2 h, 6 h, 12 h and 24 h 155
156
Figure 4. FTIR spectra of pine wood: from top to bottom without treatment initial and after 157
treatment in autoclave at 190ºC for 2 h, 6 h, and at 210ºC for 12 h 158
159
160
Figure 5. FTIR spectra of eucalyptus wood: from top to bottom without treatment initial and 161
after treatment in autoclave at 190ºC for 2 h and 12 h 162
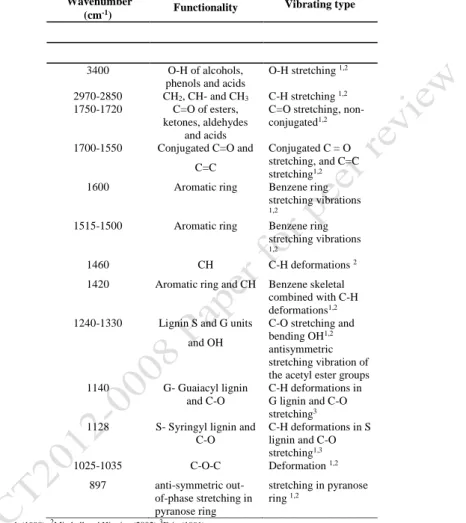
Table 1 presents the most important bands that are observed in an infrared spectrum of 163
wood and their assignment to functionality. 164 165 500 1000 1500 2000 2500 3000 3500 4000 A bs or ba nc e Wavenumber (cm-1) 500 1000 1500 2000 2500 3000 3500 4000 A bs or ba nc e Wavenumber (cm-1)
166 167
Table 1. Main bands of infrared spectrum of wood and their assignment to functionality 168
Wavenumber
(cm-1) Functionality Vibrating type
3400 O-H of alcohols,
phenols and acids
O-H stretching 1,2
2970-2850 CH2, CH- and CH3 C-H stretching 1,2
1750-1720 C=O of esters, ketones, aldehydes
and acids
C=O stretching, non-conjugated1,2
1700-1550 Conjugated C=O and C=C
Conjugated C = O stretching, and C=C stretching1,2
1600 Aromatic ring Benzene ring
stretching vibrations
1,2
1515-1500 Aromatic ring Benzene ring
stretching vibrations
1,2
1460 CH C-H deformations 2
1420 Aromatic ring and CH Benzene skeletal combined with C-H deformations1,2
1240-1330 Lignin S and G units and OH
C-O stretching and bending OH1,2
antisymmetric stretching vibration of the acetyl ester groups
1140 G- Guaiacyl lignin
and C-O
C-H deformations in G lignin and C-O stretching3
1128 S- Syringyl lignin and C-O
C-H deformations in S lignin and C-O stretching1,3 1025-1035 C-O-C Deformation 1,2 897 anti-symmetric out-of-phase stretching in pyranose ring stretching in pyranose ring 1,2
1Rodrigues et al. (1998);2Mitchell and Higgins (2002) 3Faix (1991)
169
The differences between spectra from untreated and heat treated wood were difficult to 170
interpret since there are several reactions occurring at the same time. Nevertheless, there were 171
changes in the FTIR spectra of wood with the heating treatments even for the mildest 172
conditions corresponding to small mass losses, as can be seen in the spectrum of eucalypt 173
treated in oven (Figure 3) at 170ºC during 2 h, corresponding to 0.1% mass loss. Even thought 174
there aren’t significant changes from untreated wood a small decrease of the 1740 cm-1 peak
was noticeable. With an increase in mass loss all of the wood compounds were affected 176
leading to several changes in the spectrum. 177
It is a well known fact that chemical changes due to heat treatment start by 178
deacetylation followed by depolymerization catalysed by the released acetic acid (Tjeerdsma 179
et al 1998; Sivonen et al 2002; Nuopponen et al 2004). At the same time there is a 180
carbohydrate dehydratation that reduces accessible OH groups (Weiland and Guyonnet 2003) 181
and leading to the formation of furfural and hydroxymethylfurfural (Tjeerdsma and Militz 182
2005). Lignin bonds are cleaved, resulting in a higher concentration of phenolic groups 183
(Kollmann and Fengel 1965). The increased reactivity leads to lignin autocondensation and 184
condensation reactions with aldehydes. 185
The FTIR spectra of heat-treated pine and eucalypt wood (Figures 2-5) showed a 186
broadening to lower wavenumbers of the band at 3430 cm-1 corresponding to the O-H
187
stretching vibration from alcohols (3600-3300 cm-1) and carboxylic acids (3300-2500 cm-1),
188
present either in polysaccharides and lignin. We suggest that this broadening might be due to 189
the increase in carboxylic acids due to primary OH oxidation and/or hydrolysis of acetyl 190
groups from hemicelluloses. Moreover the change of O-H stretching frequencies can also be 191
due to the modification of cellulose crystallinity influenced by dehydration effects (Moharram 192
and Mahmoud 2008, Spiridon et al. 2011). Even though O-H stretch due to polysaccharides 193
should decrease, at the same time O-H from phenolic groups in lignin increases since it is a 194
well known fact that the lignin percentage increases due to carbohydrate degradation (Esteves 195
et al. 2011). 196
The two bands at 2900-2800 cm-1 are composed by the overlapping of the stretch
197
asymmetric vibrations of -CH2- (generally around 2935-2915 cm-1 )and -CH3 (2970-2950 cm
-198
1) and by the overlapping of stretch symmetric vibrations of -CH
2- (2865-2845 cm-1) and
-199
CH3 (2880-2860 cm-1).Normally the asymmetric band presents a higher absorptivity. The
200
apparent shift in frequency for the maximum of CH band is due to structural and relative 201
composition changes, namely changes at cellulose crystallinity level which influences the C-202
H and O-H stretch frequencies (Moharram and Mahmoud 2008, Spiridon et al. 2011), and 203
changes in the relative importance of lignin methoxyl groups for which the CH3 stretching
204
vibrations have lower CH stretching frequencies (Coates, 2000). If the OCH3 increases by
205
reduction of the carbohydrates this implies that the contribution of the OCH3 becomes larger
206
and the consequence is that we can see that the right shoulder becomes maximum. Although 207
the asymmetric/symmetric stretch of methylene group (-CH2-) appears at slightly lower
208
Eliminado:
209
Formatada: Inglês (Reino Unido) Formatada: Inferior à linha Formatada: Inferior à linha
wavelengths this does not necessary mean that there is an increase in methylene groups at the 210
expense of methyl groups. 211
The C=O linkage exhibits strong absorptions in FTIR spectra between 1750 and 1700 212
cm-1, and the precise wavenumber depends of the functional group (carboxylic acid: at about
213
1725-1700 cm-1; ester, ketone: 1725-1705 cm-1, aldehyde: 1740-1720 cm-1) and of its
214
structural location, with lower wavenumbers for conjugated C=O. According to Mitchell and 215
Higgins (2002), the band around 1730 cm-1 is almost exclusively due to the carbonyl groups
216
of acetoxy groups in xylan. In the spectra of eucalypt and pine oven treated wood (Figures 2 217
and 3) this band decreased initially but for longer treatments the band increased, shifting to 218
smaller wavenumbers. The decrease at the beginning of the heat treatment (with mass losses 219
around 1%) might be due to the breaking of acetyl or acetoxy groups in xylan. Similar results 220
were obtained by Tjeersdsma and Militz (2005) after the first hydrothermal step of the Plato 221
process and by Kocaefe et al. (2008b) with wood treated by the Perdure process. In the 222
spectra of wood treated in autoclave (Figures 4 and 5) there was no initial decrease but only 223
an increase and shifting to about 1730 cm-1. A possible reason for the absence of the initial
224
decrease in these spectra is that the smaller mass losses for autoclave heat treated wood are 225
around 4-5 % and the cleavage of acetyl groups had already occurred, possible around 1-2% 226
mass loss. At these mass losses (4-5%) the decrease can no longer be seen because another 227
effect superimposes. The increase and shifting for smaller wavenumbers with increasing 228
treatment severity may be due to an increase of carbonyl or carboxyl groups in lignin or 229
carbohydrates by oxidation. This increase was also obtained by Kotilainen et al. (2000) with 230
Pinus sylvestris and Picea abies and González-Peña et al. (2009) who attributed this increase 231
to lignin condensation reactions at the expense of C=C double bonds in conjugated carbonyl 232
groups in lignin, vibrating at 1654 cm−1. Tjeerdsma and Militz (2005), who studied the FTIR 233
spectra of holocellulose and lignin of heat-treated Fagus sylvatica and Pinus sylvestris, 234
concluded that the increase of the 1740 cm-1 band was due only to the lignin as there was no
235
increase in holocellulose. These authors considered this increase to be due to the occurrence 236
of estherification when the existent acid reacts with the hydroxyl groups of the cell-wall 237
material. If estherification occurs the band at 1240 cm-1 should also increase due to
238
antisymmetric stretching vibration of the acetyl ester groups which with our samples doesn’t 239
happen. Nevertheless since this is a composed band the eventual increase could be overlapped 240
by the decrease of other compound. Li et al. (2002) studied the heat degradation of lignin in 241
hardwood and softwood and obtained an increase in the peak at 1720 cm-1 with increasing
242
temperature, which they concluded to be due to the production of C=O bonds in lignin 243
To better understand what happens between 1800 and 1600 cm-1 wavenumber Figure 6
244
shows this range of Figure 2 in detail (Pine oven treated wood) and presents also the ratio of 245
the band heights at 1740 and 1650 cm-1. In this figure an initial decrease followed by an
246
increase of the 1740 cm-1 band in relation to 1650 cm-1 band can be seen. The maximum of
247
the 1740 cm-1 band shifts from the initial point around 1738 cm-1 to about 1729 cm-1.
248
249
Figure 6. FTIR spectra of pine wood in the wavenumber range from 1800 to 1600 cm-1. From top to 250
bottom: without treatment and after treatment in an oven at 170ºC for 2 h, 6 h, 12 h and 24 h and ratio 251
of band heights at 1740 cm-1 / 1650 cm-1. 252
253
The increase of the peak at 1740 cm-1 in relation to 1650 cm-1 means that
non-254
conjugated C=O groups increased in relation to conjugated groups. Similar results were 255
described by González-Peña et al. 2009. 256
The band at 1595 cm-1 corresponds to vibrations in the aromatic ring of lignin plus
257
C=O stretching. The band at 1595 cm-1 broadens to about 1613 cm-1 for eucalypt but not for
258
pine wood (Figures 2 to 5). This peak broadening suggests that there was an increase of 259
structural diversity around the aromatic rings, absorbing at a greater range of frequencies. The 260
height of the band seemed to increase only in the spectrum of eucalypt wood treated in 261
autoclave (Figure 5). According to Kotilainen et al. (2000) this band increases due to an 262
increase in the percentage of lignin in treated wood. Li et al. (2002) also obtained an increase 263
of the peak at 1595 cm-1 in lignin at temperatures between 25ºC and 460°C, although no
264
explanation was given. 265 Ini 0.95 2h 0.94 6h 1.03 12h 1.07 24h 1.08 1740/1650
Aromatic rings exhibit, most of the times, a characteristic band at approximately 1500 266
cm-1, corresponding to benzene ring stretching vibrations. This band is very important
267
because it is at about 1505 cm-1 for hardwood lignin (Guaiacyl - G and Syringyl - S) and at
268
about 1510 cm-1 for softwood lignin (Guaiacyl-G) (Faix 1991). The band at 1505 cm-1 for
269
eucalypt wood decreased, shifting to about 1512 cm-1 (Figure 7). This can be due to the
270
decrease of the methoxyl groups in lignin which would lead to a lignin more similar to 271
softwood (G-lignin) or to the loss of S units, since this monomer is generally less condensed 272
by C-C bonds than guaiacyl monomers and is more prone to be liberated by a thermal 273
degradation (Faix et al. 1990). 274
275
Figure 7. FTIR spectra of eucalypt wood from top to bottom without treatment and after treatment in 276
oven at 170ºC for 2 h, 6 h, 12 h and 24 h in the range 1750-1200 cm-1 277
The shifting of this band is in agreement to the results presented by Windeisen et al. 278
(2007) and Kocaefe et al. (2008b), andattributed to the breaking of aliphatic side-chains in 279
lignin and/or condensation reactions. 280
The band at 1460 cm-1 corresponds to the asymmetric deformation of C-H bond of
281
xylan, while the band at 1420 cm-1 corresponds to the vibration of the aromatic ring of lignin,
282
but also to the C-H bending in cellulose (Mitchell and Higgins 2002). No consistent variation 283
was found for the 1460 cm-1 and 1420 cm-1 peaks. According to Kotilainen et al. (2000) and
284
Weiland and Guyonnet (2003) the peaks at 1460 cm-1 and1420 cm-1 increase with heat
285
treatment. The band at 1375 cm-1 broadened to smaller wavenumbers but with no consistent
286
variance. The band at 1333 cm-1 represents the contributions of all structural components of
287
wood because it corresponds to C-H bending of polysaccharides which joins the band at 1327 288 1505 1515 1245 1200 1300 1400 1500 1600 1700 A b so rb an ce Wavenumber (cm-1) Eliminado: 1700 289
cm-1 of S and G lignin condensed units (Faix 1991). There was a clear increase at 1330 cm-1
290
corresponding to an increase in lignin condensation. The same was reported by Windeisen et 291
al. (2007). 292
For eucalypt wood (Figures 3, 5 and 7) the band at 1245 cm-1, decreased in height but
293
broadened which once again confirms the existence of a more condensed structure 294
(Windeisen et al. 2007; Kocaefe et al. 2008b). According to Kotilainen et al. (2000) this peak 295
increases, but no explanation was given. The band at 1140 cm-1 is the result of the sum of the
296
contribution of C-H deformation in aromatic rings and C-O stretching in primary alcohols. 297
This band has a shoulder at 1140 cm-1 in woods with G lignin (Figure 2 and 4) and 1128 cm-1
298
in the woods with GS lignin (Figures 3 and 5) (Faix 1991). No consistent variation was found 299
for this band. 300
The peak at 897 cm-1, corresponding to the sugar ring tension, seemed to decrease with
301
increasing severity of the treatment which is consistent with ring opening (Figures 2 to 5). 302
Similar results were obtained by Kotilainen et al. (2000) and González-Peña et al. (2009). 303
These results are generally consistent with the chemical changes determined by wet 304
chemistry for heat treated pine and eucalypt in oven and in autoclave (Esteves et al. 2006; 305
Esteves et al. 2008b; Esteves et al. 2011). In the beginning of the treatment, hemicelluloses 306
are the first to degrade, as proved here by the initial decrease of the 1740 cm-1 peak attributed
307
to the cleavage of acetyl or acetoxy groups in xylan. The attack on polysaccharides during 308
heating is clear by the decrease of the peak at 897 cm-1 corresponding to the pyranose ring
309
opening. The increase in lignin content that derived from the carbohydrate loss can be seen by 310
the later increase of the 1740 cm-1 peak which according to Li et al (2002) is due to the
311
formation of carbonyl groups in lignin. 312
No significant differences between oven and autoclave treatments were observed. In 313
the range of the studied thermal treatments and wood mass losses, no influence of air or steam 314
heating was detected by FTIR analysis. The different chemical reactions occurring at the same 315
time make the existing differences between spectra very difficult to follow. 316 317 Conclusions 318 319
The heat treatment caused significant changes in the chemical composition and 320
structure of wood, by changing polysaccharides and lignin. That can be observed by FTIR 321
analysis. Hemicelluloses are the first components to degrade due to deacetylation. Hardwood 322
lignin changes more than softwood lignin, due to demethoxylation, loss of S units or breaking 323
of aliphatic side-chains. The macromolecular lignin structure becomes more condensed with 324
the presence of non-conjugated/conjugated groups. The changes induced by the thermal 325
treatment are due to different chemical reactions occurring simultaneously. 326
327
Acknowledgements
328
The authors thank the Portuguese Foundation for Science and Technology and the 329
Centre for Studies in Education, Technologies and Health for the financial support. 330
331
References
332
Bekhta, P.; Niemz, P. 2003. Effect of high temperature on the change in color, dimensional 333
Stability and mechanical properties of spruce wood, Holzforschung, 57: 539-546. 334
Coates, J. 2000. Interpretation of Infrared Spectra, A Practical Approach in Encyclopedia of 335
Analytical Chemistry R.A. Meyers (Ed.) pp. 10815–10837 John Wiley & Sons Ltd. 336
Dirol, D.; Guyonnet, R. 1993. Durability by rectification process, In: International 337
Research Group Wood Pre, Section 4-Processes, Nº IRG/WP 93-40015. 338
Esteves, B.; 2006. Technological Improvement of Portuguese Woods by Heat Modification, 339
Ph.D. Thesis in Environmental Engineering. School of Agronomy. Technical 340
University of Lisbon. In Portuguese. 341
Esteves, B.; Domingos, I.; Pereira, H. 2007a Improvement of technological quality of 342
eucalypt wood by heat treatment in air at 170-200ºC, For. Prod. J. 57 (1/2): 47-52. 343
Esteves, B.; Velez Marques, A.; Domingos, I.; Pereira, H. 2007b. Influence of steam heating 344
on the properties of pine (Pinus pinaster) and eucalypt (Eucalyptus globulus) wood, 345
Wood Sci. Technol. 41:193-207. 346
Esteves, B. M.; Domingos, I. J.; Pereira, H. M. 2008a. Pine wood modification by heat 347
treatment in air, BioResources 3(1): 142-154. 348
Esteves, B.; Graça, J.; Pereira, H. 2008b. Extractive composition and summative chemical 349
analysis of thermally treated eucalypt wood, Holzforschung, 62: 344-351. DOI 350
10.1515/HF.2008.057. 351
Esteves, B.; Velez Marques, A.; Domingos, I.; Pereira, H. 2008c. Heat induced colour 352
changes of pine (Pinus pinaster) and eucalypt (Eucalyptus globulus) wood, Wood Sci. 353
Technol. 42(5): 369-384. 354
Esteves, B.; Videira, R.; Pereira, H. 2011 Chemistry and ecotoxicity of heat treated pine wood 355
extractives, Wood Sci. Technol., 45:661-676. DOI: 10.1007/s00226-010-0356-0. 356
Faix, O. 1991. Classification of lignins from different botanical origins by FT-IR 357
spectroscopy, Holzforschung 45: 21-27. 358
Faix, O. Böttcher, J. 1992. The influence of particle size and concentration in transmission 359
and diffuse reflectance spectroscopy of wood, Holz als Roh- und Werkst. 50: 221-226. 360
Faix, O.; Meier, D.; Fortmann, I. 1990. Thermal-degradation products of wood. Gas 361
chromatographic separation and mass spectrometric characterization of monomeric 362
lignin derived products. Holz als Roh-und Werkst , 48, 281-285. 363
González-Peña, M.M.; Curling, S.F.; Hale, M.D.C. 2009. On the effect of heat on the 364
chemical composition and dimensions of thermally-modified wood. Polymer 365
Degradation and Stability, 94(12): 2184-2193. 366
Jämsä, S.; Viitaniemi, P. 2001. Heat treatment of wood – Better durability without chemicals, 367
In: Proceedings of special seminar held in Antibes, France. 368
Moharram, M.; Mahmoud, O. 2008. FTIR Spectroscopic Study of the Effect of Microwave 369
Heating on the Transformation of Cellulose I into Cellulose II during Mercerization. 370
Journal of Applied Polymer Science 107, (1), 30–36. 371
Kamdem, D.; Pizzi, A.; Jermannaud, A. 2002. Durability of heat-treated wood, Holz Roh-372
Werkst. 60: 1-6. 373
Kocaefe, D.; Jun, L. S.; Yang, D.Q.; Bouazara, M. 2008a. Mechanical properties, dimensional 374
stability, and mold resistance of heat-treated jack pine and aspen. For Prod J 58(6):88– 375
93 376
Kocaefe, D.; Poncsak, S.; Boluk, Y. 2008b. Effect of thermal treatment on the chemical 377
composition and mechanical properties of birch and aspen, Bioresources. 3(2): 517-378
537. 379
Kollmann, F.; Fengel, D. 1965 Changes in the Chemical composition of Wood by Thermal 380
Treatment Holz als Roh und Werkst., 12: 461-468. 381
Kotilainen, R.; Toivannen, T.; Alén, R. 2000. FTIR monitoring of chemical changes in 382
softwood during heating, Journal of Wood Chemistry and Technology 20 (3): 307-383
320. 384
Li, J.; Li, B.; Zhang, X. 2002. Comparative studies of heat degradation between larch lignin 385
and Manchurian ash lignin, Polymer Degradation and Stability 78: 279-285. 386
Michell, A.; Higgins, H. 2002. Infrared Spectroscopy in Australian Forest Products research, 387
CSIRO Forestry and Forest Products, Melbourne, Australia pp 60. 388
Michell, A.; Watson A.; Higgins H. 1965 An infrared spectroscopic study of delignification 389
of eucalyptus regnans, Tappi 48: 520-532. 390
Mitsui, K.; Takada, H., Sugiyama, M.; Hasegawa, R. 2001. Changes in the properties of light-391
irradiated wood with heat treatment: Part 1 Effect of treatment conditions on the 392
change in color Holzforschung, 55, 601-605. 393
Nuopponen, M.; Vuorinen, T.; Jamsä, S.; Viitaniemi, P. 2004. Thermal modifications in 394
softwood studied by FT-IR and UV resonance Raman spectroscopies, J. Wood Chem. 395
Technol. 24: 13-26. 396
Rodrigues, J.; Faix O.; Pereira H. 1998 Determination of lignin content of Eucalyptus 397
globulus wood using FTIR spectroscopy, Holzforschung 52: 46-50. 398
Sailer, M.; Rapp, A.; Leithoff, H. 2000. Improved resistance of Scots pine and spruce by 399
application of an oil-heat treatment, In: International Research Group Wood Pre, 400
Section 4-Processes, Nº IRG/WP 00-40162. 401
Spiridon, I.; Teacǎ, C.; Bodîrlǎu, R. 2011. Structural changes evidenced by FTIR 402
spectroscopy in cellulosic materials after pre-treatment with ionic liquid and 403
enzymatic hydrolysis, BioResources, 6 (1) 400–413. 404
Sivonen, H.; Maunu, S.; Sundholm, F.; Jämsä, S.; Viitaniemi, P. 2002. Magnetic resonance 405
studies of thermally modified wood, Holzforschung. 56: 648-654. 406
TAPPI Test Method T264 om-88, "Preparation of Wood For Chemical Analysis." In Tappi 407
Test Methods. Atlanta, GA: Technical Association of the Pulp and Paper Industry. 408
Tjeerdsma, B.; Boonstra, M.; Pizzi, A.; Tekely, P.; Militz, H. 1998. Characterisation of 409
thermaly modified wood: Molecular reasons for wood performance improvement, 410
Holz Roh-Werkst 56: 149-153. 411
Tjeerdsma, B.; Militz, H. 2005. Chemical changes in hydrothermal treated wood: FTIR 412
analysis of combined hydrothermal and dry heat-treated wood. Holz als Roh- und 413
Werkst. 63: 102-111. 414
Unsal, O.; Ayrilmis, N. 2005. Variations in compression strength and surface roughness of 415
heat-treated Turkish river red gum, J. Wood Sci. 51: 405-409. 416
Viitaniemi, P.; Jämsä, S.; Viitanen, H.; 1997 Method for improving biodegradation resistance 417
and dimensional stability of cellulosic products. United States Patent Nº 5678324 418
(US005678324) 419
Wang, J.; Cooper, P. 2005 Effect of oil type, temperature and time on moisture properties of 420
hot oil-treated wood. Holz Roh-Werkst 63: 417-422 421
Formatada: Inglês (Reino Unido) Código de campo alterado
Weiland, J.; Guyonnet, R. 2003. Study of chemical modifications and fungi degradation of 422
heatly modified wood using DRIFT spectroscopy, Holz als Roh und Werkst 61: 216-423
220. 424
Windeisen, E.; Strobel, C.; Wegener, G. 2007. Chemical changes during the production of 425
thermo-treated beech wood, Wood Sci. Technol. 41: 523-536. 426
Yildiz, S. 2002. Physical, mechanical, technological and chemical properties of beech and 427
spruce wood treated by heating, PhD dissertation, Karadeniz Tech. Univ.; Trabzon, 428 Turkey. 429 430 431 432 433