Departamento De aDministracion y economia De la empresa FacultaD De economia y empresa
universiDaD De salamanca
thesis Doctoral
loyalty in Business Banking
presenteD By: anaBela oliveira Da silva Fragata
DirecteD By: Dr. D. paBlo a. munõz gallego
acknoloDgments
The best and worst moments of my doctoral dissertation journey have been shared with many people. It has been a great privilege to spend several years in the Departament of “Administracion y Economia de la Empresa” in “Facultad de Economia y Empresa” in the University of Salamanca.
Generous financial support made my doctoral studies possible. I would like to thank the “Fundação para a Ciencia e Tecnologia –FCT” for the privilege of benefiting from the scholarship PROTEC, providing the founding for this study. I have benefited greatly from the generosity and support of my faculty- “Escola Superior de Tecnologia e Gestão de Lamego- Instituto Politecnico de Viseu”. I would like to thank my Doctoral Director Dr. D. Pablo Munõz Gallego for is support throughout the course of my research. I will always remember his conscientiousness, willingness to go the extra mile to help a student, boundless generosity and enthusiasm. He has an uncanny knack of appearing to have unlimited time not only for me, but also for other students, faculty and staff. His comments, whether they regarded my dissertation, my career plans, or other matters, were consistently insightful. Above all else, I will remember the optimism he brings to everything he touches and the universal respect that he commands.
Special thanks go to my family, my husband, my mother, my father, my brother Jorge, my grandparents and my aunt Teresa and Filomena, for always making me feel as though everything would be ok, reminding me not to worry too much, and for giving me the chance to be a part of a family where one could never feel alone.
Finally, this dissertation is dedicated to my dear and beautiful daughter Diana, thanks for bringing light into my life.
general content
INTRODUCTION ... 12
1.THE BANKING SECTOR IN PORTUGAL ... 18
1.1Introduction ... 18
1.2 The Portuguese financial system ... 19
1.3 Financial System Features ... 21
1.4 Business Banking in Portugal ... 23
1.5 E-Banking in Portugal ... 25
1.6 References ... 30
2.THE IMPORTANCE OF PERCEIVED SERVICE QUALITY ON BANKING LOYALTY FOR BUSINESS CUSTOMERS ... 32
2.1 Introduction ... 32
2.2 The concept of service loyalty ... 33
2.2.1 Behavioural perspective ... 33 2.2.2 Attitudinal perspective ... 33 2.2.3 Cognitive perspective ... 34 2.2.4 Repurchase intent ... 34 2.2.5 Mixed perspectives ... 34 2.3 Brand loyalty ... 37
2.4 The importance of loyalty ... 39
2.5 Obstacles to Loyalty ... 40
2.6 Loyalty Programmes ... 41
2.7 The concept of Banking Loyalty ... 41
2.8 Banking Loyalty for business customers ... 42
2.8.1 Small and medium sized business customers ... 42
2.10 Proposed Model ... 46
2.11 Methodology and Design of the investigation ... 49
2.11.1 Introduction ... 49
2.11.2 Purposes of the investigation... 49
2.11.3 Developing the questionnaire ... 49
2.11.3.1 Pre-test ... 49
2.11.3.2 Scales ... 49
2.11.3.3 E-Mail survey ... 50
2.11.3.4 Sample description ... 50
2.12 Steps used for model estimation ... 53
2.13 Findings ... 55
2.14 Discussion ... 58
2.15 Managerial implications and future research ... 59
2.16 References ... 60
3. THE DETERMINANTS OF BANKING LOYALTY FOR BUSINESS CUSTOMERS 66 3.1 Introduction ... 66
3.2 Loyalty ... 66
3.2 Literature review about the determinants of Banking Loyalty ... 68
3.3. Main determinants of Banking Loyalty for the proposed model ... 71
3.3.1Perceived Service Quality ... 71
3.3.2 Customer satisfaction ... 71
3.3.3 Image... 73
3.2.4 Perceived Switching Costs ... 75
3.3 Methodology and Design of the investigation ... 77
3.3.1 Introduction ... 77
3.3.2 Purposes of the investigation... 77
3.3.3 Data collection ... 77
3.4 Findings ... 79
3.5 Discussion ... 86
3.6 Managerial implications and future research ... 88
3.7 References ... 89
4.1 Introduction ... 97
4.2 The advantages of online banking ... 98
4.3 Previous E-banking research ... 98
4.4 The importance of E-banking Service Quality ... 101
4.5 E-banking for Business customers ... 104
4.6 E-banking Loyalty ... 106
4.7 Proposed Model ... 106
4.8 Methodology and Design of the investigation ... 109
4.8.1 Introduction ... 109
4.8.2 Purposes of the investigation... 109
4.8.3 Developing the questionnaire ... 109
4.8.3.1 Pre-test ... 109 4.8.3.2 Scales ... 110 4.8.3.3 E-Mail survey ... 111 4.8.3.4 Sample description ... 111 4.9 Findings ... 114 4.10 Discussion ... 117
4.11 Managerial implications and Future Research ... 118
4.12 References ... 118
5.DETERMINANTS OF E-BANKING LOYALTY FOR BUSINESS CUSTOMERS ... 125
5.1 Introduction ... 125
5.2 Literature review about the determinants of E-banking Loyalty ... 126
5.3 Main Determinants of E-Banking Loyalty ... 128
5.3.1 E-Banking Service Quality... 128
5.3.2 E-Banking Customer Satisfaction ... 129
5.3.3 E-Banking Trust ... 130
5.3.4 Image... 131
5.3.5 Perceived Switching Costs ... 132
5.4 Methodology and Design of the investigation ... 136
5.5 Findings ... 137
5.5.1 The relation between E-banking Quality, E-Banking Satisfaction and E-Banking Loyalty ... 138
5.5.2 The relation between E-banking Service Quality and E-Trust ... 139
5.5.5 The relation between E-Banking Quality, Perceived Switching Costs and E-Banking Loyalty ... 143
5.5.6 The final model ... 145
5.6 Discussion ... 149
5.7 Managerial implications and Future Research... 151
5.8 References ... 153
6. THE INFLUENCE OF GENERATED INTERPERSONAL RELATIONSHIPS AND QUALITY PERCEPTIONS IN TRADITIONAL BANKING FOR THE LOYALTY IN ONLINE BANKING... 160
6.1 Introduction ... 160
6.2 The importance of technology in business banking ... 161
6.3 The importance of personal interaction ... 162
6.4 The relationship between personalized interaction and technology in business banking ... 162
6.5 Proposed Model ... 163
6.6 Methodology and Design of the investigation ... 164
6.7 Data Analysis and Results ... 166
6.8 Discussion and Managerial Implications ... 170
6.9 References ... 172
FINAL CONCLUSIONS ... 175
taBle contents
chapter i
TABLE 1. 1- LIST OF BANKS WITH ACTIVITY IN PORTUGAL ... 21
TABLE 1. 2- MAIN BANK INDICATORS OF THE PORTUGUESE BANKS ... 22
TABLE 1. 3- REASONS NOT TO ORDER IN THE INTERNET ... 27
chapter ii
TABLE 2. 1- CATEGORIES OF LOYALTY ... 37TABLE 2. 2- OTHER STUDIES ABOUT THE DIMENSIONS OF SERVICE QUALITY ... 45
TABLE 2. 3- THE SURVEY MEASURES ... 49
TABLE 2. 4-ECONOMIC CHARACTERISTICS OF THE SAMPLE ... 50
TABLE 2. 5- UNIVARIATE ANALYSIS OF THE NUMBER OF BANKS USED ... 51
TABLE 2. 6- LEVELS OF ACCEPTABLE FIT IN STRUCTURAL EQUATION MODELLING ... 54
TABLE 2. 7- EXPLORATORY AND CONFIRMATORY FACTOR ANALYSIS FOR THE PROPOSED MODEL ... 56
TABLE 2. 8- CORRELATIONS BETWEEN THE VARIABLES IN THE MODEL ... 57
chapter iii
TABLE 3. 1- DETERMINANTS OF LOYALTY ... 67TABLE 3. 2- DETERMINANTS OF BANK LOYALTY ... 69
TABLE 3. 3- THE STUDY MEASURES ... 78
TABLE 3. 4- EXPLORATORY FACTOR ANALYSIS ... 79
TABLE 3. 5- DISCRIMINANT VALIDITY ... 80
TABLE 3. 6- CORRELATIONS BETWEEN THE VARIABLES ... 81
TABLE 3. 7- CORRELATIONS BETWEEN THE VARIABLES ... 82
TABLE 3. 8- CORRELATIONS BETWEEN THE VARIABLES ... 82
TABLE 3. 9- EXPLORATORY AND CONFIRMATORY FACTORIAL ANALYSIS ... 83
TABLE 3. 10- CORRELATIONS BETWEEN THE VARIABLES IN THE MODEL ... 84
chapter iv
TABLE 4. 1- ADVANTAGES OF ONLINE BANKING ... 98TABLE 4. 2-PREVIOUS E- BANKING RESEARCH ... 100
TABLE 4. 3- DETERMINANTS OF E-BANKING SERVICE QUALITY ... 103
TABLE 4. 4- E-BANKING FOR BUSINESS CUSTOMERS ... 105
TABLE 4. 5- THE CONCEPTUAL DIMENSIONS OF E-BANKING SERVICE QUALITY ... 108
TABLE 4. 8- CONFIRMATORY AND EXPLORATORY FACTOR ANALYSIS FOR THE PROPOSED
MODEL ... 116
TABLE 4. 9- CORRELATIONS BETWEEN THE VARIABLES IN THE MODEL ... 116
chapter v
TABLE 5. 1- CONCEPTUAL MODEL ... 135TABLE 5. 2- THE SURVEY MEASURES ... 136
TABLE 5. 3- EXPLORATORY AND CONFIRMATORY ANALYSIS ... 137
TABLE 5. 4- DISCRIMINANT VALIDITY BETWEEN ALL THE CONSTRUCTS IN THE PROPOSED MODEL ... 138
TABLE 5. 5- CORRELATIONS BETWEEN THE VARIABLES IN THE MODEL ... 138
TABLE 5. 6- CORRELATIONS BETWEEN THE VARIABLES IN THE MODEL ... 140
TABLE 5. 7-CORRELATIONS BETWEEN THE VARIABLES IN THE MODEL ... 141
TABLE 5. 8- CORRELATIONS BETWEEN THE VARIABLES IN THE MODEL ... 142
TABLE 5. 9- STANDARDIZED TOTAL, DIRECT AND INDIRECT EFFECTS ... 142
TABLE 5. 10- CORRELATIONS BETWEEN THE VARIABLES IN THE MODEL ... 143
TABLE 5. 11- STANDARDIZED TOTAL, DIRECT AND INDIRECT EFFECTS ... 144
TABLE 5. 12-CORRELATIONS BETWEEN THE VARIABLES IN THE MODEL ... 145
TABLE 5. 13-EXPLORATORY AND CONFIRMATORY MODEL ANALYSIS ... 147
TABLE 5. 14- CORRELATIONS BETWEEN THE VARIABLES IN THE FINAL MODEL ... 148
TABLE 5. 15- STANDARDIZED TOTAL, DIRECT AND INDIRECT EFFECTS ... 148
chapter vi
TABLE 6. 1- MEASUREMENT ITEM DESCRIPTION ... 165TABLE 6. 2- EXPLORATORY AND CONFIRMATORY FACTORIAL ANALYSIS ... 167
TABLE 6. 3- TESTS RESULTS ON CONVERGENT AND DISCRIMINANT VALIDITY ... 167
TABLE 6. 4- CORRELATIONS BETWEEN THE VARIABLES IN MODEL A ... 168
TABLE 6. 5- CORRELATIONS BETWEEN THE VARIABLES IN MODEL B ... 168
TABLE 6. 6- STANDARDIZED TOTAL, DIRECT AND INDIRECT EFFECTS BETWEEN THE CONSTRUCTS IN THE MODEL A ... 168
Final conclusions
TABLE 7. 1- TRADITIONAL AND ONLINE BANKING RESULTS COMPARISONS ... 179Figure contents
introDuction
FIGURE A 1- DETERMINANTS OF LOYALTY IN THE TRADITIONAL BANK BRANCH ... 13
FIGURE A 2- DETERMINANTS OF E-BANKING LOYALTY ... 14
chapter i
FIGURE 1. 1- THE PORTUGUESE FINANCIAL SYSTEM ... 20FIGURE 1. 2- COMPANIES ANNUAL TURNOVER-2008 ... 24
FIGURE 1. 3- N. OF BANKS USED ACCORDING TO FIRM SIZE ... 25
FIGURE 1. 4- USE OF INTERNET BANKING IN THE EU 27 (%)... 26
FIGURE 1. 5- INDIVIDUALS THAT MADE ORDERS THROUGH THE INTERNET (%) ... 27
FIGURE 1. 6- ANTIQUITY OF THE ONLINE ACCOUNT ... 28
FIGURE 1. 7-– LOYALTY TO THE ON-LINE FINANCIAL INSTITUTION ... 29
FIGURE 1. 8- MOTIVES FOR CHANGING THE ONLINE FINANCIAL INSTITUTION ... 29
chapter ii
FIGURE 2. 1- PROPOSED CONCEPTUAL MODEL ... 48FIGURE 2. 2- MOST USED BANK AS THE FIRST CHOICE ... 51
FIGURE 2. 3- AVERAGE NUMBER OF BANKS ACCORDING TO FIRM SIZE ... 52
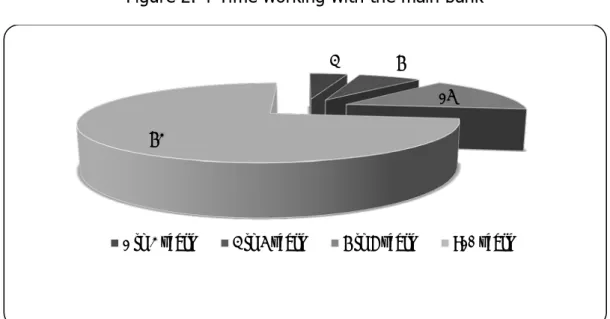
FIGURE 2. 4--TIME WORKING WITH THE MAIN BANK ... 53
FIGURE 2. 5- STRUCTURAL EQUATION MODEL ... 57
chapter iii
FIGURE 3. 1- PROPOSED MODEL ... 77FIGURE 3. 2- STRUCTURAL EQUATION MODEL FOR THE RELATION BETWEEN BANKING SERVICE QUALITY, PERCEIVED SWITCHING COSTS AND LOYALTY ... 83
FIGURE 3. 3- STRUCTURAL EQUATION MODEL FOR THE RELATION BETWEEN BANKING SERVICE QUALITY, PERCEIVED SWITCHING COSTS AND LOYALTY ... 86
chapter iv
FIGURE 4. 1- PROPOSED CONCEPTUAL MODEL ... 109FIGURE 4. 3- AVERAGE NUMBER OF ELECTRONIC BANKS USED BY THE COMPANY SIZE ... 112 FIGURE 4. 4- TIME WORKING WITH THE MAIN ELECTRONIC BANK ... 113 FIGURE 4. 5- FREQUENCY IN USING ONLINE BANKING ... 113 FIGURE 4. 6- EVALUATION OF THE GENERAL QUALITY OF THE MAIN ONLINE BANK USED BY
THE COMPANY ... 114 FIGURE 4. 7- STRUCTURAL EQUATION MODEL ... 116
chapter v
FIGURE 5. 1- MODEL DEVELOPED BY METHLIE AND NYSVEEN ... 127 FIGURE 5. 2- MODEL OF FLOH & TREIBLMAIER ... 128 FIGURE 5. 3- PROPOSED CONCEPTUAL MODEL ... 134 FIGURE 5. 4- STRUCTURAL EQUATION MODEL FOR THE RELATION BETWEEN E-BANKING
QUALITY AND E-TRUST ... 140 FIGURE 5. 5- STRUCTURAL EQUATION MODEL BETWEEN IMAGE, SATISFACTION AND
E-LOYALTY ... 142 FIGURE 5. 6- STRUCTURAL EQUATION MODEL FOR THE RELATION BETWEEN E-BANKING
QUALITY, SWITCHING COSTS AND E-BANKING LOYALTY... 144 FIGURE 5. 7- STRUCTURAL EQUATION MODEL FOR THE RELATION BETWEEN E-BANKING
QUALITY, SWITCHING COSTS AND E-BANKING LOYALTY... 145 FIGURE 5. 8- STRUCTURAL EQUATION MODEL FOR THE FINAL MODEL ... 147 FIGURE 5. 9- STRUCTURAL EQUATION MODEL ... 149
chapter vi
FIGURE 6. 1- PROPOSED MODELS ... 164 FIGURE 6. 2- STRUCTURAL EQUATION MODEL A ... 169
introDuction
The main purpose of this investigation is to analyze the major determinants of loyalty, for the Portuguese business banking customers in the traditional bank branch and in online banking.
The subject customer loyalty has been extensively explored in the marketing literature, especially for the private customers and small companies’ bank segments.
Considerable discussion exists in the academic literature over the definition and dimensionality of loyalty. Many definitions are based in behavioral intentions (repurchase or purchase frequency), attitudinal (positive affect toward the relationship continuance), active loyalty (word of mouth and intention to use), passive loyalty (not switching under less positive conditions) and some authors propose a combination between these approaches.
Numerous studies have also been conducted to identify the benefits that customer loyalty delivers to an organization. The majority of this research has concentrated on the financial benefits derived from retaining customers, including the initial cost of introducing and attracting new customers, increases in the number of purchases, and also a reduction in defection can contribute to an increase in profits far more than an increase in the market share.
Loyalty in financial services has been viewed in relation to the length of time a customer has been with a provider, number of services used, and frequency of service use, customer´s recommendations, and customer´s price indifference, low likelihood of switching and high potential of increasing volume of product use.
Few researches have been investigating the determinants of Loyalty for the medium/large corporate bank customers.
This bank segment is more valuable and complex in terms of frequency of multiple banking relationships than the more frequently investigated retail banking market.
Recent research has revealed that there are differences between the nature of the relationship with banks depending on the firm size and as companies grow their bargaining power increases and also their number of banks used, showing that this bank segment has split banking arrangements, preferring to benefit from the relation with several banks.
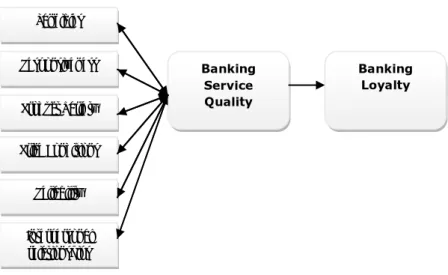
In business-to-business researches the most important and frequently examined determinants of loyalty in the traditional bank environment are: Perceived Service Quality, Customer Satisfaction, Image and Perceived
Figure A 1- Determinants of Loyalty in the traditional bank branch
Source: own elaboration
Perceived Service Quality has been widely investigated as being the major determinant of Loyalty. It has been defined as a function of the ability to perform the promised service dependably and accurately, the willingness to help customers and provide prompt service, the knowledge and courtesy of employees and their ability to inspire trust and confidence, the individualized attention the firm provides its customers and the physical facilities, equipment and appearance of personnel, and product variety. These factors among others can contribute for building Loyalty.
Customer Satisfaction has been conceptualized from different ways in previous investigations. It has been defined as the satisfaction with the organization in general, satisfaction with the personnel, and accumulated experience of a customer’s purchase and consumption experiences. From any perspective the level of satisfaction affects Loyalty.
The Image of a bank can also play an important role in retaining customers. Many conceptualizations of Image have been advanced in the past, and it can be viewed as the customers overall impression about the bank.
The exact relationship between Image and Loyalty as still remained a matter of debate.
Switching Costs can be conceptualized as the monetary costs, time and psychological effort generated from the uncertainty of doing business with a new service provider.
These aspects can significantly also affect bank Loyalty.
Given the fact that banks invest billions in the internet infrastructure, customer satisfaction and customer Loyalty are increasingly developing into key success factors in E-banking. Most important, a profitable bank portal requires a strong
Switching Costs LOYALTY Customer Satisfacton Perceived Service Image
existing ones, since the acquisition costs in online banking exceed that of traditional offline business. Consequently, establishing long-term customer relationships is a prerequisite for generating positive customer value on the Internet.
One of the purposes of this investigation is also to analyze Bank Loyalty in an online environment.
Many investigations have been analyzing the adoption of online banking and the major determinants of E-banking Loyalty, but few were the studies which analyzed these issues for business customers.
Many definitions about the concept of E-Banking Loyalty presented in previous studies have similarities with those in an offline context. For that repeat purchasing and recommendation of the service provided by the online bank to other customers, are often part of the definition.
The most frequent determinants of E-banking Loyalty analyzed in previous studies are: E-Banking Perceived Quality, E-satisfaction, E-Trust, Image and Perceived Switching Costs (Figure A 2).
Figure A 2- Determinants of E-Banking Loyalty
Source: own elaboration
Measuring the quality of Web sites enables banks to take corrective actions, develop an appropriate e-business strategy, and improve their operations. In order to enhance customer Loyalty, portals are required to put a strong emphasis on their customer’s quality demands which are steadily increasing over time due to the growing competition in the Internet banking industry. E- Banking Service Quality is incorporated in our structural models because is an important determinant of Loyalty to the bank Web site.
E-TRUST E-LOYALTY E-SATISFACTION E- QUALITY IMAGE SWITCHING COSTS
A number of studies have theoretically and empirically investigated satisfaction in the traditional banking service context. Customer satisfaction with an organization’s products or services is often perceived as the key to an organization’s success and long-term competitiveness. Many authors mentioned that customer’s satisfaction is influenced by two factors, namely experience and expectations with service performance. If the service matches the customers’ expectations, the customers are satisfied. On the other hand, if the service is below their expectations, customers are dissatisfied and if the gap between their expectations and actual experience is wide, customers are likely to communicate negative word-of-mouth or in worst cases, customers never return to the organization. These are reasons as to why service organizations today are aiming for customer satisfaction as increased customer satisfaction leads to favorable word-of-mouth, customer retention and customer Loyalty. Empirical research examining the effects of service quality and satisfaction on behavioral intentions of customers in the internet banking settings however remains inadequate, especially in the business banking segment.
Trust is an important antecedent in most models dealing with relationships that include Loyalty, and it has been identified as key to e-commerce, because it is crucial wherever risk, uncertainty, and interdependence exist. The lack of customers trust, both in the attribute of the bank and in the overall on-line environment has been an obstacle in the widespread adoption of e-banking. Customers trust in e-banking can be defined as the willingness of customers to perform on-line banking transactions, expecting that the bank will fulfill its obligations, irrespective of their ability to monitor or control banks actions.
Possessing a good Image is essential for Internet banking to be perceived as a reliable means of transaction thus becoming a satisfactory option for the customer. In an increasingly competitive market such as the banking sector, it is necessary for the management of financial institutions, to be fully aware of the corporate Image they are transmitting, as well as the Image they are attempting to transmit, in order to administer it as effectively and efficiently as possible through their marketing strategy.
This research also included Perceived Switching Costs as an antecedent of Loyalty. They can be conceptualized as the costs involved in changing from one service provider to another. In banking, customers perceive negative consequences if they switch service providers, related with financial consequences and uncertainty. Few were the investigations about the existence of switching costs in E-banking, especially for corporate customers.
There is a strong inclination in business banking towards the fact that the personal relationships generated between the bank manager and the decision maker of the company is the preferable mean trough which interactions occur. Despite the fast growing of internet banking, the technology has not replaced
customers become more satisfied with technological means of interaction , the importance they attach to personalized interaction increases. This means that bank managers should implement a strategy that determines an appropriate balance between personal and remote interaction, instead of trying to replace traditional means of interaction to technological one´s.
These problems have been investigated in many previous researches for private customers and small companies, but few researches investigated these issues for medium and large companies.
Despite the few large companies in Portugal, they are responsible for 42% of the total turnover, and previous studies found that the bigger companies work in average, with more than 5 banks. This means that these big volume bank customers require complex banking needs and also provide the greatest profit opportunities to the bank and is a great challenge for bank managers to develop strategies to ensure customer loyalty.
This investigation is structured in six chapters. The first chapter presents the Portuguese banking sector. It develops an overview of the financial sector and some statistics about business banking and online banking in the country. The main purpose of the second chapter is to present some literature review about the concept of Loyalty and the influence of Perceived Service Quality on the determination of Loyalty. One major purpose is also to determine the dimensions of Perceived Service Quality in business banking and to measure the impact of this variable on Loyalty.
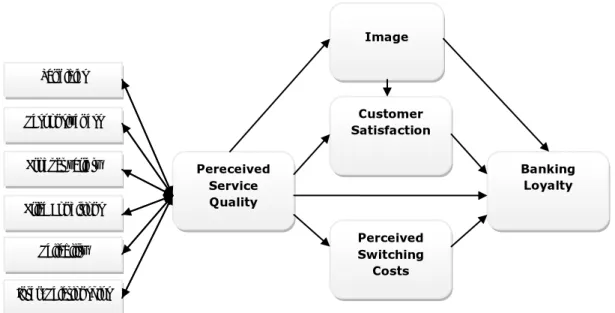
The aim of the third chapter is to analyze the main determinants of Bank Loyalty for business customers. We present a literature review about the main antecedents of loyalty on a business-to customer and business-to-business market and we propose a Structural Equation Model which presents the interrelations between the constructs Perceived Service Quality, Satisfaction, Image, Perceived Switching Costs and Bank Loyalty.
In the fourth chapter is introduced the concept of Loyalty in online banking. An overview of the literature review in an online environment is presented.
It was presented a model which determines the main dimensions of Perceived Service quality and their influence on the Loyalty to the bank website.
The fifth chapter proposes a Structural Equation Model for the determinants of E-Banking Loyalty, which includes the constructs E-Banking Service Quality, Trust, Satisfaction, Image, and Perceived Switching Costs.
The main purpose of this sixth chapter is to analyze the importance of the generated personal relationships and the perceived service quality in the traditional banking that may influence the perception of Perceived Service Quality and Loyalty to the bank website.
chapter i
the Banking sector in
portugal
1.the Banking sector in portugal
1.1Introduction
In 2008, the financial situation of the Portuguese economy was strongly conditioned by the crisis in the international financial markets, and by its growing interaction with global economic activity. In fact, after a long period characterized by growing financial integration of the Portuguese economy, translated by very substantial financial flows with the rest of the world, there was since the second half of 2007 a gradual reduction in the intensity of these flows, i.e., smaller increases both in external liabilities and external assets (Annual Report, 2008, Banco de Portugal). According to the Financial Stability Report 2008, published by the Banco de Portugal, the Portuguese economy is small and highly integrated in economic and financial terms, and the international turmoil changed dramatically the operational environment of the country’s banks. The impact was felt fundamentally in access to funds in the international wholesale markets as turbulence took its hold. In addition, substantial losses drained value from the securities and financial asset portfolio, even though Portuguese banks were not directly exposed to the assets related with the US subprime market. The focus here was the slide in shares. Despite this, Portuguese banks have demonstrated a notable capacity to adapt to a particularly unfavorable climate, having benefited from the government measures to shore up the financial system and from the changes to the regulatory framework of the Euro system monetary policy. In October, in concerted action with the authorities of countries across Europe and other advanced economies, the Portuguese government announced state guarantees to debt securities issues in Euros placed on the market by the country’s banks. Some banks took advantage of the facility towards the end of the year and at the start of 2009. Nonetheless, it has still been possible for the banks to issue non-guaranteed debt, particularly in the first quarter of 2009. Against this backdrop, one of the country’s banks, the BPN, was nationalized and another, the BPP, found itself mired in problems relating to the demarcation between its asset management operations on behalf of customers and its activity in drawing in deposits, covering a considerable part of the contracts it had with its customers. According to the Annual Report of Banco de Portugal the Portuguese economy recorded a strong recession in 2009, in a context marked by the deepest and most synchronized international recession of the post-war period. In fact, the growing and successive interaction between several economic and financial negative shocks at a global level culminated in an abrupt increase in risk aversion and in uncertainty at the end of 2008, which implied substantial falls in trade flows and in activity in the advanced, emerging
governments of several countries adopted unprecedented policy measures that limited the potential systemic risks associated with that interaction, and which contributed to stimulate economic activity. Thus, from the second quarter of 2009 onwards, the conditions in international financial markets improved significantly and there was acceleration in worldwide economic activity, even though at different speeds across regions. The evolution of the Portuguese economy reflected directly these developments, given its strong economic and financial integration.The generalized economic recovery contributed to decrease the risks regarding global financial stability throughout 2009. However, the uncertainty on the international economic outlook remains high. In fact, the need for an adjustment in financial systems, in public accounts and in the economic agents’ balance sheets will tend to condition the economic dynamism in the short and medium term. Additionally, at the end of 2009 and beginning of 2010, there was an increase in sovereign risk in several economies - with prominence to some euro area countries, including Portugal - motivated by significant and non-anticipated increases in public deficits and in public debt levels, combined with the maintenance of several additional structural fragilities.
1.2 The Portuguese financial system
According to the RGICSF (Regime Geral das Instituições de Crédito e Sociedades Financeiras), approved by Decree-Law No. 298/92 of 31 December, the Portuguese financial system is composed by credit institutions and financial companies. A credit institution is an undertaking whose business is to receive deposits or other repayable funds from the public and to grant credits for its own account .A credit institution is also an undertaking which issues means of payment in the form of electronic money (see Figure 1.2.).
A financial company is an undertaking other than a credit institution, whose principal activity is to carry on one or more of the activities except for financial leasing and factoring.
The article 4 of the Decree-Law is referred to the activities that banks can carry on: Acceptance of deposits or other repayable funds; Lending, including the granting of guarantees and other commitments, financial leasing, and factoring; Money transmission services; Insurance and administration of means of payment, e.g. credit cards, traveler’s cheques and bankers drafts; Trading for own account or for account of clients in Money market instruments, foreign exchange, financial futures and options, exchange or interest-rate instruments, goods and transferable securities; Participation in securities issues and placement and provision of related services; Money broking; Portfolio management and advice, safekeeping and administration of securities; Management and management consultancy in relation to the assets; Advice to
well as advice and services relating to mergers and purchase of undertakings; Dealings in precious metals and stones; Acquisition of holdings in companies; Trading in insurance policies; Credit reference services; Safe custody services; Leasing of movable property, under the terms allowed to financial leasing companies and other credit institutions may only carry out those transactions permitted by the laws and regulations governing their activity. A financial company is an undertaking other than a credit institution, whose principal activity is to carry on one or more of the activities referred to in Article 4 except for financial leasing and factoring.
Figure 1. 1- The Portuguese Financial System
Source: Martins (2005 Portuguese Financial System Bank of Portugal CMVM Finance Minestery Types of financial institutions Credit institutions Financial companies Investment companies Other Banks Caixas económicas (savings banks); Caixa Central de Crédito Agrícola Mútuo (central mutual agricultural credit bank) and caixas de crédito agrícola mútuo
(mutual agricultural credit banks);
Credit financial institutions; Investment companies; Financial leasing companies;
Factoring companies; Credit purchase financing companies; Mutual guarantee companies; Electronic money institutions; Other Dealers; Brokers; Foreign-exchange or money-market mediating companies; Investment fund management companies; Credit card issuing or management companies; Wealth management companies; Regional development companies; Exchange offices; Credit securitization fund management companies; Other companies classified as such by law.
1.3 Financial System Features
Financial intermediation in Portugal is dominated by the banking sector. While Portugal’s financial market depth is somewhat lower than the euro-area average, bank loans represent a larger source of financing for the private sector. Portuguese banks hold strategic stakes in other sectors of the economy, including the insurance sector. Foreign bank participation is relatively high as is state ownership through the Caixa Geral de Depósitos.
Although the banking market is somewhat concentrated, competitive conditions are robust. Financial liberalization and deregulation, and the creation of the European Monetary Union (EMU), helped bolster consolidation in the banking industry in Portugal. As a result, market concentration has increased. Nevertheless, a number of empirical studies suggest that competitive conditions in the Portuguese banking have remained strong.
In the next two tables we show the list of banks with activity in Portugal and some indicators.
Table 1. 1- List of banks with activity in Portugal
BANK NAME
ABN ABN AMRO BANK N.V.
ACTIVO BANK BANCO ACTIVOBANK (Portugal), S.A. BAC BANCO ESPÍRITO SANTO DOS AÇORES, S.A. BAI BANCO AFRICANO DE INVESTIMENTO EUROPA, S.A. BANCO BIC BANCO BIC PORTUGUÊS, S.A.
BANCO INVEST BANCO INVEST, S.A.
BANCO MAIS BANCO MAIS, S.A.
BANIF BANCO INTERNACIONAL DO FUNCHAL, S.A. BANIF INV BANIF - BANCO DE INVESTIMENTO, S.A.
BANIF SGPS BANIF - SGPS, S.A.
BARCLAYS BARCLAYS BANK PLC
BB BANCO DO BRASIL, S.A.
BBVA BANCO BILBAO VIZCAYA ARGENTARIA (Portugal) S.A. BCP BANCO COMERCIAL PORTUGUÊS, S.A. BCPI BCP INVESTIMENTO – BANCO COMERCIAL PORTUGUÊS
BES BANCO ESPÍRITO SANTO, S.A.
BESI BANCO ESPÍRITO SANTO DE INVESTIMENTO, S.A. BEST BEST - BANCO ELECTRÓNICO DE SERVIÇO TOTAL, S.A. BIG BANCO DE INVESTIMENTO GLOBAL. S.A. B I I BANCO DE INVESTIMENTO IMOBILIÁRIO, S.A.
BPG BANCO PORTUGUÊS DE GESTÃO BPI BANCO PORTUGUÊS DE INVESTIMENTO, S.A.
BANCO BPI BANCO BPI, S.A.
BSN BANCO SANTANDER DE NEGÓCIOS PORTUGAL, S.A.
BST BANCO SANTANDER TOTTA, S.A.
CAIXA GALÍCIA CAJA DE AHORROS DE GALÍCIA
CAIXA VIGO CAIXA DE AFORROS DE VIGO, OURENSE E PONTEVEDRA CBI CAIXA – BANCO DE INVESTIMENTO, S.A. CCCAM CAIXA - BANCO DE INVESTIMENTO, S.A.
CETELEM BANCO CETELEM, S.A.
CGD CAIXA GERAL DE DEPÓSITOS, S.A.
CREDIFIN BANCO DE CRÉDITO AO CONSUMO, S.A. DEUTSCHE BANK DEUTSCHE BANK - DEUTSCHE BANK (PORTUGAL), S.A.
FINANTIA BANCO FINANTIA, S.A.
FINIBANCO FINIBANCO S.A
FORTIS BANK FORTIS BANK
ITAÚ BANCO ITAÚ EUROPA, S.A.
MG CAIXA ECONÓMICA – MONTEPIO GERAL
POPULAR BANCO POPULAR PORTUGAL, S.A. SANTANDER CONSUMER BANCO SANTANDER CONSUMER PORTUGAL, S.A. SANTANDER TOTTA SGPS SANTANDER TOTTA SGPS
Source: Associação Portuguesa de Bancos (2009)
Table 1. 2- Main bank indicators of the Portuguese banks
ASSET CUSTOMER
CREDIT RESOURCES CAUGHT NET SITUATION NET INCOME
BANK VALUE VALUE VALUE VALUE VALUE
(thousand
€) Ranking (thousand €) Ranking (thousand €) Ranking (thousand €) Ranking (thousand €) Ranking CGD 118.181.417 1 79.050.448 1 62.046.975 1 6.528.582 1 227.423 4 BCP 93.786.471 2 77.785.121 2 44.852.968 2 6.391.995 2 147.480 5 BES 81.427.882 3 48.640.075 3 25.155.915 3 6.229.402 3 246.205 3 BST 50.191.372 4 28.986.402 6 16.014.295 6 1.923.343 6 249.692 2 SANTANDER TOTTA 46.595.851 5 33.068.961 4 16.038.679 5 3.062.908 4 277.956 1 BPIBANCO 43.531.830 6 29.489.771 5 24.642.794 4 2.133.558 5 89.009 6 MG 17.266.354 7 15.204.539 7 9.009.861 8 936.995 8 29.227 10 BANIFSGPS 13.038.623 8 10.826.798 8 6.721.021 10 851.728 9 15.738 15 CCCAM 11.671.869 9 8.531.835 10 9.630.551 7 1.001.930 7 28.941 11 BANIF 11.133.713 10 9.589.809 9 6.760.981 9 473.222 13 374 36 BARCLAYS 10.217.541 11 6.902.595 11 2.850.099 13 147.323 23 29.920 8 POPULAR 8.892.978 12 6.533.744 12 3.261.239 11 737.500 10 32.066 7
BBVA 7.009.150 13 5.890.459 13 3.132.430 12 244.869 16 9.087 17 BESI 5.311.943 14 1.795.106 18 705.903 17 479.439 12 22.470 13 BII 4.205.627 15 3.563.069 14 13 43 223.973 18 17.910 14 ITAU 4.061.994 16 1.143.635 21 14.113 37 587.596 11 85 38 FINANTIA 3.340.649 17 2.149.098 16 136.175 27 347.335 14 6.001 19 FINIBANCO, SGPS 3.056.014 18 2.545.153 15 2.164.771 15 214.364 19 206 37 BPI 3.035.370 19 125.962 34 2.663.930 14 57.894 30 3.471 27 DEUTSCHE BANK 2.780.329 20 1.798.280 17 517.522 18 115.877 26 3.791 25 BSN 2.136.707 21 79.896 36 771.315 16 89.749 28 5.951 20 CBI 1.827.225 22 889.992 23 121.799 28 232.843 17 24.825 12 BCPI 1.812.834 23 283.063 32 10 44 160.438 22 29.688 9 BNP PARIBAS 1.782.102 24 700.359 26 334.386 21 9.980 42 4.615 22 CETELEM 1.600.807 25 1.405.436 19 7.704 39 208.047 20 3.029 28 SANTANDER CONSUMER 1.304.727 26 1.295.638 20 3.242 41 122.414 24 3.688 26 FORTIS BANK 1.214.729 27 539.182 28 195.021 26 26.610 37 3.867 24 BANCO MAIS 1.081.443 28 990.464 22 2.520 42 249.513 15 14.571 16 BANIF INV 975.302 29 359.003 30 255.643 24 58.963 29 1.683 32 BAI 890.528 30 69.438 38 105.987 29 32.853 36 1.815 30 CAIXA VIGO 778.905 31 700.503 25 37.216 35 37.075 32 1.674 33 CAIXA GALICIA 778.025 32 743.791 24 87.372 30 -3.444 45 4.560 23 ABN 704.587 33 244.414 33 480.021 19 -1.529 44 -1.549 44 BIG 644.093 34 29.743 41 300.290 22 115.752 27 6.573 18 COFINOGA, SGPS 641.364 35 654.539 27 7.704 38 119.184 25 -158 39 BANCO INVEST 568.458 36 314.762 31 71.818 32 51.858 31 5.190 21 BEST 510.975 37 48.672 39 450.359 20 23.086 40 2.638 29
Source: Associação Portuguesa de Bancos (2009)
1.4 Business Banking in Portugal
Micro, small and average companies (PME) are widely recognized as the pillar of the national economy, being the main responsible for the creation of job in Portugal. According to the classification of the Recommendation of the European Commission, PMEs are the companies with less than 250 employees, whose annual turnover does not exceed 50 million euro’s or whose annual liquid total asset does not exceed 43 million euro’s. This definition is applied to micro, small and average dimension companies. The small companies are distinguished from the averages for having less than 50 workers and an annual turnover (or liquid total asset) that doesn´t exceeds 10 million euro’s. The micro companies are distinguished from the small ones for having less than 10 workers and an annual turnover (or liquid total asset) that doesn´t exceeds 2 million euro’s.
According to INE (2008), in Portugal there are 349 756 PMEs, representing 99.7% of the Portuguese not financial companies. The micro companies have a preponderant role weighing 85.6% in the total of companies, this reflects a Portuguese enterprise environment constituted mainly by companies with less than 10 workers and an annual turnover (or total asset) not superior to 2 million euro’s.
The PMEs have been also the main responsible for the job assured in the Portuguese economy (72.5%), although the larger companies are responsible for 27, 5% of the creation of jobs (despite only representing 0.3% of the companies). In average each PME uses 6, 2 workers whereas large companies have 741, 4 employees.
The PME annual turnover in 2008 went up to around the 201 765 million euro’s, about 58% of the total companies’ turnover, as we can see in Figure 1.2.
Despite the fact of a low percentage of large companies in Portugal they are responsible for a big percentage of the turnover generated in the country, 146787 million euro’s, for about 42, 1% of the total turnover.
Figure 1. 2- Companies annual turnover-2008
Source: INE (2010)
There are differences between the nature of the relationship between a bank an it´s business customers depending on the size of the customers business, as companies grow, their financial needs increase in complexity as does their bargaining power in the bank customer relationship (O´Donnel et al., 2002). In a study conducted by Farinha, L. (1999, Banco de Portugal) the number of banks per firm varied according to firm size (see Figure 1.3). The average number of banks is 1.4 for very small firms (with less than 10 employees) and 5 for those with over 200 workers. Most of the latter borrow from 4 banks.
0 50000000 100000000 150000000
Micro Small Medium Large
52858521
73453427 75453437
The same firm can also change its behavior over time. The number of banks seems to reflect firm age as well, though contrasts are not as sharp between age classes as they are between the analyzed size classes. Firms aged 2 years or less borrow on average from 1.4 banks, while firms older than 20 years resort to 2.5 banks. The bulk of firms with 10 years or less relate to only one bank .Over 70 per cent of very small firms have only one bank, while this percentage is marginally higher than 10 per cent for firms with 200 or more workers.
This study concludes that firms borrow for the first time from a single bank, but soon afterwards some of them start borrowing from two or more banks simultaneously. These results suggest that firms explore the advantages of an exclusive relationship with one bank, but also take into account that the resulting information monopoly of the single informed bank may result in income losses to firms.
Figure 1. 3—N. of banks used according to firm size
Source: Banco de Portugal (1999)
Banks can´t build the same strategy for small and for bigger companies because these big volume bank customers require complex banking needs and also provide the greatest profit opportunities to the bank.
1.5 E-Banking in Portugal
According to a study conducted by the Deutche Bank (2008) an ever increasing number of Europeans access banking services over the internet. The share of online banking customers in the EU-15 increased from 19% in 2003 to 29% in
0 0,5 1 1,5 2 2,5 3 3,5 4 4,5 5 < 10 10 to 49 50 to 99 100 to 199 >=200 1,4 2,1 3 3,8 5 M ean
adoption rate of 50-60% in the EU-15 by 2020 – a level already reached in Sweden.
In the second quarter of 2008, individuals aged 16-74 in the EU Member States were asked which activities they had carried out on the internet in the previous three months. In the EU27, nearly a third of all individuals had used internet for travel and accommodation services. Around 30% had used internet banking, interacted with public authorities or searched for health-related information. About a quarter had read online news or ordered goods or services. Around 15% had looked for jobs or sent applications by internet.
Figure 1. 4- Use of Internet banking in the EU 27 (%)
Source: DBReseach, Eurostat, ICT Statistics (2008)
According to the 2008 report of the European Commission on the i2010 initiative for the Information Society, recently published, Portugal has one of the best positions in the European Union (EU) on eBusiness and eCommerce, integrating the group of 5 EU countries that, taking into account all the 10 indicators considered for these areas, are in the best positions. Besides Portugal, this group includes Belgium, Denmark, Netherlands and Austria.
In a previous study made by the INE (2009) in the first trimester of 2009, 9.7%
29 1 14 61 38 55 28 5 20 40 13 11 39 27 48 13 25 69 34 17 14 2 21 24 72 65 38 75 13 0 10 20 30 40 50 60 70 80 EU 27* BG CZ DK DE EE IE EL ES FR IT CY LV LT LU UH MT NL AT PL PT RO SI SK FI SE UK NO HR % of all individuals
Internet, corresponding 20.9% of the individuals that use Internet (Figure 1.5).The ratio of individuals that have made orders thought Internet has come to increase in last 5 years.
Figure 1. 5- Individuals that made orders through the Internet (%)
Source: INE (2009)
Since 2005, the number of individuals that made online orders has registered an annual average growth of 27, 6%.
The reasons not to order in the internet were: in first place, nine in each ten individual’s point that they never made orders because they prefer the personal contact with the salesman and the product, and also because they “did not have necessity”. In Table 1.3 we present the results of this study.
Table 1. 3- Reasons not to order in the Internet
REAZON %
Have no need 67,1
Prefer the personal contact with the salesman or product 90 Force of habit or loyalty to the usual supplier 69,1 Difficulty in finding in the websites excellent information of the goods or services 14
Problems with the delivery 14,3
Not availability of some goods or services in the Internet 8,8
Problems of privacy 53,1
Problems related with the reception or devolution of goods, concerns with claims or complaints 42,2 Does not have credit card or debit to make online payments 11,3
Speed to the linking 5,2
Doesn’t know how to use the Internet or is not prepared 22,2
Others 3,4 Source: INE (2009) 2005 2006 2007 2008 2009 3,7 4,7 5,8 6,4 9,7
The big percentage of investors with an on-line account for more than 2 years (57.1% of the investors-see figure 1.6) is revealing of the interest excited soon of beginning for the brokerage on-line. However, this initial enthusiasm has decelerated in the past most recent. The inquiry disclosed that 20.7% of the investors on-line had affirmed to have an account on-line for less than 2 years, but for more than one year, and only 11.3% had adhered recently to this new functionality.
Figure 1. 6- Antiquity of the online account
Source: CMVM (2005)
The data of the inquiry confirm the existence of a customer loyalty in relation to the financial intermediate. In fact, about 68, 9% affirmed never had changed of financial institution on-line and those that have made it, have moved relatively little time ago (Figure 1.7).
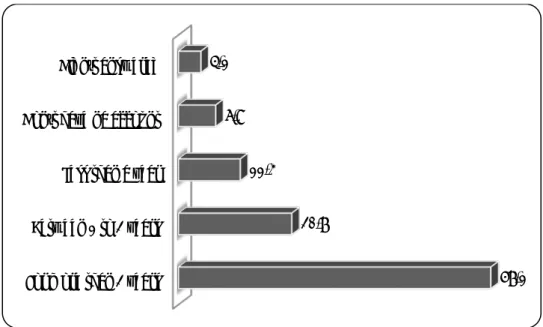
The figure 1.8 informs which are the main reasons pointed with respect to the change of financial institution on-line. In first place the “Costs/Prices” appears (41.9%), following it “quality of the service (attendance, organization, access, etc.)” (11.8%).
The medium/large corporate bank customers have been neglected in many previous studies about Internet Banking, particularly about loyalty of this important and profitable bank segment.
For more than 2 years Between 1 to 2 years Less than a year Don´t have na account Didn´t answered 57,1 20,7 11,3 6,8 4,1
Figure 1. 7-Loyalty to the on-line financial institution
Source: CMVM (2005)
Figure 1. 8- Motives for changing the online financial institution
Source: CMVM (2005)
0 10 20 30 40 50 60 70
Didn´t yes, changed for more than 24 month´s yes, changed for more than 18 month´s and less …
yes,changed for more than 12 month´s and less … yes,changed for more than 6 month´s and less … yes, have changed for less than 6 month´s
Didn´t answered 0 5 10 15 20 25 30 35 40 45
1.6 References
1. Annual Report (2008), Banco de Portugal; 2. Annual Report (2009), Banco de Portugal; 3. Associação Portuguesa de Bancos (2009);
4. CMVM (2005), “2.º Inquérito sobre o Perfil do Investidor Português On-Line”;
5. DBReseach (2008), “Online Banking: The young and well educated extend their lead until 2010;
6. Farinha, L. (1999), “The relationships between firms and bank: Choosing between single and multiple Bank Relationships”, Banco de Portugal, Economic Bulletin;
7. Instituto Nacional de Estatística (2010), “Estudos sobre estatísticas estruturais das empresas”;
8. Martins, E. (2006), “Marketing Relacional na Banca A fidelização e a venda cruzada”, Vida Económica, Porto;
9. O´ Donnel, A. : Durkin, M. and McCartan- Quinn, D. (2002); “Corporate Banking in the U. K: personal vs remote interaction, International Journal of Bank Marketing, 20 (6), pp. 273-284;
10. Regime Geral das Instituições de Crédito e Sociedades Financeiras), approved by Decree-Law No. 298/92 of 31 December;
chapter ii
the importance oF perceiveD
service Quality on Banking
loyalty For Business customers
2.the importance oF perceiveD service Quality on Banking
loyalty For Business customers
2.1 Introduction
Service providers are increasingly concerned to develop and maintain customer loyalty as they are aware that loyalty leads to increased and guaranteed income and is a key determinant of market share and profitability (Meidan, 1996). A loyal customer base enables companies to reduce costs, both operational and marketing, to attract new customers, and can also both employee’s morale and productivity. Further loyalty can also boost employee’s moral and productivity. Further, loyalty can lead to price indifference, favourable word of mouth communication, endorsements and customer referrals, cross sales and resistance to competition (Lewis and Soureli, 2006).
Given the claimed benefits for business of loyal customers, it is not surprising that many businesses have invested substantial amounts in developing customer retention and cross-selling programmes in an attempt to retain customers and to obtain a higher percentage of their business.
In most of the previous investigations Perceived Service quality is viewed as the most important antecedent of loyalty. Parasuraman et al. (1985), among others defined service quality as a function of the ability to perform the promised service dependably and accurately, the willingness to help customers and provide prompt service, the knowledge and courtesy of employees and their ability to inspire trust and confidence, the individualized attention the fir provides its customers and the physical facilities, equipment, and appearance of personal. (Lewis and Soureli, 2006).
The major investigations analyse the dimensions of perceived service quality for private customers, and for the segment of small companies, few were the studies who analysed this issues for business banking customers, especially for large companies.
The present investigation aims to identify and access the dimensions of Perceived Service Quality and his influence on Banking Loyalty for business customers. A resume of research literature is offered, relating to the understanding of customer Loyalty, and previous investigations in financial services, and in particular those that focus on the determinants of Perceived Service Quality.
2.2 The concept of service loyalty
Although loyalty to tangible goods has been studied extensively by marketing scholars, relatively little theoretical or empirical research has examined loyalty to service organizations (Gremler and Brown, 1998).
The review of the literature leads us to analyse five research perspectives of the components of service quality: behaviour, attitudinal loyalty, cognitive and repurchase intent.
2.2.1 Behavioural perspective
In consumer research conducted in the 1960s and 1970s, customer loyalty was approached predominantly from a behavioural perspective.
Behavioural definitions are based on the amount of purchases for a particular brand (Bass, 1974; Tranberg and Hansen, 1986).
Jacoby and Chesnut (1978) observe that in some studies the focus was on interpreting patterns of repeat purchasing in primarily panel data as a manifestation of loyalty.
Consumer’s disposition to rebuy is an essential element of loyalty (Gremler and Brown, 1996).
While behaviour can be measured in number of ways, Jones and Sasser (1995), have argued that share of wallet is a key indicator of loyalty and stated that “the ultimate measure of loyalty, is share of purchases in the category”.
Critics of behavioural definitions point out that no explanation of the choices made by consumers is sought by this limited definition of loyalty. Behavioural measures simply estimate frequencies with no examination of the reasons for purchases or the factors that may influence choices (Dick and Basu, 1994). Behavioural measures are insufficient to explain how and why brand loyalty is developed and/or modified, high repeat purchase may reflect situational constraints, such as brands stocked by retailers, whereas low repeat purchase may simply indicate different usage situations, variety seeking, or lack of brand preference within a buying unit. It is clear that behaviour is insufficient as a measure of store or brand loyalty, as a result, the extent to which behavioural measures are of benefit in developing long-term loyalty strategies is clearly questionable (O´Malley, 1998).
2.2.2 Attitudinal perspective
To overcome the limitations of behavioural definitions, many researchers have defined loyalty by including attitudinal measures (Day, 1969).
Attitude denotes the degree to which a customer’s disposition towards a service is favourable inclined (Azjen and Fishbein, 1980).
This is reflected in the willingness to recommend a service provider to other consumers or the commitment to repatronize a preferred service provider (Gremler and Brown, 1996; Jain et al., 1987; Pritchard, 1991).
Based on a favourable attitude towards a service provider, customers may develop preference loyalty (Ruyter et al., 1997).
This approach also sees a loyal customer as attached to a brand, and when their positive beliefs are reinforced, these customers are said to buy a brand more often (Riley et al., 1997).
2.2.3 Cognitive perspective
In addition to attitude, it has been argued that the loyalty may also be based on cognition (Lee and Zeiss, 1980; Oliver, 1996).
Berger and Mitchell (1989) showed that the degree to which consumers are exposed to advertising increases the ability and confidence to process information, providing more opportunity for product related elaboration resulting in product commitment. Customer loyalty is frequently operationalised as a conscientious evaluation of the price /quality ratio or the willingness to pay a premium price, or alternative price indifference (Fornell, 1992); Olson and Jacoby, 1971).
2.2.4 Repurchase intent
This final component of service loyalty is often used as the primary measure of service loyalty (Fornell, 1992; Rust and Zahorik, 1993; Selnes, 1993; Zeithaml et al., 1996). Including repurchase intent as a separate component of service loyalty seems justified, as it is not well understood how predictive repurchase intent of actual purchase behaviour (Anderson and Fornell 1994; Gremler and Brown, 1998).
2.2.5 Mixed perspectives
Ganesh et al.(2000) found two factors in their loyalty items, active loyalty (Word of mouth and intention to use) and passive loyalty (not switching even under less positive conditions). Other authors have considered loyalty as a process rather than an outcome (Ball et al., 2004). Oliver (1997), for example distinguishes among four stages of loyalty: cognitive, affective, conative and action loyalty.
Gremler and Brown (1998), also suggests that affective loyalty and cognitive loyalty precede repurchase intent, and that repurchase intent influences behaviour.
Dick and Basu (1994) have developed a framework for customer loyalty that combines both attitudinal and behavioural measures. These authors propose that loyalty is determined by a combination of repeat purchase levels and relative attitude. Relative attitude is determined by attitude strength and attitudinal differentiation
This is a particular useful model because not only does it offer more accurate measures of loyalty, but it also results in a number of different categories of loyalty, each of which have clear managerial implications (see Table 2.1. ). They use two dimensions or measures for loyalty:
- Relative attitude: not only focuses on attitude to the entity, but also incorporates attitudes to alternatives. This encapsulates not only satisfaction measures, but also preference measures. The suggestion is that the higher the relative attitude between alternatives, the more likely that attitude will influence behaviour.
- Patronage behaviour: This includes traditional measures such as regency, frequency and monetary value of purchases, share of wallet, purchase sequence, etc.
Sustainable loyalty, with its high repeat patronage and high relative attitude, would obviously be the ultimate goal for marketers. Raj (1985) found that firms with large market shares also have larger groups of loyal customers. Loyal customers are less motivated to search for alternatives, are more resistant to counter – persuasion from other brands, and are more likely to pass along positive worth- of- mouth communication about the service to other consumers. Marketers with loyal customers can expect repeat patronage to remain high until competitors find a way to close the gap in attitude among brands. Competition can close the gap in three main ways:
- try to reduce the differential advantage of the leading brand; - increase the differentiation of their own brand, or;
- Encourage spurious loyalty from customers.
Combining the two dimensions of loyalty, we can identify four categories of loyalty:
1. No loyalty exists in a category when consumers see few differences between alternative brands and there are low repeat purchases. Brand switching is common and choice among brands is usually made based on some situational factor, such as the brand that is n on sale or that is noticed in an end-of-aisle display;
2. Spurious loyalty occurs when a consumer frequently purchases a brand, but sees no significant differences among brands. This could occur if there were no alternatives in a category or if choice is made strictly on past experiences and habits. As a result the consumer may only temporarily display such loyalty, and is likely to be very open to competing offers, that is f another product comes along that is for some reason easier to buy ( e.g. it I cheaper or the original product is out of stock), the consumer will not hesitate to do so (O’Malley, 1998). As a result it is relatively easy to encourage switching behaviour in markets typified by spurious loyalty. In order to defend a customer base against competitive attacks managers can attempt to maintain spurious loyalty and/ or develop sustainable loyalty. However, one problem associated with simply maintaining spurious loyalty is that the company may become involved in a continual spiral of promotions, because, once, the incentives is taken away, customers have lost their primary reason for purchase ( Dowling and Uncles, 1997).
3. Latent loyalty, exists when a consumer has a strong preference for or attitude toward a company’s brand over its competitors brands, but does not exhibit high repeat patronage due to some situational or environmental variable. This is due for instance inconvenient store locations, out-of stock situations, and or influence of other people. Managerial efforts are best focused on removing the obstacles to patronage, for example by extending the branch network.
4. Sustainable loyalty, with its high repeat patronage and high relative attitude, would obviously be the ultimate goal for marketers. Raj (1985) found that firms with large market shares also have larger groups of loyal customers. Loyal customers are less motivated to search for alternatives, are more resistant to counter – persuasion from other brands, and are more likely to pass along positive worth- of- mouth communication about the service to other consumers. Marketers with loyal customers can expect repeat patronage to remain high until competitors find a way to close the gap in attitude among brands. Competition can close the gap in three main ways:
- try to reduce the differential advantage of the leading brand; - increase the differentiation of their own brand, or;
Table 2. 1- Categories of loyalty
Category No loyalty Spurious loyalty Latent loyalty Sustainable loyalty
Relative attitude low Low high high
Patronage behaviour
low repeat High repeat Low repeat High repeat
Manifestation
Does not patronize the company, and does not wish to
Patronizes the company but does not have a high relative attitude. This may be as a result of other factors, including location convenience, lack of alternatives. The customer wishes to patronize the organization, but perhaps is not able to do so-store location may be inconvenient, favourite brands not stoked, etc.
The individual enjoys a high relative attitude together with high repeat patronage behaviour. Implications Management may attempt to generate “spurious loyalty” “Spurious loyalty” cannot be relied on. The customer is clearly open to better offers Managerial efforts are best focused on removing the obstacles to patronage for the customer Loyalty must be continually reinforced, and the value offered must remain acceptable.
Source: Dick and Basu, 1994
2.3 Brand loyalty
A common question raised by marketers is how brand and service loyalty are different. Researchers have provided some insights to this question. In an analysis of how consumers evaluate products and services, Zeithaml (1981) included a discussion of the differences in loyalty that exist between goods and services. Some of the main determinants of brand loyalty of products and services are:
- Social ties to the company;
- Availability of substitutes, and;
- The costs of changing brands (Switching costs).
Because it may be more costly to change brands of services, because awareness of substitutes is limited, and because higher risks may accompany services, consumers are more likely to remain customers of particular companies with services than with goods.
The difficulty of obtaining information about substitutes, means that consumers may be unaware of alternatives to increase satisfaction aver present brands. If consumers perceive greater risks with services, they probably depend on brand names to a greater extent than when they purchase products. Brand loyalty, described as a means of economizing decision effort by substituting habit for repeat, deliberate decision, functions as a device for reducing the risk of consumers decision (Zeithaml, et al., 2006).
The difficulty in evaluating quality of services makes switching brands of service less likely as customers become familiar with one service. Since there is also an inseparability of provider and customer in many service settings, consumers may be less likely to switch after they have developed a relationship with a service provider (Javalgi and Moberg, 1997).
Since services are intangible and heterogeneous, most consumers will perceive higher risk in services than goods. As perceived risk increases, the likelihood of loyalty to one brand increases (Cunningham, 1966). The intangibility of services makes the evaluation of service quality and satisfaction more difficult than it is for goods, which means consumers often depend on credence qualities to evaluate services (Zeithaml, 1981). In addition, intangibility makes it more difficult to gather information about services. This makes information about services more expensive, and may lead to consumers having less information about services than about goods.
A final reason that consumers may be more loyal with services is the recognition of the need for repeated patronage in order to obtain optimum satisfaction from the seller. Becoming a “regular customer” allows the seller to gain knowledge of the customer’s tastes and preferences, ensures better treatment, and encourages more interest in the consumer’s satisfaction. Thus a consumer may exhibit brand loyalty to cultivate a satisfying relationship with the seller (Zeithaml et al., 2006).
2.4 The importance of loyalty
The importance of loyalty has been widely recognized in the marketing literature (Oliver, 1999; Samuelson and Sandvik, 1997; Howard and Sheth, 1969).
Reichheld and Sasser (1990) have studied the impact on profits of having a loyal customer base; they calculated the impact of customer retention on profitability: “As a customer’s relationship with the company lengthens, profits rise. And not just a little. Companies can boost profits by almost 100 per cent by retaining just 5 per cent more of their customers” (Reichheld and Sasser, 1990), Reduced to pounds, shillings and pence in this way the business world began to focus aggressively on customer retention. The aim was to reduce marketing’s “scrap heap” (customers who defect) and, thus, enhance profitability. This renewed focus on customer retention is generally referred to as loyalty marketing, and is increasingly reliant on a customer database and direct communication (O´Malley, 1998).
Aaker (1991) has discussed the role of loyalty in the brand-equity process, observing that brand loyalty reduces marketing costs and that the relative costs of customer retention are substantially less than those of acquisition.
Fornell and Wernerfelt (1987), have claimed that the costs of customer acquisition, and loyal customers, if served correctly, are said to generate increasingly more profits each year that they stay with a company (Reichheld, 1994), though other authors have pointed out that loyal customers are not always profitable (Dowling and Uncles, 1997).
Gremler, Gwinner and Bitner (1997) also distinguish two sets of consequences that can result from establishment of loyal customer relationships: outcomes for customers and outcomes for providers. For customers they identified four consequences: social, psychological, economic and customization outcomes. For service providers, in addition to the economic outcomes they receive from cultivating loyalty amongst their customers, various customer behaviours (e.g. low customer turnover, generation business for a firm via word-of mouth recommendation, and receptivity to new service offerings) and human resource outcomes (e.g. in the areas of employee attitudes, job satisfaction and commitment, and productivity) can also result.
The loyalty ripple effect (Gremler and Brown, 1999) for service firms has also been analysed by many authors and it’s anchored around three key concepts: value of a customer, service loyalty, and word-of-mouth communications;
Value of a customer: firms have increased their efforts to retain customers for various reasons, but most often the reasons relate to the customers' direct value to the company;
Service Loyalty: loyal customers can lead to increased revenues for the firm (Reichheld, 1993, 1996; Schlesinger and Heskett, 1991), result in predictable sales and profit streams (Aaker, 1992), and these customers are more likely to purchase additional goods and services (Clark and Payne, 1994; Heskett et al., 1997; Reichheld, 1996). Yet, to more accurately assess the full value of a loyal customer, we believe firms must look beyond the influence of these direct measures. That is, firms should look beyond direct revenue streams and include the value of all the benefits associated with possessing a loyal customer (Zeithaml and Bitner, 1996);
Word-of-mouth communications: one particularly salient benefit, especially for service organizations, is word-of-mouth (WOM) communication - loyal customers often generate new business via WOM recommendations to prospective and other existing customers of the firm (Reichheld, 1996; Reichheld and Sasser, 1990; Schlesinger and Heskett, 1991; Zeithaml et al., 1996). That is, the recommendations made by a loyal customer, especially those helping to generate new customers, add to the value that core customer brings to the firm.
Given the claimed benefits for business of loyal customers, it is not surprising that many businesses have invested substantial amounts in developing customer retention and cross-selling programmes in an attempt to retain customers and to obtain a higher percentage of their business. 2.5 Obstacles to Loyalty
Oliver (1999) identified two obstacles to the maintenance of a loyalty customer base:
Consumer idiosyncrasies. The fact that the consumers have a great variety of offerings for the same type of product/service. Variety seeking is a trait that will not permit loyalty to develop until is no variety to sample. This will be particularly true at the cognitive level. Other reasons for apparent consumer disloyalty also include multibrand loyalty, withdrawal from the product category and changes in need. This can occur in two forms: the first, the first the consumer matures, and new needs supplant the old, in the second form, a competitive innovation fulfils the consumer’s needs more efficiently, or so it may seem.
Switching incentives. Competitors can persuade consumers with
messages and incentives with the purpose of attempting to lure them from their preferred offering.
2.6 Loyalty Programmes
Loyalty programmes are developed for a variety of reasons including to reward loyal customers, to generate information, to manipulate consumer behaviour and as a defensive measure to combat a competing scheme (O´Malley, 1998):
Reward loyalty customers: this is achieved through a combination of discounts and other rewards. Consumers are motivated to participate in such schemes because; most people like to get something for nothing. To generate information: knowing who the best customers are, what
they buy and how often provide a secret weapon. This information can be used to improve targeting, create offers and shift merchandise.
Manipulate customer behaviour: the fundamental aim of most schemes is to manipulate consumer behaviour within a sophisticated system, where incentives and coupons can be individually targeted, in order to encourage customers to try new products or brands.
As a defensive measure to combat a competing scheme: in practice the decision to launch a programme is often motivated s much by fears of competitive parity as anything else.
2.7 The concept of Banking Loyalty
Loyalty in financial services has been viewed in relation to the length of time a customer has been with a provider, number of services used and frequency of service use. A definition of the term which incorporates all the dimensions that have been found in the literature should include long –term intentional repurchase of services, high degree of customer preference, customer’s recommendations and advocacy, customers price indifference , low like wood of switching and high potential of increasing volume of product use. Thus a combination of cognitive, affective, conative and behavioural loyalty (Lewis and Sourely, 2006).
Meidan (1996) argues that the degree of loyalty in banking can be gauged by “traking customer accounts over a defined time period and noting the degree of continuity in is patronage”.
Bloemer et al. (1998) defines bank loyalty as the biased (i.e. non random) behavioural response (i.e. revisit), expressed over a period of time, by some decision-making unit with respect to one bank out of a set of banks, which is a