1
1
2
3
Whey-Bread, an Improved Food Product: Evaluation of
4Textural Characteristics
5Short Title: TEXTURE CHARACTERISTICS OF WHEY-BREAD 6
7
Raquel P. F. GUINÉ1*, Carina SANTOS2, Celeste ROCHA2, Christelle 8
MARQUES2, Claudia RODRIGUES2, Filipa MANITA2, Filipe SOUSA2, Márcia 9
Félix2, Sílvia SILVA2, Susana RODRIGUES2 10
11
1. CI&DETS/CERNAS Research Centre, Dep. Food Industry, Polytechnic Institute
12
of Viseu, Portugal
13
2. Dep. Food Industry, Agrarian School of Viseu, IPV, Viseu, Portugal,
14 15
*Address correspondence to: 16
Professor Raquel P. F. Guiné, Quinta da Alagoa. Estrada de Nelas. Ranhados. 3500-606 17
Viseu. Portugal. 18
Tel: +351 232 446641; E-mail: [email protected] 19
20 21
Published article / Citation:
Guiné RPF, Santos C, Rocha C, Marques C, Rodrigues C, Manita F, Sousa F, Félix M, Silva S, Rodrigues S. (2020) Whey-Bread, an Improved Food Product: Evaluation of Textural Characteristics, Journal of Culinary Science & Technology, 18(1), 40-53.
2
Whey-Bread, an Improved Food Product: Evaluation of
22Textural Characteristics
23Short Title: TEXTURE CHARACTERISTICS OF WHEY-BREAD 24
25 26
Abstract
27The diversity in bread all around the world is enormous and enriched breads are a 28
trend to follow in the next years. The aim of this work was to develop new breads 29
incorporating whey residue, and the final products were analysed for their textural 30
properties, as compared with a basic wheat bread. For measurement of texture two types 31
of teste were used (compression and puncture). The results showed that the whey 32
residue could be used to produce bread with good textural properties, particularly for an 33
improved recipe. The improved whey bread showed good textural characteristics, which 34
remained practically unchanged after 24 h, being this true for the properties evaluated 35
through the compression test (hardness, chewiness, resilience, cohesiveness, 36
springiness) and through the puncture test (external firmness, inner firmness, stickiness, 37
adhesiveness). Finally, very strong correlations were found between cohesiveness and 38
resilience and between adhesiveness and stickiness. 39
40
Key words: compression test, puncture test, residue valorisation, textural properties. 41
42
Introduction
43Bread is undoubtedly recognized as one of the most extensively consumed basic 44
foods worldwide. Due to variable chemical composition of flours and utilized baking 45
3
processes, breads form a food group with highly heterogeneous structures. White wheat 46
bread is a commodity usually baked of starchy endosperm flour. During dough mixing, 47
wheat gluten proteins are transformed into a network in which carbon dioxide generated 48
by yeast fermentation is retained thus producing an expansion during fermentation and 49
baking (Gao, Tay, Koh, & Zhou, 2018; Pentikäinen et al., 2014). 50
The mechanical properties of the crumb and the crust determine the textural 51
characteristics of bread. Furthermore, the mechanical properties are related to the 52
structural and physical characteristics of the bread matrix. A sequence of texture 53
sensations is perceived by people while chewing bread due to the continuous 54
transformation of its structure, mostly due to the particle size reduction and saliva 55
impregnation processes (Gao et al., 2018; Gao, Wong, Lim, Henry, & Zhou, 2015; 56
Jourdren et al., 2016; Pentikäinen et al., 2014). 57
According to a United Nations report, the world population is expected to surpass 58
9.2 billion by 2050, which brings unquestionably a great challenge of how to feed such 59
an enormous population. Therefore, the efficient use of the available resources is a must 60
that needs to be addressed with urgency. The concept of circular economy contemplates 61
the reutilization and recycling of all types of waste. Therefore, the utilization of organic 62
residues for the production of value added products either for the food, pharmaceutical 63
or cosmetic industries allows the application of the circular economy concept on organic 64
waste management and contributes to the development of a bio-based economy. Many 65
residues and by-products of the food industry can be utilized to produce new foods 66
and/or ingredients with additional nutritional value and improved bioactive properties 67
(de Oliveira, da Silva Lucas, Cadaval, & Mellado, 2017; Keegan, Kretschmer, Elbersen, 68
& Panoutsou, 2013; Pleissner et al., 2016). 69
4
The dairy industry is responsible for the generation of large quantities of liquid 70
effluents, which are also typically characterized by a high organic load (Akhlaghi et al., 71
2017). According to a report about European Commission statistics (European 72
Commission, 2017), the overall amount of dairy products generated in the EU-28 area 73
accounted for more than 100 million tonnes in 2016. Among the main dairy products 74
manufactured that contribute for this waste generation are drinking milk (30.7% of the 75
overall production in 2016), cheese (9.6%), acidified milk (7.9%), cream (2.8%), 76
powder products (2.8%) other products (2.8%), other miscellaneous fresh products 77
(2.6%) and finally butter and other yellow fat products (2.4%) (Akhlaghi et al., 2017; 78
European Commission, 2017). 79
Because there is a growing need to minimize industrial waste by preferably 80
reutilizing the residues and transforming them into products with commercial value, and 81
in particular addressing the needs of some dairy facilities in the central region of 82
Portugal which produce cheese from sheep milk, the traditional Serra da Estrela cheese, 83
it is important to find alternative ways to use the whey residues originating in such dairy 84
facilities. Hence, the objectives of this work were to develop new added-value bakery 85
products incorporating whey residue, in order to take advantage of a resource with 86
nutritional relevance and at the same time minimizing environmental impacts by finding 87
alternative ways to use this residue. Additionally, the textural characteristics of the 88
developed products (breads) were evaluated shortly after baking, and again after 6 and 89
24 hours to observe the evolution of those properties along time. 90
91
Material and methods
925
Preparation of the breads
94
Basic wheat bread
95
The water (1700 mL) was warmed at a temperature of about 30 ºC, and 40 mL of the 96
warm water was used to dissolve the yeast (40 g of fresh yeast), which was then left to 97
stand for five minutes. After that 2 kg of refined flour type 65 and 40 g of salt were 98
mixed with the water and the yeast. The dough was beaten until the desired elasticity 99
and homogeneity were achieved (about 12-15 min). The dough was left in a stove at 35 100
ºC for 20 min to ferment. At the end of the elapsed time, the loaves with about 100 101
grams each were moulded in a round shape, and were taken for more 15 minutes to the 102
stove. Finally, they were baked in the oven, previously heated to 240 ºC, for twenty 103
minutes. In the first minutes of the baking process 2 steam baths were performed, to 104
avoid early formation of the crust. 105
106
Bread with whey residue
107
The procedure for the production of this bread was similar to the one described for 108
the basic wheat bread, however some changes were made in the formulation. The same 109
amount of flour was used (2 kg), but the water was replaced by whey residue (1045 mL) 110
and the amount of fresh yeast was changed to 60 g. Also, because the whey residue is 111
obtained from the productive process of making cheese and whey cheese, and therefore 112
already contains some incorporated salt, no salt was added when making the bread. 113
Figure 1 shows the whey residue used, which is considered a waste in the cheese and 114
whey cheese making industry. 115
6
116
Figure 1. Whey residue from the cheese and whey cheese making industry. 117
118
Improved whey bread
119
The procedure was basically similar to that used for other breads, but more changes 120
were introduced in the formulation so as to produce bread with better nutritional value. 121
Table 1 shows the formulation used to produce the improved whey bread. The pumpkin 122
seeds were slightly dehydrated (approximately 10 min at 240 ºC) before incorporation 123
into the dough. The various seeds and the oat flakes were used to produce o cover on 124
the surface of the bread before going to bake in the oven. 125
126
Table 1. Amount of ingredients used to produce the improved whey bread. 127
Ingredient Amount (unit)
Ingredient Amount (unit)
Refined wheat flour (type 65)
500 (g) Pumpkin seeds 129 (g)
Whole wheat flour 1500 (g) Chia seeds 8 (g)
Whey residue 1200 (mL) Poppy seeds 5 (g)
Fresh yeast 60 (g) Sesame seeds 9 (g)
7
128
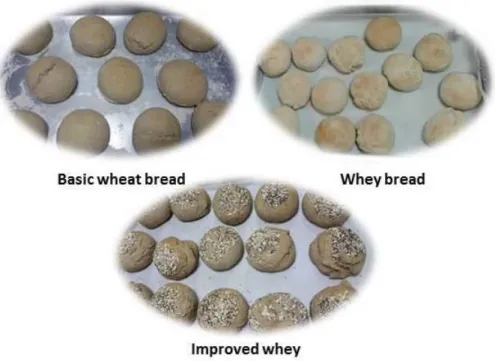
Figure 2 shows the three types of bread produced. 129
130
131
Figure 2. The three varieties of bread produced for the study. 132
133
For the tests, all bread samples were left at room temperature during the first 30 134
minutes after oven baking and again after 6 h, but to stay for the night until the next day 135
(24 h after baking) they were left inside a closed common plastic bag. 136
137
Evaluation of texture by compression test
138
For the assessment of the textural characteristics a texturometer TA-XT2 (Stable 139
Microsystems) was used and two types of test were performed: compression test and 140
puncture test. 141
The texture profile analysis was carried out by a compression test involving two 142
compression cycles between parallel plates performed on the samples using a flat 143
8
compression probe 75 mm in diameter (P/75), with 5 seconds of interval between 144
cycles. The parameters used for the test were: 30 kg force load cell, pre-test, test and 145
post-test speeds equal to 1.0 mm/s, distance 4 mm and trigger force 0.1 N. The textural 146
properties: hardness, resilience, springiness, cohesiveness and chewiness were 147
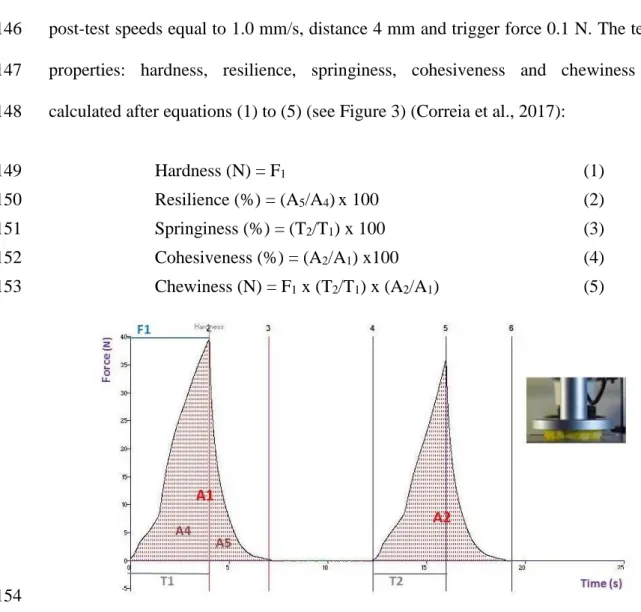
calculated after equations (1) to (5) (see Figure 3) (Correia et al., 2017): 148 Hardness (N) = F1 (1) 149 Resilience (%) = (A5/A4)x 100 (2) 150 Springiness (%) = (T2/T1) x 100 (3) 151 Cohesiveness (%) = (A2/A1) x100 (4) 152 Chewiness (N) = F1 x (T2/T1) x (A2/A1) (5) 153 154
Figure 3. Example of a texture profile analysis for bread, obtained by compression with a P/75 probe. 155
156
For these textural evaluations 8 units of each type of bread were used, and for each 157
bread one measurement was made on the top and another on the bottom faces of the 158
bread. Furthermore, the samples were evaluated 30 minutes after baking, and again 6 159
hours and 24 hours later, since this is a bread without preservatives, destined to be 160
consumed within 24 hours of baking, preferably. The results were processed using 161
Exponent software TEE from Stable Micro Systems. 162
9
163
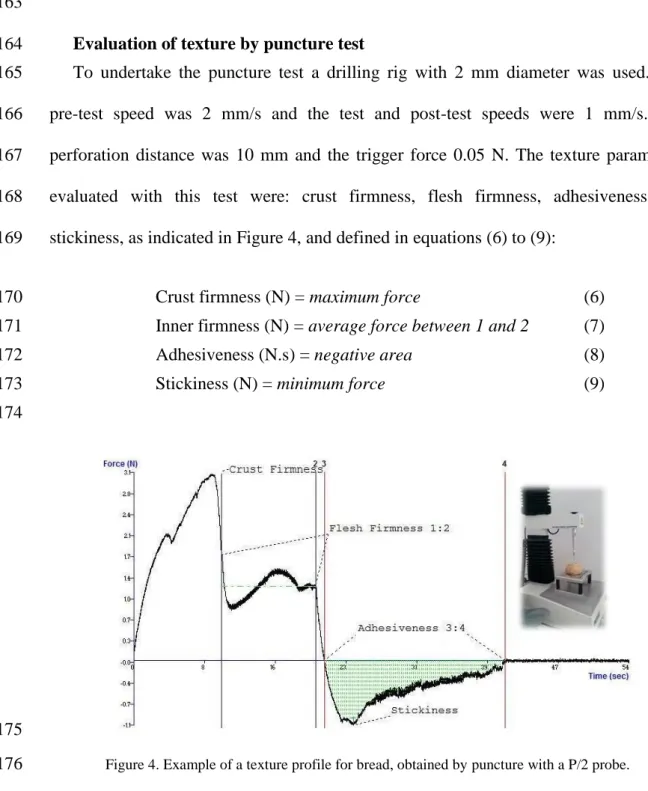
Evaluation of texture by puncture test
164
To undertake the puncture test a drilling rig with 2 mm diameter was used. The 165
pre-test speed was 2 mm/s and the test and post-test speeds were 1 mm/s. The 166
perforation distance was 10 mm and the trigger force 0.05 N. The texture parameters 167
evaluated with this test were: crust firmness, flesh firmness, adhesiveness and 168
stickiness, as indicated in Figure 4, and defined in equations (6) to (9): 169
Crust firmness (N) = maximum force (6)
170
Inner firmness (N) = average force between 1 and 2 (7) 171
Adhesiveness (N.s) = negative area (8)
172
Stickiness (N) = minimum force (9)
173 174
175
Figure 4. Example of a texture profile for bread, obtained by puncture with a P/2 probe. 176
177
For these textural evaluations 8 units of each type of bread were used, and for each 178
bread six measurements were made on the top and another six on the bottom faces of 179
the bread. The results were also processed with TEE software. 180
10
Statistical analysis
182
To validate the results obtained for the mean values calculated, a comparison of 183
means was performed by an analysis of variance (ANOVA), with the Post-Hoc Tukey 184
HSD (Honestly Significant Difference) test for identification of differences between 185
samples. Also the Pearson correlation coefficients were used to evaluate the possible 186
associations between properties. For absolute value of r = 0 there is no correlation, for r 187
]0.0, 0.2[ the correlation is very weak, for r [0.2, 0.4[ the correlation is weak, for r 188
[0.4, 0.6[ the correlation is moderate, for r [0.6, 0.8[ the correlation is strong, for r 189
[0.8, 1.0[ the correlation is very strong, for r = 1 the correlation is perfect (Maroco, 190
2012; Pestana & Gageiro, 2014). 191
For all statistical analyses was used the software SPSS version 24 (IBM, Inc.) and 192
the level of significance considered was 5% (p < 0.05). 193
194
Results and discussion
195196
Textural properties – compression test
197
The textural properties evaluated by the compression test were hardness, resilience, 198
springiness, cohesiveness and chewiness. Hardness represents the force necessary to 199
compress a food between the teeth or between the palate and the tong. Chewiness 200
measures the energy required to disintegrate a food to a state suitable to swallow. 201
Springiness is associated with the ability to recover shape after compression, being 202
equal to the rate at which the product returns to the initial point after removal of the 203
deforming force. Resilience is the energy used when applying a force to a material 204
without occurring rupture, with or without any residual strain, and corresponds to an 205
instant springiness. Cohesiveness represents the internal forces inside the food that stop 206
11
the sample from disintegrating (Cruz, Guiné, & Gonçalves, 2015; R. P. F. Guiné, 207
Henriques, & Barroca, 2014; Raquel P. F. Guiné, Almeida, Correia, & Gonçalves, 208
2015). 209
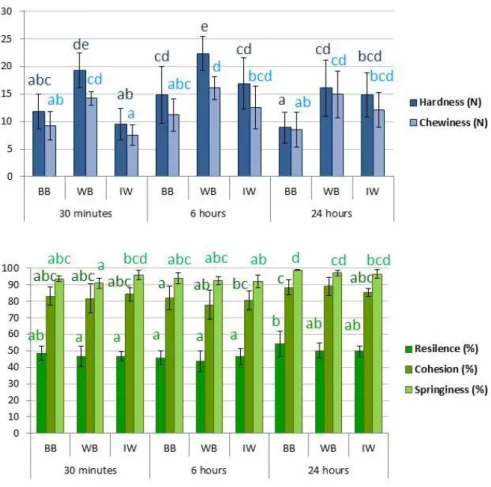
Figure 5 shows the mean values of the textural properties evaluated by the 210
compression test and the corresponding standard deviation. The results were subject to a 211
statistical analysis to verify if significant differences were found in the mean values for 212
each property. 213
214
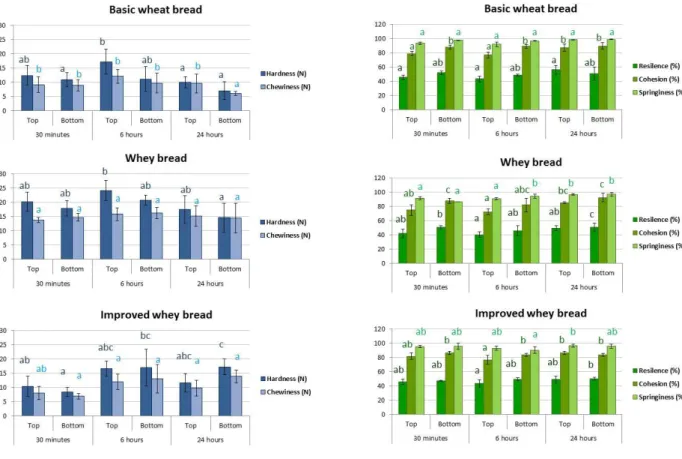
Figure 5. Textural properties evaluated by the compression test, separated according to the sides of the 215
bread samples (Bars with the same letter are not significantly different: ANOVA with Tukey post-hoc test, 216
p > 0.005). 217
218
The results in Figure 5 show that the whey bread presented in general highest 219
hardness and chewiness as compared with the basic wheat bread and the improved whey 220
bread. The improved whey bread, which is intended to be marketed, presented uniform
12
hardness and chewiness considering both sides of the loaf (the top and the bottom), 222
varying from 8-10 and 6-8 N, respectively, 30 minutes after oven baking. Furthermore, 223
as time elapsed the texture became harder after 6 hours and remained similar after 24 224
hours. This is important, since it is expected that the bread is consumed within 24 hours 225
after baking, for optimum textural characteristics. As for resilience, cohesiveness and 226
springiness, the 3 types of bread were not much different, and no apparent differences 227
were seen also between the top and bottom sides of the loaves. 228
Figure 6 shows the results obtained for the textural properties of the compression 229
tests, but considering the bread samples as whole, i.e., not differentiating the top from 230
the bottom sides. The results indicate that the improved whey bread was softer after 30 231
min of baking, but regained some firmness after some hours and maintained it for 24 232
hours, this being evident on the values of hardness and chewiness, which were 15 and 233
12 N, respectively. According to Ozturk and Mert (2018) solubilized proteins, which are 234
present in the whey residue, can produce a more homogenous structure, providing softer 235
products. On the other hand, as time passes the texture of bread is expected to change, 236
namely by increasing hardness (Barbosa-Ríos et al., 2018). 237
Considering the other textural properties, the differences between types of bread or 238
times of evaluation were not so representative. Ozturk and Mert (2018) observed that 239
springiness values in samples of gluten-free corn breads decreased over time, indicating 240
elasticity loss, but that was not the case with the present breads analysed, who were able 241
to maintain the textural properties for a period of 24 hours, which is the expected period 242
for consumption at optimum conditions of bread formulated without preservatives. 243
13
245
Figure 6. Textural properties evaluated by the compression test, considering each bread sample as a 246
whole (Bars with the same letter are not significantly different: ANOVA with Tukey post-hoc test, p > 247
0.005). Legend: BB = basic wheat bread, WB = whey bread, IW = improved whey bread. 248
249
Textural properties – puncture test
250
The puncture test gives information about the external and internal firmness, i.e., the 251
resistance of the crust and of the inner crumbs, as well as the stickiness and 252
adhesiveness. Adhesiveness corresponds to the negative area after the probe was 253
removed from the sample and corresponds to the force required to remove the material 254
that adheres to a specific surface (e.g., lips, palate, teeth). Stickiness is also related to 255
adhesiveness and corresponds to the minimum force (negative value) registered by the 256
probe right before starting to retract from the sample. 257
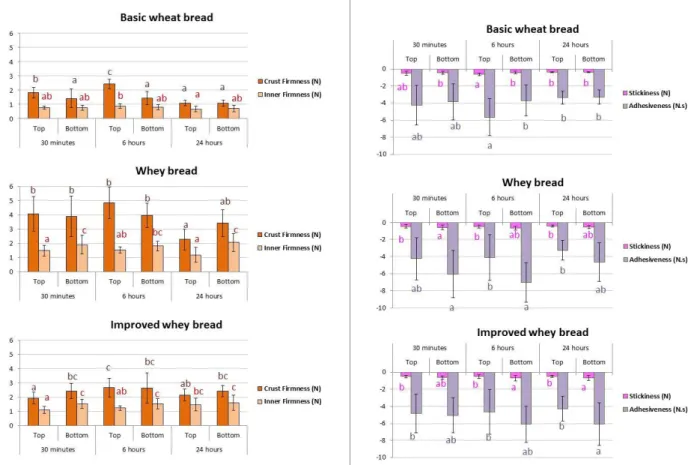
The results presented in Figure 7 correspond to the evaluation of the bread loaves 258
separately as top and bottom faces, and they indicate that the crust firmness was always 259
14
higher when compared to the inner firmness, which is in accordance with the fact that 260
during baking a crust is formed on the bread producing a harder surface. However, it 261
was observed that after 24 h the firmness tended to diminish for all types of bread. It 262
was reported that bread crust loses its crispness within a few hours after baking due to 263
water uptake from the soft and moist crumb, and hence, the crispy texture of the crust is 264
directly related to the water uptake kinetics (Meinders & van Vliet, 2011). The 265
improved whey bread allowed a better preservation of both the external and inner
266
firmness, as compared with the other bread samples evaluated. The adhesiveness was 267
considerable for all three types of bread, but stickiness was low in all cases. The 268
improved whey bread showed a more uniform trend for adhesiveness along time when
269
compared to the basic wheat bread or the whey bread. 270
271
Figure 7. Textural properties evaluated by the puncture test, separated according to the sides of the 272
bread samples (Bars with the same letter are not significantly different: ANOVA with Tukey post-hoc test, 273
p > 0.005). 274
15
275
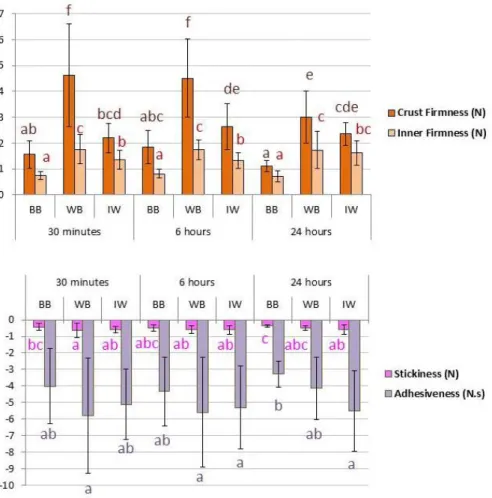
Figure 8 presents the values obtained for the textural properties through the puncture 276
test, but considering each bread sample as a whole. The sample whey bread was the 277
hardest, for all moments of evaluation, being significantly different from the others in 278
terms of external and internal firmness. Regarding the improved whey bread, the 279
firmness was just slightly increased from the 30 min to the 6 h and after that was kept 280
approximately constant, which indicates its suitability for preservation of the desired 281
textural properties. This sample (IW) also showed a constant adhesiveness and 282
stickiness over the time of evaluation, thus confirming the ability to maintain the 283
textural characteristics for the desired period of 24 h. 284
285
Figure 8. Textural properties evaluated by the puncture test, considering each bread sample as a whole 286
(Bars with the same letter are not significantly different: ANOVA with Tukey post-hoc test, p > 0.005). 287
Legend: BB = basic wheat bread, WB = whey bread, IW = improved whey bread. 288
16
289
Correlations
290
Table 1 presents the Pearson correlations between the textural variables studied, i.e., 291
those obtained with the compression test and with the puncture test. Generically, the 292
properties from the compression test do not correlate with those from the puncture test, 293
which would be predictable given the highly different nature of each test: one 294
corresponding to compression on the surface and the other comprising penetration 295
inside the sample. On the other hand, for each of the tests separately, there are important 296
correlations, as highlighted for example by the correlation between cohesiveness and 297
resilience (r = 0.939) for the compression test and between adhesiveness and stickiness 298
(r = 0.858) for the puncture test, which are considered very strong (0.8 r < 1). There 299
are also some strong correlations (0.6 r < 0.8) like in the case of the chewiness and 300
hardness (r = 0.637) and springiness and cohesiveness (r = 0.639), in the compression 301
test, or even between internal firmness and crust firmness (r = 0.767) for the puncture 302 test. 303 304 305 306
17
Table 1. Pearson correlations between the textural properties 307
Compression test Puncture test
HA RE CO SP CH CF IF ST AD C om pre ss ion HA 1 RE 0.052 1 CO -0.013 0.939** 1 SP -0.099 0.577** 0.639** 1 CH 0.637** 0.444** 0.414** 0.594** 1 Pu nct ure CF 0.504** 0.133 -0.092 -0.126 0.273** 1 IF 0.424** 0.055 0.070 -0.092 0.287** 0.767** 1 ST -0.130 0.020 -0.013 0.156 0.011 -0.378** -0.381** 1 AD -0.104 0.061 0.034 0.161 0.062 -0.321** -0.267** 0.858** 1 Notes: 308
HA = Hardness, RE = Resilience, CO = Cohesiveness, SP = Springiness, CH = Chewiness, CF = 309
Crust firmness, IF = Inner Firmness, ST = Stickiness, AD = Adhesiveness. 310
**Correlation is significant at the 0.01 level. 311
312
Conclusions
313This work allowed concluding that whey residue can be used to produce bread with 314
good textural properties, and an improved formulation with whey residue and some 315
other functional ingredients was developed. The improved whey bread tended to 316
become harder after 6 h of baking but did not change any more after 24 h. Resilience, 317
cohesiveness and springiness were not variable with time over an evaluation period of 318
24 h. Furthermore, the textural properties of the puncture test (external and internal 319
firmness, stickiness and adhesiveness) were approximately constant over time. Finally, 320
some very strong correlations were encountered between the textural properties 321
18
evaluated, namely between cohesiveness and resilience and between adhesiveness and 322
stickiness. 323
324
Implications and future work
325The success in utilizing the whey residue originating from the numerous dairy 326
facilities the used sheep milk to produce cheese in the central region of Portugal has a 327
first impact by greatly minimizing the amount of liquid effluents that are sent every day 328
to the sewage treatment plants, thus minimizing the environmental impact and reducing 329
operating costs for treatment of residues. Furthermore, for the owners of the dairy 330
facilities this provides additional revenue, because they sell the whey residue instead of 331
discarding it. Regarding the bakery industries, they are able to produce bread with whey 332
residue, especially by following the improved formulation hereby developed, and this 333
bread proved to have good textural properties, and therefore may have good 334
acceptability by the consumers. 335
Because this work focused on developing bread products and evaluating at first the 336
textural properties, the work undertaken so far should be complemented with further 337
work to evaluate the chemical and nutritional properties, having in mind that it was 338
developed an improved recipe with potentially functional ingredients. Also, the 339
developed products could be submitted to a sensory analysis for a better knowledge of 340
the acceptability by the potential future consumers. Finally, other bakery products could 341
be developed incorporating whey residue, like biscuits or cookies. 342
343
Acknowledgments
34419
This study was supported by Instituto Politécnico de Viseu/CI&DETS through 345
project PROJ/CI&DETS/CGD/0007 and FCT - Fundação para a Ciência e Tecnologia, 346
I.P., under the project UID/Multi/04016/2016. 347
The authors thank the company who provided the whey residue: Casa da Ínsua, 348 Viseu, Portugal. 349 350
References
351Akhlaghi, M., Boni, M. R., De Gioannis, G., Muntoni, A., Polettini, A., Pomi, R., … Spiga, D. (2017). A 352
parametric response surface study of fermentative hydrogen production from cheese whey. 353
Bioresource Technology, 244, 473–483. https://doi.org/10.1016/j.biortech.2017.07.158
354
Barbosa-Ríos, J. A., Castillón-Jardón, J., Guadarrama-Lezama, A. Y., Alvarez-Ramirez, J., Meraz, M., & 355
Carrillo-Navas, H. (2018). Effect of new generation enzymes addition on the physical, 356
viscoelastic and textural properties of traditional Mexican sweet bread. Journal of Cereal 357
Science, 79, 160–167. https://doi.org/10.1016/j.jcs.2017.10.012
358
Correia, P., Guiné, R., Correia, A. C., Gonçalves, F., Brito, M., & Ribeiro, J. (2017). Physical, chemical 359
and sensory properties of kiwi as influenced by drying conditions. Agricultural Engineering 360
International, 19(3), 203–212.
361
Cruz, A. C., Guiné, R. P. F., & Gonçalves, J. C. (2015). Drying Kinetics and Product Quality for 362
Convective Drying of Apples (cvs. Golden Delicious and Granny Smith). International Journal 363
of Fruit Science, 15(1), 54–78. https://doi.org/10.1080/15538362.2014.931166
364
de Oliveira, L. M., da Silva Lucas, A. J., Cadaval, C. L., & Mellado, M. S. (2017). Bread enriched with 365
flour from cinereous cockroach (Nauphoeta cinerea). Innovative Food Science & Emerging 366
Technologies, 44, 30–35. https://doi.org/10.1016/j.ifset.2017.08.015
367
European Commission. (2017). Milk and milk product statistics. Eurostat. 368
Gao, J., Tay, S. L., Koh, A. H.-S., & Zhou, W. (2018). Dough and bread making from high- and 369
low-protein flours by vacuum mixing: Part 3. Oral processing of bread. Journal of Cereal 370
Science, 79, 408–417. https://doi.org/10.1016/j.jcs.2017.12.002
20
Gao, J., Wong, J. X., Lim, J. C.-S., Henry, J., & Zhou, W. (2015). Influence of bread structure on human 372
oral processing. Journal of Food Engineering, 167, 147–155. 373
https://doi.org/10.1016/j.jfoodeng.2015.07.022 374
Guiné, R. P. F., Henriques, F., & Barroca, M. J. (2014). Influence of drying treatments on the physical 375
and chemical properties of cucumber. Journal of Food Measurement and Characterization, 8(3), 376
195–206. https://doi.org/10.1007/s11694-014-9180-9 377
Guiné, Raquel P. F., Almeida, I. C., Correia, A. C., & Gonçalves, F. J. (2015). Evaluation of the physical, 378
chemical and sensory properties of raisins produced from grapes of the cultivar Crimson. 379
Journal of Food Measurement and Characterization, 9(3), 337–346.
380
https://doi.org/10.1007/s11694-015-9241-8 381
Jourdren, S., Panouillé, M., Saint-Eve, A., Déléris, I., Forest, D., Lejeune, P., & Souchon, I. (2016). 382
Breakdown pathways during oral processing of different breads: impact of crumb and crust 383
structures. Food & Function, 7(3), 1446–1457. https://doi.org/10.1039/C5FO01286D 384
Keegan, D., Kretschmer, B., Elbersen, B., & Panoutsou, C. (2013). Cascading use: a systematic approach 385
to biomass beyond the energy sector. Biofuels, Bioproducts and Biorefining, 7(2), 193–206. 386
https://doi.org/10.1002/bbb.1351 387
Maroco, J. (2012). Análise Estatística com o SPSS Statistics (5a Ed.). Brazil: Report number. 388
Meinders, M. B. J., & van Vliet, T. (2011). Oscillatory water sorption dynamics of bread crust. Food 389
Research International, 44(9), 2814–2821. https://doi.org/10.1016/j.foodres.2011.06.027
390
Ozturk, O. K., & Mert, B. (2018). The effects of microfluidization on rheological and textural properties 391
of gluten-free corn breads. Food Research International, 105, 782–792. 392
https://doi.org/10.1016/j.foodres.2017.12.008 393
Pentikäinen, S., Sozer, N., Närväinen, J., Ylätalo, S., Teppola, P., Jurvelin, J., … Poutanen, K. (2014). 394
Effects of wheat and rye bread structure on mastication process and bolus properties. Food 395
Research International, 66, 356–364. https://doi.org/10.1016/j.foodres.2014.09.034
396
Pestana, M. H., & Gageiro, J. N. (2014). Análise de Dados para Ciências Sociais – A complementaridade 397
do SPSS (6a ed.). Brasil: Edições Sílabo.
398
Pleissner, D., Qi, Q., Gao, C., Rivero, C. P., Webb, C., Lin, C. S. K., & Venus, J. (2016). Valorization of 399
organic residues for the production of added value chemicals: A contribution to the bio-based 400
21
economy. Biochemical Engineering Journal, 116, 3–16.
401 https://doi.org/10.1016/j.bej.2015.12.016 402 403 404 405