www.recent-science.com RRST-Food Science
Characterization of Gluten-free Bread Prepared From Maize, Rice and
Tapioca Flours using the Hydrocolloid Seaweed Agar-Agar
Nuno Bartolomeu Alvarenga1*, Fernando Cebola Lidon2, Elisa Belga1, Patrícia Motrena1, Suse Guerreiro1, Maria João Carvalho1, João Canada1
1Área Departamental de Ciências e Tecnologia dos Alimentos, Escola Superior Agrária, Instituto Politécnico de Beja, Rua Pedro Soares, 7800-295 Beja, Portugal. 2Departamento de Ciências e Tecnologia da Biomassa, Faculdade de Ciências e Tecnologia/Universidade Nova de Lisboa, Campus da Caparica, 2829-516 Caparica,
Portugal.
Article Info Abstract
Article History This work aims to check the rheological, physicochemical and sensory characteristics of
gluten-free bread produced with corn, rice and tapioca flours, using the hydrocolloid seaweed agar-agar. Relatively to wheat bread, it was found that the pH was slightly lower in gluten-free bread. In the crust only the brightness remained significantly different between both bread types, but in the kernel, the parameters a*,b* and L* diverge significantly. The toughness as well as the force of penetration and cutting were also significantly different between both bread types. The hedonic evaluation showed that the panellists prefered bread with gluten but the quantitative descriptive analysis did not reveal a clear pattern. The overall assessment pointed that bread with gluten has a greater acceptance by consumers, while gluten-free bread is considered nice in the opinion of the penallists.
Received : 11-05-2011
Revised : 26-07-2011
Accepted : 27-07-2011
*Corresponding Author
Tel : +351284314300
Fax : +351284388207
Email:
©ScholarJournals, SSR Key Words:Gluten-free bread; Hydrocolloid seaweed agar-agar; Maize flour; Tapioca flour; Wheat flour.
Introduction
Coeliac disease is an autoimmune disorder of the small intestine, occurring in genetically predisposed people of all ages from middle infancy onward, that might cause severe malnutrition [1,2]. Coeliac disease is caused by a reaction to gliadin, a prolamin (i.e., gluten protein) found in wheat. Upon exposure to gliadin, and specifically to peptides found in prolamin, the enzyme tissue transglutaminase modifies the protein, and the immune system cross-reacts with the small-bowel tissue, causing an inflammatory reaction [3]. That leads to villous atrophy, which interferes with the absorption of nutrients, namely vitamins and minerals [4]. In Europe the disease affects 1 in 200 people [4], being the only known effective treatment a lifelong gluten-free diet. That is very difficult, however, since many foods contain gluten.
Gluten is the composite of a prolamin and a glutelin, which exist, conjoined with starch, in the endosperm of various grass-related grains, namely in wheat. Gliadin, a water-soluble, and glutenin, a water-insoluble, compose about 80% of the protein contained in wheat seed. Worldwide, gluten is a source of protein, both in foods prepared directly from sources containing it, and as an additive to foods otherwise low in protein.
In bakery gluten forms, as glutenin molecules, cross-link to make a sub-microscopic network and associates with gliadin, which contributes with viscosity and extensibility to the mix. If such dough is leavened with yeast, sugar fermentation produces bubbles of carbon dioxide which, trapped by the gluten network, cause the dough to swell or rise. Baking
coagulates the gluten, which, along with starch, stabilizes the shape of the final product. Gluten content has been implicated as a factor in the staling of bread, possibly because it binds water by hydration. The development of gluten (i.e., enhancing its elasticity) affects the texture of the baked goods. Gluten's attainable elasticity is proportional to its content of glutenins with low molecular weights because that fraction contains the preponderance of the sulfur atoms responsible for the cross-linking in the network. In general, bread flours are high in gluten while cake flours are low. Kneading promotes the formation of gluten strands and cross-links, so a baked product is chewier in proportion to how much the dough is worked. Increased wetness of the dough also enhances gluten development. Shortening inhibits formation of cross-links, so it is used, along with diminished water and minimal working, when a tender and flaky product, such as pie crust, is desired.
celiac diets [9,10,11]. Corn and tapioca starches may also be consumed by those with celiac disease, but they cause technological difficulties in breadmaking and impart unusual taste to bread. Gums, replacing gluten in bread formulations, also offer substantial technological improvements [7,12].
In general, gluten free bread mixtures do not have the same texture as wheat flour dough. These mixtures cannot hold the carbon dioxide gas produced by yeast. Bicarbonate of soda and tartaric acid still need to be added to the mixture to help it rise. Gluten free breads will seem drier, harder and have a darker texture than wheat bread. Yet, they have excellent nutritional value and can offer a variety of flavours.
To produce gluten-free bread the replacement of that chemical entity is based on the research of other flours such as corn, rice, potato starch, soybean flour and arrowroot, cassava and tapioca [13,14]. Nevertheless, the supplement of dough without gluten additives is difficult, because its structure is weaker than the normal dough of wheat and, additionally, supplements can easily destroy it [14]. Some studies suggest that the easiest way to use a supplement in bread dough to ensure that the viscoelastic properties are maintained is the use of hydrocolloids [14].
This work aimed to develop and characterize gluten-free bread produced with flours of corn, tapioca and rice and applying the hydrocolloid seaweed agar-agar (E406) which is a thickeners and gelling agent [15].
Materials and Methods
Bread with gluten was produced adding 1 kg of wheat flour (Continente T65), 2% salt and 70% water. The dough was kneaded in a mixer (Santos) for 15 minutes, being the yeast (4%, from Continente) incorporated in the last 5 minutes. After mixing, the dough was putted on a board, previously dusted with flour, in an oven (Rekena Flektro-Proof) at 35°C for 15 minutes. After removal from the oven, the dough was handled and divided into parts, which were again placed on trays dusted with flour and placed in an oven at 35°C for 45 minutes. A final shape was therefore given to the mass, being putted into a rectangular shape and moistened by sprinkling water. After being in the oven, at 230ºC for 30 minutes, it was unmold.
For the gluten-free bread, to define the degree of hydration of the mixture of maize, rice and tapioca flours (1:1:1, w/w/w), the moisture was measured in a sample of 10 g with a moisture meter OHAUS MB200, being establish 11.4% water. Thereafter, following [16], the hydration coefficient of the mixture was determined using a farinograph Brabender OHG DUISBURG being obtained the value of 78.5%. The flour mixture was therefore mixed with 2% salt and 78.5% water (added in in two parts). The kneading was made as to whether the bread with gluten, but 0.5% agar-agar seaweed (SEARA) and the yeast was added in the last 10 and 5 minutes of beating, respectively. After mixing the dough was putted on a board, previously greased with butter and sprinkled with corn flour, in the oven at 35°C for 30 minutes. Thereafter the dough was turned and placed again at 35°C for 45 minutes. The mass was further therefore moistened with sprinkling water and, after being in the oven at 230ºC for 30 minutes, it was unmold.
Switzerland). The colour analysis of the crust and crumb was carried out using the colorimeter Minolta CR-300 (Minolta, Osaka, Japan) and considered the parameters L*, a*, and b*. The L* scale ranges from 0 black to 100 white; the a* scale extends from a negative value (green hue) to a positive value (red hue); and the b* scale ranges from negative blue to positive yellow.
The toughness and the force of penetration and cutting was carried out using a Texture Analyser Model TAHD (Stable Micro Systems, Godalming, UK), in bread slices of 25 mm thickness. A cylindrical probe of 20 mm diameter was applied for the test of penetrometry and a trial probe for cutting, with distance of 10 mm (40% of slice thickness) and velocity 1.7 mm/s [18].
For sensory analysis quantitative descriptive and hedonic tests were performed. Through the quantitative descriptive analysis the products were characterized by a selected and trained panel, in accordance with requirements listed in [19,20]. The expert panellists had: experience in the recognition of basic tastes, good health without oral or nasal infections, and did not wear dentures or orthodontic appliances; had normal appetite; demonstrated ability to replicate trials; had good sensory memory; did not have an aversion to bread. By the hedonic tests the products were qualified to obtain the degree of appreciation by the judging panel. Both tests were performed in test rooms according to [21], with 12 and 16 panelists, respectively. The proof sheet contained a list of sensory descriptors (crust and crumb color, characteristic aroma and taste, crust firmless, moisture, adhesiveness, crum softness and breakdown, persistence, residual taste and global evaluation).
For sensory analysis hedonic tests were performed to obtain the degree of appreciation by the judging panel of 30 panellists, with a 9 points scale. The sensory quantitative descriptive analysis was performed in a linear, unstructured, with 10 cm, anchored at both ends with the words none and very strong, with 12 trained panellists [22,23].
Statistical analysis was carried out with STATISTICA 6.0 software Copyright StatSoft, Inc. with comparison of means and standard deviations in the ANOVA and analysis of variance according to the Scheffé test (p <0.05).
Results and Discussion
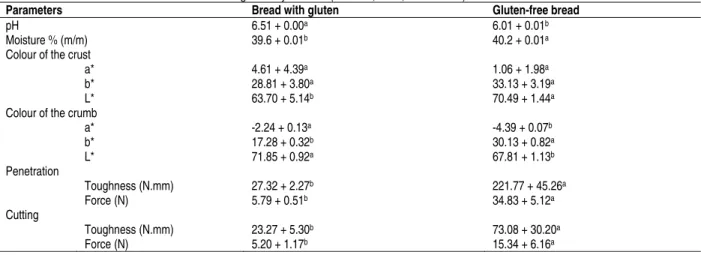
Hydrocolloids are widely used in the bakery industry to impart texture and appearance properties to cereal-based foods. The improving effect of several hydrocolloids on bread based on gluten-free formulations [24,25], as well as on wheat flour breads [25-29] has been reported. In this context, although gluten present in wheat-containing bread slows the movement of water [30], the slightly higher value of the moisture found in gluten-free bread (Table 1) can be attributed to the water retention properties of hydrocolloids, because of their hydrophilic nature. Moreover, the pH of bread with gluten remained 8.22% higher than the gluten-free bread (Table 1), which might have affected the colour and firmness characteristics of the different bread types.
had a light tint, but the gluten-free bread remained more clear because the value of the L* parameter 10.66% higher. Within this process, the lower L* values in the crust of bread with gluten were expected due to Maillard browning and carmelisation, which are influenced by the distribution of water and the reaction of reducing sugars and amino acids [31]. In the crumb (Table 1), parameter a* was significantly lower in gluten-free bread (about 96%) and indicated that the samples were close to the axis red/green, but with a slight tendence for the green color. The parameter b* highlighted the yellow crumb, showing a 1.74 fold higher value in the gluten-free bread. Although the L* parameter displayed a significantly lower value in gluten-free bread, both bread types revealed a high brightness.
The toughness and force of penetration and cutting remained consistently higher in gluten-free bread (Table 1). This effect was similar to previous reports [32] about the increasing crumb hardness in gluten-free breads. This pattern eventually resulted of the interaction between the hydrocolloid agar-agar seaweed on starch gel structure and the developing mechanical properties [33]. Accordingly, the overall effect on the mechanical properties of the gluten-free bread structure might have determined that rigidity increased as a
consequence of the diminishing swelling of the starch granules and the reduced amylose leaching from the granules. Additionally, the weakening effect on the composite starch network structure, due to the inhibition of interparticle contacts among swollen granules, reinforced that effect.
To ensure that gluten-free bread is acceptable, products with baked and sensory characteristics similar to those of wheat flour yeast bread are needed. In this context, the sensory evaluation of the fresh bread using the hedonic scale revealed that the panellists prefered bread with gluten, since only the firmness of the crust had a higher rate (Table 2) in gluten-free bread. Nevertheless, the gluten-free formulation was considered acceptable, since received scores much higher than 5 ranging from 6.1 to 7.1.
The quantitative descriptive analysis did not reveal a clear pattern (Table 2). The evaluation of moisture and adhesiveness in gluten-free bread had a higher rate, but the opposite occurred for the others parameters. Nevertheless, the overall assessment revealed that the bread with gluten had a greater acceptance by consumers, but the gluten-free bread prepared was considered nice in the opinion of the penallists.
Table 1. Physical, chemical and rheological analysis of bread with and without gluten. Means in the same row marked with different letters are significantly different (P < 0.05, n = 3, Scheffé test)
Parameters Bread with gluten Gluten-free bread
pH 6.51 + 0.00a 6.01 + 0.01b
Moisture % (m/m) 39.6 + 0.01b 40.2 + 0.01a
Colour of the crust
a* 4.61 + 4.39a 1.06 + 1.98a
b* 28.81 + 3.80a 33.13 + 3.19a
L* 63.70 + 5.14b 70.49 + 1.44a
Colour of the crumb
a* -2.24 + 0.13a -4.39 + 0.07b
b* 17.28 + 0.32b 30.13 + 0.82a
L* 71.85 + 0.92a 67.81 + 1.13b
Penetration
Toughness (N.mm) 27.32 + 2.27b 221.77 + 45.26a
Force (N) 5.79 + 0.51b 34.83 + 5.12a
Cutting
Toughness (N.mm) 23.27 + 5.30b 73.08 + 30.20a
Force (N) 5.20 + 1.17b 15.34 + 6.16a
Table 2. Mean values of the sensory evaluation through hedonic and quantitative descriptive tests by with 12 and 16 panelists, respectively. The linear scale was used, with 10 cm, anchored at both ends with the words none and very strong.
Tests Bread with gluten Gluten-free bread
Hedonic
Crust colour 7.5 7.1
Crum colour 7.5 6.7
Characteristic aroma 7.2 6.3
Characteristic taste 7.0 6.1
Crust firmness 6.7 7.0
Global evaluation 7.4 6.9
Quantitative descriptive
Moisture 3.9 5.1
Adhesiveness 2.5 4.9
Crum softness 7.5 7.2
Crum breakdown 4.1 2.8
Persistence 5.1 4.6
Conclusion
A greater awareness and improved reliability of diagnostic procedures has recently highlighted the prevalence of coeliac disease. Lifelong adherence to a gluten-free diet remains the cornerstone treatment for the disease. However, gluten is a major component of wheat flour, and its replacement in bakery products is a significant technological challenge. The use of rice, corn and tapioca flours applying the seaweed agar-agar hydrocolloid can be used as a matrix to mimic gluten in the manufacture of gluten-free bakery products, due to their structure-building and water binding properties.
References
[1] Davison, A.G.F. and M. Bridges. 1987. Coeliac disease. Clinica Chimica Acta 163: 1-40.
[2] Ciclitira, P.J. and H.J. Ellis. 1987. Investigation of cereal toxicity in coeliac disease. Postgraduate Medicine Journal 63: 767-775.
[3] Moore, M.M., M. Heinbockel, P. Dockery, H.M. Ulmer and E.K. Arendt. 2006. Network Formation in Gluten-Free Bread with Application of Transglutaminase. Cereal Chemistry 83(1): 28-36.
[4] Pité, M. 2008. Glúten na Industria Alimentar - como
garantir a segurança a consumidores celíacos. Segurança e Qualidade Alimentar. pp: 34-36.
[5] Kulp, K., F.N. Hepburn and T.A. Lehmann. 1974.
Preparation of bread without gluten. The Baker’s Dig 48(3): 34-37.
[6] Ranhotra, G.S., R.J. Loewe and L.U. Puyat. 1975.
Preparation and evaluation of soy fortified gluten free bread. Journal of Food Science 40(1): 62-64.
[7] Sánchez, H.D., C.A. Osella and M. A. de la Torre. 1996. Desarrollo de una fórmula para Pan sin gluten. Información Tecnológica 7(2): 35-42.
[8] Hamilton, J.R. and L.K. McNeill. 1972. Chilhood coeliac disease: response of treated patients to a small uniform daily dose of wheat gluten. Journal Pediatry 81:855-861.
[9] Nishita, K.D., R.L. Roberts and M.M. Bean. 1976.
Development of a yeast leavened rice bread formula. Cereal Chemistry 53(5): 626-635.
[10] Ylimaki, G., Z.J. Hawrysh, R.T. Hardin and B.R. Thomson. 1988. Application of response surface methodology to the development of rice flour yeast breads: objective measurements. Journal of Food Science 53(6): 1800-1805.
[11] Ylimaki, G, Z.J. Hawrysh, R.T. Hardin and B.R. Thomson. 1991. Application of response surface methodology to the development of rice flour yeast breads: sensory evaluation. Journal of Food Science 53(3): 751-759. [12] Christianson, D., H.W. Gardner, K. Warner, B.K. Boundy
and G.E. Inglett. 1974. Xanthan gum in protein-fortified starch bread. Food Technology 28: 23-29.
[13] Sánchez, H.D., C.A. Osella and M.A. de la Torre. 2002. Optimization of gluten-free bread prepared from cornstarch, rice flour, and cassava starch. Journal of Food Science 67(1): 415-419.
[14] Korus, J., M. Witczak, R. Ziobro and L. Juszczak. 2009. The impact of resistant starch on characteristics of gluten-free dough and bread. Food Hydrocolloids 23: 988-995
[15] NP 1735. 1986. Norma Portuguesa para referências
bibliográficas: Aditivos alimentares: definição, classificação e princípios de aplicação. Direcção Geral da Qualidade. Lisboa, Portugal.
[16] NP 3653. 1991. Norma Portuguesa para referências
bibliográficas:Derivados de cereais: Farinhas de trigo mole. Características físicas das massas. Determinação da absorção de água das características e das características reológicas por meio do farinógrafo. Instituto Português da Qualidade. Lisboa, Portugal.
[17] NP 2966. 1986. Norma Portuguesa para referências
bibliográficas:Derivados de cereais: Pão. Determinação do teor de água. Instituto Português da Qualidade. Lisboa, Portugal.
[18] Texture Expert Probes and Product Guide. 1983.
Determination of Bread Firmness using the AACC (74-09). Standard methord.
[19] ISO 8586-1. 1993. Sensory analysis. General guidance for the selection, training and monitoring of assessors. Part 1: Selected assessors. International Organization for Standardization, 15p.
[20] ISO 8586-1. 2001. Análise sensorial. Guia geral para a selecção, treino e controlo dos provadores. Parte 1-provadores qualificados. Instituto Português de Qualidade, Caparica, Portugal, 28p.
[21] NP 4258. 1993. Análise sensorial. Directivas gerais para a concepção dos locais apropriados para análise (1ª Edição) CT-14. Instituto Português da Qualidade. Caparica, Portugal.
[22] ISO 4121. 2003. Sensory analysis. Guidelines for the use of quantitative response scales. International Organization for Standardization, 7p.
[23] ISO 6658. 2005. Sensory analysis. Methodology - general guidance. International Organization for Standardization, 14p.
[24] Gallagher, E., T.R. Gormley and E.K. Arendt. 2004.
Recent advances in the formulation of gluten-free cereal-based products. Trends in Food Science Technology 15:143–152.
[25] Barcenas, M.E. and C.M. Rosell. 2005. Effect of HPMC addition on the microstructure, quality and aging of wheat bread. Food Hydrocolloids 19: 1037–1043.
[26] Bell, D.A. 1990. Methylcellulose as a structure enhancer in bread baking. Cereal Food World 35: 1001–1006. [27] Biliaderis, C.G., M.S. Izydorczyk and O. Rattan. 1995.
Effect of arabinoxylans on breadmaking quality of wheat flours. Food Chemistry 53: 165–171.
[28] Delcour, J.A., S. Vanhamel and R.C. Hoseney. 1991. Physicochemical and functional properties of rye nonstarch polysaccharides. II. Impact of a fraction containing water-soluble pentosans and proteins on gluten–starch loaf volumes. Cereal Chemistry 68: 72–76. [29] Guarda, A., C.M. Rosell, C. Benedito and M.J. Galotto.
2004. Different hydrocolloids as bread improvers and antistaling agents. Food Hydrocolloids 18: 241–247. [30] Roach, R.R. and R.C. Hoseney 1995. Effects of certain
[31] Kent, N.L. and A.D. Evers. 1994. Bread made with gluten substitutes. In: Technology of cereals, pp. 215, Pergamon Press, Oxford.
[32] Schober, T.J., M. Messerschmidt, S.R. Bean, S.H. Park and E.K. Arendt. 2005. Gluten-free bread from sorghum: quality differences among hybrids. Cereal Chemistry 82: 394–404