arXiv:1111.1297v2 [hep-ex] 5 Dec 2011
Submitted to Phys. Rev. D
K
S0and Λ production in pp interactions at
√
s = 0.9 and 7 TeV measured with the
ATLAS detector at the LHC
G. Aad et al.∗ (The ATLAS Collaboration)
(Dated: February 6, 2013) The production of K0
S and Λ hadrons is studied in pp collision data at √s = 0.9 and 7 TeV collected with the ATLAS detector at the LHC using a minimum-bias trigger. The observed dis-tributions of transverse momentum, rapidity, and multiplicity are corrected to hadron level in a model-independent way within well defined phase-space regions. The distribution of the production ratio of Λ to Λ baryons is also measured. The results are compared with various Monte Carlo simula-tion models. Although most of these models agree with data to within 15% in the K0
S distributions, substantial disagreements are found in the Λ distributions of transverse momentum.
PACS numbers: 13.85.Hd,13.85.Ni,14.20.Jn,14.40.Df
I. INTRODUCTION
Yields and production spectra of hadrons containing strange quarks have been measured previously at the Large Hadron Collider (LHC) and the Tevatron at vari-ous center-of-mass energies [1–3]. Measurements of par-ticle production provide insight into the behavior of QCD interactions at low momentum transfer, typically de-scribed by models with empirical parameters tuned from experimental data. Accurate modeling of such interac-tions is also essential for constraining the effects of the underlying event in the high-pT collisions studied at the
LHC. As the strange quark is heavier than the up and down quarks, the production of strange hadrons is sup-pressed relative to hadrons containing only up and down quarks. However, since the mass of the strange quark is comparable in value to the ΛQCD scale constant, it is
not sufficiently heavy for perturbative techniques to be used in modeling the production of strange hadrons and experimental input is required to tune it in Monte Carlo (MC) simulation. Moreover, the ratio of the production of strange antibaryons to strange baryons is related to the transfer of baryon number from the colliding protons to the mid-rapidity region and can be used to constrain “diquark” [4] and “string-junction” [5] models in MC gen-erators. Since the initial state in pp collisions has a net baryon number of two, these models can be tested even at zero rapidity at the LHC.
In this paper, the production of K0
S and Λ hadrons is
studied using the first 190 µb−1collected by the ATLAS
experiment at √s = 7 TeV and 7 µb−1 at 900 GeV. In
addition, the measurement of the ratio between Λ and Λ baryon production is presented. Data were collected with a minimum-bias trigger with the same selection as
∗Full author list given at the end of the article.
in the inclusive minimum-bias measurement of charged particles [6]. Strange hadrons are reconstructed in the K0
S → π+π−, Λ → pπ−, and Λ → ¯pπ+ decay modes
by identifying two tracks originating from a displaced vertex, exploiting the long lifetimes of strange hadrons (cτ ≈ 2.7 cm for K0
S hadrons and cτ ≈ 7.9 cm for Λ
hadrons). The measured distributions are
1 N dN dpT , 1 N dN dy, 1 Nev dNev dN , (1)
where N is the number of K0
S or Λ hadrons, pT is the
transverse momentum, y is the rapidity [7], and Nev is
the number of events with two charged particles satisfy-ing pT > 100 MeV and |η| < 2.5. The Λ distributions
do not include Λ baryons, while the ratio of Λ to Λ is presented versus pT and y as a separate measurement.
The kinematic spectra of strange hadrons are extracted from the reconstructed distributions by correcting for de-tector effects modeled with MC simulation samples that are validated with data. The observed distributions are corrected to the |η| < 2.5 and pT > 100 MeV
phase-space region where tracks can be reconstructed (imposed on the charged decay products) with minimum and max-imum flight-length requirements imposed on the K0
S and
Λ hadrons to avoid model-dependent extrapolations out-side of the detector acceptance. A similar approach was used in the ATLAS measurement of charged-hadron pro-duction [6].
II. THE ATLAS DETECTOR
The ATLAS detector [8] at the LHC [9] covers almost the whole solid angle around the collision point with lay-ers of tracking detectors, calorimetlay-ers and muon cham-bers. It has been designed to study a wide range of
physics topics at LHC energies. For the measurements presented in this paper, the tracking devices and the trig-ger system are used.
The ATLAS Inner Detector (ID) has full coverage in φ and covers the pseudorapidity range |η| < 2.5. It consists of a silicon pixel detector (Pixel), a silicon microstrip de-tector (SCT) and a transition radiation tracker (TRT). The sensitive elements of these detectors cover a radial distance from the interaction point of 51-150 mm, 299-560 mm, and 563-1066 mm, respectively, and are im-mersed in a 2 T axial magnetic field. The ID barrel (end-cap) region consists of 3 (2 × 3) Pixel layers, 4 (2 × 9) double-layers of single-sided silicon microstrips with a 40 mrad stereo angle, and 73 (2 ×160) layers of TRT straws. Typical position resolutions are 10, 17 and 130 µm for the R − φ coordinate and, in the case of the Pixel and SCT, 115 and 580 µm for the second measured coordinate. A track from a charged particle traversing the barrel detec-tor would typically have 11 silicon hits (3 pixel clusters and 8 strip clusters) and more than 30 straw hits.
The ATLAS detector has a three-level trigger system; data for this measurement were collected with Level 1 signals from the Beam Pickup Timing devices (BPTX) and the Minimum Bias Trigger Scintillators (MBTS). The BPTX stations consist of electrostatic button pick-up detectors attached to the beam pipe at ±175 m from the center of the detector. The coincidence of the BPTX signal between the two sides of the detector is used to de-termine when beam bunches are colliding in the center of the detector. The MBTS are mounted at each end of the detector in front of the liquid-argon end-cap calorime-ter cryostats at z = ±3.56 m. They are segmented into eight sectors in azimuth and two rings in pseudorapidity (2.09 < |η| < 2.82 and 2.82 < |η| < 3.84). Data were col-lected for this analysis using a trigger requiring a BPTX coincidence and MBTS trigger signals. The MBTS trig-ger used for this paper is configured to require at least one hit above threshold from either side of the detector, referred to as a single-arm trigger.
III. DATA SAMPLES AND EVENT SELECTION
The data used in this analysis consist of about 16 mil-lion events recorded by ATLAS in March and April 2010, corresponding to about 190 µb−1 of proton–proton
colli-sions provided by the LHC at the center-of-mass energy of 7 TeV, as well as 1 million events corresponding to about 7 µb−1 at √s = 900 GeV recorded in December
2009. Data events are required to pass the same data-quality and event requirements as those used in Ref. [6]. These include a primary vertex reconstructed from two or more tracks with pT > 100 MeV and transverse
dis-tance of closest approach to the beam-spot position of at most 4 mm. Events containing more than one primary vertex are rejected. After the selection, the fraction of events with more than one interaction in the same bunch crossing in these early LHC data is estimated to be at
the 0.1% level and is neglected.
A sample of 20 million non-diffractive minimum-bias MC events generated with pythia using the early AT-LAS MC09 tune [10, 11] and geant4 [12] simulation is passed through the same reconstruction as the data sample. The distribution of the longitudinal position of the primary vertex in the simulated sample is re-weighted to make it consistent with data. Samples of single-diffractive and double-diffractive events generated with the same tune are combined with the non-diffractive sample according to their relative total cross sections in the same manner as in Ref. [6]. The distributions of the longitudinal position of the primary vertex are found to be nearly identical in the simulated minimum-bias and diffractive samples. For some systematic studies, a fully simulated sample of events produced with the phojet generator [13] is used. To compare the data at parti-cle level with different phenomenological models describ-ing minimum-bias events, the followdescrib-ing samples are also used:
• pythia6 using the AMBT2B-CTEQ6L1 tune [14,
15];
• pythia6 using the Perugia2011 tune [16] (CTEQ5L parton distribution functions (PDFs) [17]); • pythia6 using the Z1 tune [18] (CTEQ5L PDFs); • pythia8 using the 4C tune[19, 20] (CTEQ6L1
PDFs);
• herwig++ 2.5.1 [21, 22], using the UE7-2 underlying-event tune at 7 TeV and the MU900-2 minimum-bias tune at 900 GeV [23] (both with MRST2007LO* PDFs [24]).
IV. V0
RECONSTRUCTION AND SELECTION
Tracks with pT > 50 MeV are reconstructed within
the |η| < 2.5 acceptance of the ID as described in detail in Refs. [6, 25, 26]. To form K0
S candidates, oppositely
charged track pairs with pT> 100 MeV and at least two
silicon hits are fit to a common vertex, assuming the pion mass for both tracks. The K0
S candidates are required to
satisfy the following criteria:
• The χ2of the two-track vertex fit is required to be
less than 15 (with 1 degree of freedom).
• The transverse flight distance, defined by the trans-verse distance between the secondary vertex (K0
S
decay point) and the reconstructed primary vertex, is required to be between 4 mm and 450 mm. • The cosine of the pointing angle in the transverse
plane (cos θK) between the KS0 momentum vector
and the KS0 flight direction, defined as the line
con-necting the reconstructed primary vertex to the decay vertex, is required to be greater than 0.999 (equivalent to an angle of 2.56◦).
For Λ and Λ decays, the track with the higher pT is
as-signed the proton mass and the other track is asas-signed the pion mass. In the simulated sample this identifica-tion is correct for 99.8% of the candidates. The Λ and Λ candidates are required to satisfy the following criteria:
• The χ2 of the two-track vertex fit is required to be
less than 15 (with 1 degree of freedom).
• The transverse flight distance is required to be be-tween 17 mm and 450 mm.
• The cosine of the pointing angle is required to be greater than 0.9998 (equivalent to an angle of 1.15◦).
• The pTof the Λ candidate is required to be greater
than 500 MeV
These requirements reduce the combinatorial back-ground. The smaller signal-to-background ratio in the Λ sample with respect to the K0
S sample requires a tighter
pointing requirement, while the larger value of the flight-distance selection exploits the longer lifetime of the Λ baryon. The minimum pT cut removes poorly
recon-structed candidates. The distributions of the invariant mass of the K0
S and Λ candidates in the data and MC
samples are shown in Fig.1.
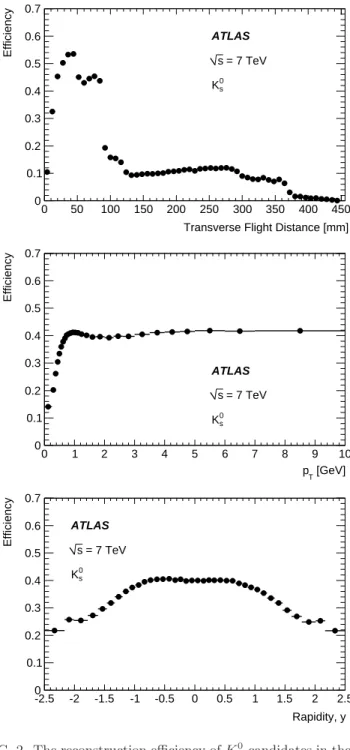
Figures 2 and 3 show the reconstruction efficiency of K0
S, Λ, and Λ candidates versus the radial position of
the decay vertex, pT, and rapidity. The efficiency is
de-termined from simulation by comparing the number of generated K0
S hadrons with the number of reconstructed
candidates after all selection criteria are applied. The efficiency turn-on curve versus pT is mainly an effect of
tracking efficiency, while the radial plot clearly shows the drops in efficiency when crossing detector layers, reflect-ing the lower efficiency of reconstructreflect-ing and selectreflect-ing tracks that have fewer hits in the silicon detector. (The effect is most pronounced at the Pixel layers, located roughly at radii of 50, 80, and 120 mm.)
V. EFFICIENCY AND CORRECTION
PROCEDURE
The measured K0
Sand Λ production quantities are
dis-tributions versus rapidity and transverse momentum as well as the number of K0
S or Λ candidates per event (the
“multiplicity”). To remove the background from the pT
and rapidity distributions, the reconstructed invariant-mass distribution is fitted for signal and background sep-arately in every bin of pTand rapidity. The
background-subtracted distributions are then corrected through an unfolding algorithm for detector resolution of the pTand
rapidity measurements as well as for the reconstruction efficiency. In the measurement of the production ratio of Λ to Λ baryons, a separate correction procedure is employed accounting for the difference in the detector response to positively and negatively charged baryons.
[MeV] -π + π M 400 420 440 460 480 500 520 540 560 580 600 Candidates / MeV 20 40 60 80 100 120 140 160 3 10 × Data Pythia MC09 signal fit background fit ATLAS = 7 TeV s -1 b µ Ldt = 190
∫
[MeV] -π p M 1100 1110 1120 1130 1140 1150 1160 Candidates / MeV 10000 20000 30000 40000 50000 60000 Data Pythia MC09 signal fit background fit ATLAS = 7 TeV s -1 b µ Ldt = 190∫
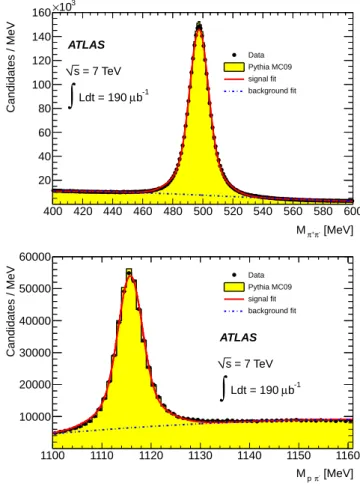
FIG. 1. Comparison of measured and predicted K0
S(top) and Λ (bottom) invariant-mass distributions in the 7 TeV samples. The points are data, while the histograms show the MC sam-ple with signal and background components separately nor-malized to the data. The solid line is the line-shape function fitted to data, while the dot-dashed line shows the component of the fitted function describing the combinatoric background (see Sec.V A 1).
A. Corrections to K0
S and Λ distributions
The corrections are evaluated separately for the 7 TeV and 900 GeV samples and are described sequentially be-low. The final distributions are normalized to unity by dividing by the total number of measured hadrons.
1. Background correction
The number of signal candidates in a given bin of the rapidity and transverse-momentum distributions is de-termined by fitting the invariant-mass spectrum of the K0
S or Λ candidates in that bin. The value and
statisti-cal uncertainty on the bin are then determined from the fitted signal yield and its uncertainty. For the KS0
candi-dates the functional form that is found to describe well the shape in data combines the sum of two Gaussians for the signal peak and a third-order polynomial for the
com-Transverse Flight Distance [mm] 0 50 100 150 200 250 300 350 400 450 Efficiency 0 0.1 0.2 0.3 0.4 0.5 0.6 0.7 ATLAS = 7 TeV s 0 s K [GeV] T p 0 1 2 3 4 5 6 7 8 9 10 Efficiency 0 0.1 0.2 0.3 0.4 0.5 0.6 0.7 ATLAS = 7 TeV s 0 s K Rapidity, y -2.5 -2 -1.5 -1 -0.5 0 0.5 1 1.5 2 2.5 Efficiency 0 0.1 0.2 0.3 0.4 0.5 0.6 0.7 ATLAS = 7 TeV s 0 s K
FIG. 2. The reconstruction efficiency of K0
S candidates in the 7 TeV MC sample after all selection criteria versus the trans-verse flight distance (top), pT(center), and rapidity (bottom).
binatorial background. The means of the two Gaussian components are constrained to be the same, while the widths and relative fractions are determined from the fit. For the Λ candidates a second-order polynomial is used for the background and the following modified Gaussian shape is used for the signal:
C · exph−0.5 · x(1+1+0.5·x1 ) i , x = m − µ σ , (2)
fit mean [MeV] world average [MeV] K0 S Data 497.536 ± 0.006 497.614 ± 0.024 K0 S MC 497.495 ± 0.006 Λ Data 1115.75 ± 0.01 1115.683 ± 0.006 Λ MC 1115.72 ± 0.01 Λ Data 1115.81 ± 0.01 Λ MC 1115.76 ± 0.01
TABLE I. The position of the mass peak in the fit to the 7 TeV data and simulation samples. The fit uncertainties on the mean are statistical only.
where m is the invariant mass and the fitted parameters are the normalization parameter C, the mean µ, and the width σ. This shape is found to model the invariant mass better than the sum of two Gaussians.
The results of the fits to the entire 7 TeV data and MC samples are summarized in Table I. The means of the mass peaks obtained from the fits in data are in rea-sonable agreement with simulation and with the world average [27]. The agreement demonstrates the accuracy of the track momentum scale and of the modeling of the Inner Detector’s 2 T solenoid magnetic field, which has been mapped to a precision of about 0.4 mT [28]. Although the deviation of data from the simulated and world-average values is statistically significant since the uncertainties do not include systematic effects, it is no larger than about 100 keV and does not affect the results presented in this article, as the mean mass position is not directly used in the measurement.
The contamination from secondary K0
S and Λ
produc-tion from long-lived baryon decays or nuclear interac-tions in the detector material is at the negligible level of 0.1% for K0
S decays in simulation and at the 10% level
in the Λ case, where it is subtracted from the measured data distributions. The modeling of secondary Λ baryons is evaluated by varying the pointing-angle selection and comparing its efficiency between MC and data. The mea-sured deviations at the level of 2% in the efficiency are assessed as a systematic uncertainty. The effect of Λ con-tamination in the K0
S signal and vice versa is similarly
studied and the contamination of less than 1% is included in the evaluation of systematic uncertainties.
2. Resolution correction
The pythia MC09 simulation sample is used to fill a two-dimensional migration matrix, where one dimension is binned in the generated value of the variable of interest (pT, rapidity, or multiplicity) and the other is binned in
the reconstructed value of the same variable. This ma-trix thus models the effect of the experimental resolution on the true value of pTor rapidity for reconstructed
using a hit-based matching algorithm [26]. This matrix is then used to unfold the migration across bins in the background-subtracted distributions in data.
3. Efficiency correction
The resolution-corrected pTand rapidity distributions
from the previous step are corrected bin by bin for the reconstruction efficiency, ǫi, in a given bin i. The
correc-tion factor, 1/ǫi, is derived from the pythia MC09
sam-ple as the ratio of generated to reconstructed candidates in bin i of the generated distribution. Only the generated K0
S and Λ hadrons originating from the primary vertex
and decaying within the tracking acceptance are consid-ered: the two pions (the proton and the pion) that the K0
S (Λ) hadron decays to are required to have |η| < 2.5
and pT> 100 MeV, while the KS0or Λ hadron itself is
re-quired to satisfy the appropriate minimum flight-distance requirement and a maximum flight-distance requirement of 450 mm, which corresponds to the effective accep-tance imposed by the silicon hit-content selection on the tracks. The reconstructed distributions in data are thus corrected to particles produced within the same accep-tance, as extrapolating to regions not probed by the Inner Detector would introduce a dependence on the MC gen-erator model in the correction procedure. The efficiency derived from MC is binned in pTor rapidity and the
ef-fectiveness of the entire correction procedure is evaluated through pseudo-experiments where the phojet MC sam-ple is unfolded using migration matrices filled from the pythiaMC09 sample. (See SectionVI.)
B. Corrections to the Λ/Λ production ratio
The background in the Λ and Λ distributions is sub-tracted in the same manner as the K0
S background but
with the modified Gaussian shape for the signal compo-nent. As most systematic tracking effects cancel in the production ratio, the ratio is corrected only for the differ-ence in reconstruction efficiency between Λ and Λ decays. This difference is mainly a consequence of the difference in tracking efficiency between protons (for Λ candidates) and antiprotons (for Λ candidates) caused by different interactions with detector material. The correction is es-timated from the MC sample in bins of pT and rapidity
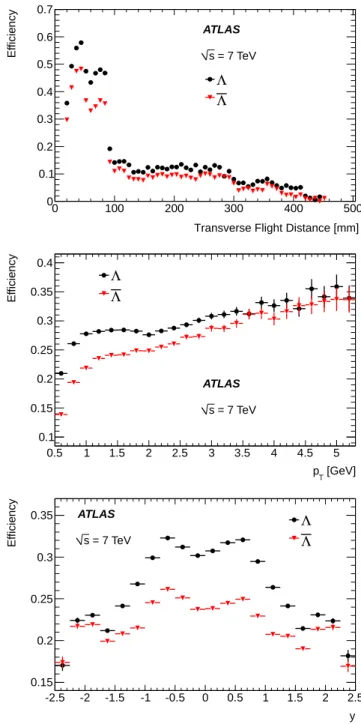
by comparing the reconstruction efficiency for Λ and Λ decays, which is shown in Fig.3. The ALICE experiment has reported that the nuclear-interaction cross section of antiprotons used by geant4 is over-estimated [1,29], re-sulting in an over-estimated efficiency difference between Λ and Λ reconstruction as shown in Fig. 3. Validation and correction of the model of detector material and the geant modeling of material-interaction cross sections and the associated systematic uncertainties are described in SectionVI.
Transverse Flight Distance [mm]
0 100 200 300 400 500 E ff ic ie nc y 0 0.1 0.2 0.3 0.4 0.5 0.6 0.7 Λ Λ ATLAS = 7 TeV s [GeV] T p 0.5 1 1.5 2 2.5 3 3.5 4 4.5 5 E ffi c ie n c y 0.1 0.15 0.2 0.25 0.3 0.35 0.4 ATLAS = 7 TeV s Λ Λ y -2.5 -2 -1.5 -1 -0.5 0 0.5 1 1.5 2 2.5 E ffi c ie n c y 0.15 0.2 0.25 0.3 0.35 ATLAS = 7 TeV s Λ Λ
FIG. 3. The efficiency in 7 TeV MC for reconstructing Λ and Λ candidates after all selection criteria versus the transverse flight distance (top), pT(middle) and rapidity (bottom). The uncertainties are statistical only.
VI. SYSTEMATIC UNCERTAINTIES
The systematic uncertainties are evaluated separately for the measurement of the K0
S and Λ distributions
and for the measurement of the Λ/Λ production ratio. For the K0
S and Λ distributions, systematic
uncertain-ties are evaluated for the reconstruction efficiency, the background-subtraction procedure, the method of
cor-0 5 10 15 20 25 30 35 40 45 50 Entries / 2mm 2 10 3 10 4 10 5 10 6 10 7 10 MC Data ATLAS -1 b µ Ldt = 190
∫
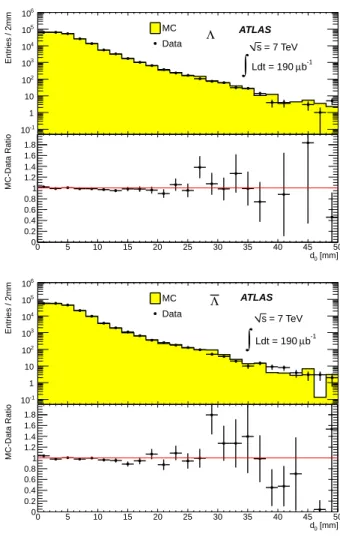
s = 7 TeV 0 s K [mm] 0 d 0 5 10 15 20 25 30 35 40 45 50 MC-Data Ratio 0.8 0.85 0.9 0.95 1 1.05 1.1 1.15FIG. 4. The distribution of the reconstructed transverse impact parameter in 7 TeV data and MC for pions originating in K0
S decays after all selection criteria are imposed.
recting for the resolution and efficiency, and the event selection. For the measurement of the Λ/Λ production ratio, the modeling of proton and antiproton reconstruc-tion, the effect of Λ baryons interacting with the detec-tor material before decaying, and the production of sec-ondary Λ baryons are considered.
A. Reconstruction efficiency
The systematic uncertainty on the efficiency is eval-uated by comparing impact-parameter distributions be-tween the MC and data samples. This uncertainty is then cross-checked by comparing decay-time distribu-tions with the lifetime of K0
S mesons and comparing the
selection efficiencies between MC and data.
1. Impact-parameter distributions
The systematic uncertainty on the tracking efficiency is evaluated using the transverse impact parameter, d0, of
the tracks produced in the K0
S or Λ decay. The d0
mea-surement is sensitive to different orientations of tracks with respect to the primary vertex and it is correlated with the measured flight distance of the K0
S candidate
through the vertexing of the decay point. Figures4and5
show a comparison of the reconstructed d0 distributions
in the data and MC samples.
In a given two-dimensional pT-rapidity bin, the d0
dis-tribution in the MC sample is normalized to data. The absolute values of the deviations between data and MC for all d0 bins are summed, corrected for the expected
value from statistical fluctuations, and divided by the integral of the distribution. This summed relative dif-ference is then assigned as the relative systematic un-certainty on the efficiency in that pT-rapidity bin. The
0 5 10 15 20 25 30 35 40 45 50 Entries / 2mm -1 10 1 10 2 10 3 10 4 10 5 10 6 10 MC Data ATLAS -1 b µ Ldt = 190
∫
s = 7 TeV Λ [mm] 0 d 0 5 10 15 20 25 30 35 40 45 50 MC-Data Ratio 0 0.2 0.4 0.6 0.8 1 1.2 1.4 1.6 1.8 0 5 10 15 20 25 30 35 40 45 50 Entries / 2mm -1 10 1 10 2 10 3 10 4 10 5 10 6 10 MC Data ATLAS -1 b µ Ldt = 190∫
= 7 TeV s Λ [mm] 0 d 0 5 10 15 20 25 30 35 40 45 50 MC-Data Ratio 0 0.2 0.4 0.6 0.8 1 1.2 1.4 1.6 1.8FIG. 5. The distribution of the reconstructed transverse impact parameter in 7 TeV data and MC for protons and antiprotons originating in Λ (top) and Λ decays (bottom) with pT> 500 MeV after all selection criteria are imposed.
two-dimensional pT-rapidity uncertainty map is then
pro-jected onto each axis to determine the one-dimensional uncertainty on the efficiency versus either pT or
rapid-ity. The uncertainty for the K0
S efficiency is at the 1%
level or less in the pTprojection except at high-pT, where
the deviation increases to 5%, and at around 200 MeV, where it rises to 3%. When evaluated versus rapidity, the typical uncertainty is 1%. The corresponding uncer-tainty versus rapidity for the Λ candidates is at 2%, with larger uncertainties at low pT. The effect of the
uncer-tainty in the detector material on the d0 distribution in
the simulation is also studied and verified to be consistent with the results of previous studies of detector material in minimum-bias events [6].
2. Decay-time distributions
The distribution of the K0
S proper decay time is used to
cross-check the modeling of the reconstruction efficiency in MC simulation. This method is sensitive to the
vari-ation of efficiency versus flight distance and pT, as both
are correlated with the decay time. The background-subtracted decay-time distribution in data is unfolded in the same manner as the pTand rapidity distributions,
accounting for bin migration and efficiency separately ac-cording to the MC corrections. The unfolded distribution in data is then fitted with an exponential shape and the lifetime compared with the world-average value. The fit-ted value of the lifetime, 89.37 ± 0.13 ps, is consistent with the world-average value of 89.58 ps to better than 0.3%, indicating excellent modeling of the variation of tracking efficiency versus flight distance.
3. Selection requirements
Although the previous two methods already include systematic uncertainties due to the flight-distance and kinematic selection criteria, the separate systematic ef-fect of the selection requirements is studied as an ad-ditional cross-check on the reconstruction efficiency; the result of this study is not included in the total uncer-tainty. The signal efficiency of each criterion is evaluated by fitting the invariant-mass distribution before and af-ter the selection is imposed in the same manner as in the background subtraction, with all other selection cri-teria already applied. The difference between the data and MC samples in the value of this efficiency is taken as a measure of how accurately the selection is modeled in the MC sample. The deviation is evaluated in bins of pT
and rapidity, with the finest granularity allowed by the stability and precision of the fitting procedure. For the silicon hit-content, flight-distance, track-momentum, and χ2 requirements, the deviation is at the 1% level in most
bins and under 2% in all bins. For the pointing-angle requirement, the deviation is at the 2% level in most regions, but can reach higher levels in a few bins in re-gions of large material and at low pT. These systematic
effects due to the selection requirements are consistent with the quoted systematic uncertainties obtained from the impact-parameter study.
B. Background
The systematic uncertainty on the background sub-traction is evaluated by comparing the signal yield from the fit to the invariant-mass distribution with the number obtained by simple sideband subtraction. The deviation for the K0
S candidates is at the 1% level in the barrel
rapidity region and rises to roughly 4% in the forward rapidity region, as can be seen in Fig. 6. The uncer-tainty for the Λ candidates is roughly twice as large, as can be seen in Fig. 7, reflecting the smaller signal-to-background levels. The 2% uncertainty due to secondary Λ production is also included in Fig.7.
C. Correction procedure for resolution and
efficiency
To test the accuracy of the unfolding procedure, the reconstructed pT and rapidity distributions in the
pho-jet MC sample are unfolded using the corrections de-rived from the pythia MC sample. As the difference between the phojet and pythia distributions is larger than the difference between the pythia and data dis-tributions, this is a conservative test of any model de-pendence in the unfolding procedure. To remove the ef-fect of statistical fluctuations, the reconstructed distri-bution in the phojet sample is used to generate 10000 pseudo-experiments by Poisson variation of each bin. The pseudo-experiments are then unfolded and the resid-ual distribution for each pTor rapidity bin with respect
to the particle-level distribution in the phojet sample is fitted to a Gaussian shape. The fitted residual mean is an indication of the bias due to the unfolding proce-dure in the bin, while the width is an estimate of the statistical uncertainty on the unfolding. The bias is at the 3% level or less in most K0
S rapidity bins and at the
5% level in the pTbins with most of the KS0 candidates.
For the Λ candidates, the bias is at the 8% level in most rapidity bins and at the 5% level in the pT bins with
most of the candidates. These biases are assigned as the systematic uncertainty on the unfolding procedure. The bias due to unfolding the multiplicity distribution is eval-uated in a similar manner, with the resulting uncertainty rising with multiplicity and reaching the 20% level in the three-candidate bin in the K0
S case and 40% in the Λ
case.
The statistical uncertainty on the corrected distribu-tions in data is evaluated from the spread in the residual distribution when unfolding 10000 pseudo-experiments generated from the reconstructed data distributions. These uncertainties include both the fluctuations in the reconstructed distribution itself and any statistical spread from the correction procedure.
D. Event selection
As the data sample and event selection requirements in this measurement are identical to those used in Ref. [6], the systematic uncertainties on the event selection are taken directly from that analysis. These include uncer-tainties on the presence of beam backgrounds, the trig-ger efficiency, the efficiency of primary vertexing, and the presence of additional primary vertices from pile-up col-lisions. The total systematic uncertainty on the number of K0
S and Λ hadrons due to the event selection is 0.1%.
E. Total uncertainty on K0
S and Λ production
All the systematic and statistical uncertainties on the K0
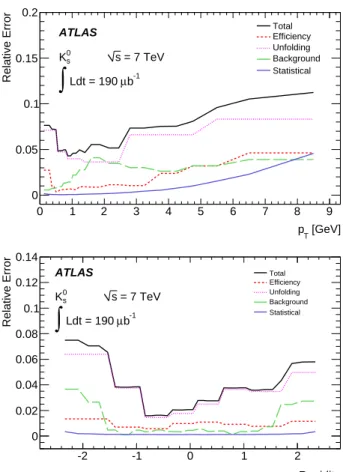
[GeV] T p 0 1 2 3 4 5 6 7 8 9 Relative Error 0 0.05 0.1 0.15 0.2 ATLAS = 7 TeV s 0 s K -1 b µ Ldt = 190
∫
Total Efficiency Unfolding Background Statistical Rapidity -2 -1 0 1 2 Relative Error 0 0.02 0.04 0.06 0.08 0.1 0.12 0.14 ATLAS = 7 TeV s 0 s K -1 b µ Ldt = 190∫
Total Efficiency Unfolding Background StatisticalFIG. 6. The systematic, statistical, and total uncertainties versus pT(top) and rapidity (bottom) of the K
0
S candidate in 7 TeV data.
The total uncertainty, which is dominated by the system-atic component, is at the 5% level in the peak of the pT
distribution and rises to 10% at higher pT. In the rapidity
distribution, the uncertainty is at 4% in the central re-gion and rises to 6 − 8% in the forward rere-gion. Figure7
summarizes the systematic and statistical uncertainties on the Λ distributions, which are larger everywhere but show qualitatively similar behavior.
F. Systematic uncertainty on the Λ/Λ ratio
Several systematic effects on the Λ/Λ production ratio are considered:
• The modeling of the interaction cross section for antiprotons in detector material and its difference from the corresponding cross section for protons;
• The interactions of Λ and Λ baryons in the detector material before decaying;
• Contamination from secondary Λ and Λ baryons.
[GeV] T p 1 2 3 4 5 6 7 8 9 Relative Error 0 0.1 0.2 0.3 0.4 0.5 ATLAS = 7 TeV s Λ -1 b µ Ldt = 190
∫
Total Efficiency Unfolding Background Sec. Component Statistical Rapidity -2 -1 0 1 2 Relative Error 0 0.1 0.2 0.3 0.4 0.5 ATLAS = 7 TeV s Λ -1 b µ Ldt = 190∫
Total Efficiency Unfolding Background Sec. Component StatisticalFIG. 7. The systematic, statistical, and total uncertainties versus pT(top) and rapidity (bottom) of the Λ candidate in 7 TeV data.
1. Modeling of proton and antiproton reconstruction
The cross sections used by the GEANT4 simulation to model the nuclear interactions of antiprotons with mate-rial have been found to be over-estimated by the ALICE experiment [1,29]. Any such overestimate biases the cor-rection to the Λ/Λ ratio described in Section V B. To constrain the accuracy of the GEANT4 model, patterns of hits on tracks in the outermost two layers of the SCT are compared between data and MC. For tracks that have hits in the three Pixel layers and the first two SCT layers, the fraction that do not have hits in the outer two layers is a measure of the inefficiency due to material interactions in those layers. This inefficiency is compared between data and MC for protons (antiprotons) coming from the selected Λ (Λ) candidates and corrected for background contributions using the invariant-mass sidebands. While the data and MC are consistent for proton tracks, the ef-ficiency for antiprotons is significantly lower in MC than in data, consistent with the expectation that the inter-action cross section for antiprotons is overestimated in GEANT4. Comparing the ratio of antiproton-to-proton efficiency in the outer two layers between data and MC, a multiplicative correction factor to the Λ/Λ ratio is ex-tracted as a function of pTof the Λ candidate. This factor
ranges from 0.9 at pT= 500 MeV to 0.99 at pT= 2 GeV.
(Λ candidates below 500 MeV are rejected as not enough proton candidates are reconstructed at low pT to
reli-ably evaluate the correction factor for these candidates.) As several correction factors can be formed from various combinations of hit patterns in the outer two layers, the largest variation among them is taken as a systematic uncertainty on this correction. This uncertainty ranges from 5% at pT= 500 MeV to about 1% at pT= 2 GeV.
As an additional cross-check, a sample of protons is se-lected using the specific energy loss dE/dx measurement in the Pixel detector [30] and similar data-MC correc-tion factors are calculated using the efficiency to extend the Pixel tracks to the SCT. The results of the dE/dx method are consistent with the hit-pattern study.
2. Interactions with material before decay and secondary Λ production
When evaluated versus the radial position of the decay vertex, the reconstructed Λ/Λ ratio shows sharp discrete changes of up to 10% at the detector layers. In the MC sample, the dominant cause of this effect is the asym-metric interaction of Λ and Λ baryons with the detector material before decay, since such interactions preclude the reconstruction of the final state of interest. In ad-dition, roughly 15% of the effect is caused by secondary baryons asymmetrically produced at the detector layers by nuclear interactions of other particles. To constrain the modeling of these effects in the MC sample, the dif-ference between data and MC in the change of the ratio at the detector layers is evaluated. The data/MC dif-ferences at every layer of the tracker are added together and the sum is assessed as a systematic uncertainty. Al-though the value varies in different regions of the detector due to detector geometry, the largest value of 2.6% (ob-tained in the central region) is conservatively assigned to the entire measured tracking acceptance. Other eval-uations of possible effects of interactions with material in the MC sample yield an additional 1.5% uncertainty, for a total uncertainty of 3%. Although the radial study already includes the effect of secondary Λ baryons pro-duced at the detector layers, an additional uncertainty of 1.5% evaluated from the MC sample is assessed to ac-count for the effect of Λ baryons produced in the decay of heavier strange baryons.
3. Total uncertainty onΛ production ratio
The systematic uncertainties are summarized in Ta-ble II. The uncertainty is largest at low pT, where it
is at the 4.5% level, and approaches the 3.5% level at higher pT, where the effect of the proton and antiproton
modeling in GEANT4 is smallest.
Systematic uncertainty
Antiproton cross section ± 1.0-2.8 %
(pT-dependent)
Interaction with material ± 3.0 %
Secondary production ± 1.5 %
Total ± 3.5-4.4 %
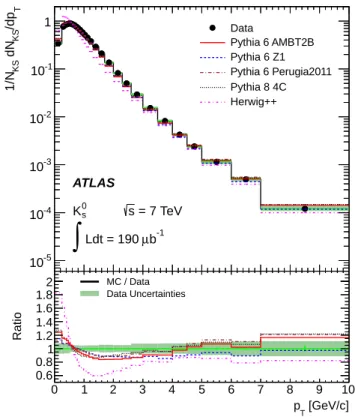
TABLE II. Summary of all systematic uncertainties on the Λ/Λ production ratio, in %. 0 1 2 3 4 5 6 7 8 9 10 T /dp KS dN KS 1/N -5 10 -4 10 -3 10 -2 10 -1 10 1 ATLAS = 7 TeV s 0 s K -1 b µ Ldt = 190
∫
Data Pythia 6 AMBT2B Pythia 6 Z1 Pythia 6 Perugia2011 Pythia 8 4C Herwig++ [GeV/c] T p 0 1 2 3 4 5 6 7 8 9 10 Ratio 0.6 0.8 1 1.2 1.4 1.6 1.8 2 Data Uncertainties MC / DataFIG. 8. The corrected pTdistribution of KS0mesons in 7 TeV data compared with the hadron-level distributions in the MC samples for a variety of tunes, normalized to unity. The bot-tom part of the plot shows the ratio of the MC and data distributions, with the shaded band showing the statistical and systematic uncertainties on the data sample added in quadrature.
VII. RESULTS
In all corrected distributions, K0
S mesons are required
to have a flight distance between 4 mm and 450 mm and to decay to two charged pions with |η| < 2.5 and pT > 100 MeV, while Λ and Λ baryons are required to
have pT > 500 MeV, flight distance between 17 mm
and 450 mm, and to decay to a proton and a pion with |η| < 2.5 and pT > 100 MeV. Only KS0 and Λ
hadrons consistent with originating from the primary ver-tex are considered. The pT and rapidity distributions
-2.5 -2 -1.5 -1 -0.5 0 0.5 1 1.5 2 2.5 /dy KS dN KS 1/N 0.05 0.1 0.15 0.2 0.25 0.3 0.35 0.4 0.45 ATLAS = 7 TeV s 0 s K -1 b µ Ldt = 190
∫
Data Pythia 6 AMBT2B Pythia 6 Z1 Pythia 6 Perugia2011 Pythia 8 4C Herwig++ y -2.5 -2 -1.5 -1 -0.5 0 0.5 1 1.5 2 2.5 Ratio 0.8 0.9 1 1.1 1.2 Data Uncertainties MC / DataFIG. 9. The corrected rapidity distribution of K0
S mesons in 7 TeV data compared with the hadron-level distributions in the MC samples for a variety of tunes, normalized to unity. The bottom part of the plot shows the ratio of the MC and data distributions, with the shaded band showing the statis-tical and systematic uncertainties on the data sample added in quadrature.
are normalized to the number of K0
S or Λ hadrons, while
the multiplicity distributions are normalized to the total number of events with two charged particles satisfying pT > 100 MeV and |η| < 2.5. The multiplicity
distri-butions are corrected for branching fractions to the mea-sured final states using world-average values [27]. Pre-dictions from several MC generators are shown with the same acceptance requirements.
Figures8 and 9show the corrected production distri-butions of K0
S mesons versus transverse momentum and
rapidity, respectively, in 7 TeV data. Figure10shows the distribution of K0
S multiplicity in 7 TeV data. Figures11
and 12 show the corrected production distributions of KS0 mesons versus transverse momentum and rapidity,
respectively, in 900 GeV data, while Fig.13shows the dis-tribution of K0
S multiplicity in 900 GeV data. Figures14
and15show the corrected production distributions of Λ baryons versus transverse momentum and rapidity, re-spectively, in 7 TeV data, while Fig.16shows the distri-bution of Λ multiplicity in 7 TeV data. Figures17and18
show the corrected production distributions of Λ baryons versus transverse momentum and rapidity, respectively, in 900 GeV data, while Fig.19shows the distribution of
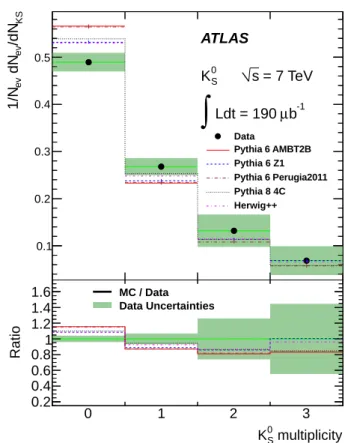
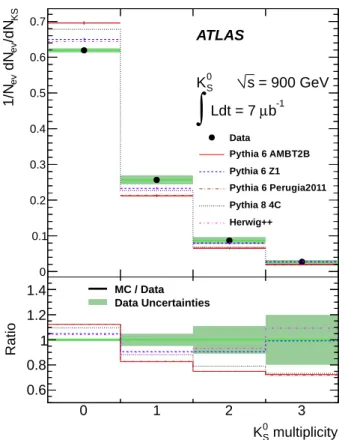
0 1 2 3 4 KS /dN ev dN ev 1/N 0.1 0.2 0.3 0.4 0.5 Data Pythia 6 AMBT2B Pythia 6 Z1 Pythia 6 Perugia2011 Pythia 8 4C Herwig++ ATLAS = 7 TeV s S 0 K -1 b µ Ldt = 190
∫
multiplicity S 0 K 0 1 2 3 Ratio 0.2 0.4 0.6 0.8 1 1.2 1.4 1.6 Data Uncertainties MC / DataFIG. 10. The corrected multiplicity distribution of K0 Smesons in 7 TeV data compared with the hadron-level distributions in the MC samples for a variety of tunes, normalized to unity. The bottom part of the plot shows the ratio of the MC and data distributions, with the shaded band showing the statis-tical and systematic uncertainties on the data sample added in quadrature.
Λ multiplicity in 900 GeV data.
The fully corrected Λ/Λ production ratio is shown in Fig. 20 versus the absolute value of rapidity and in Fig. 21 versus pT, along with predictions from several
MC models. The ratio is shown only for candidates with pT > 500 MeV. The corrected ratio is consistent
with unity everywhere, while the uncertainties within the barrel, transition, and endcap regions in rapidity are highly correlated due to common detector corrections and systematic effects. The measurement is statistically limited at higher pT, while at lower pT the systematic
effects of the modeling of antiproton reconstruction in simulation dominate the uncertainty. Figs. 22 and 23
0 0.5 1 1.5 2 2.5 3 3.5 T /dp KS dN KS 1/N -2 10 -1 10 1 ATLAS = 900 GeV s 0 s K -1 b µ Ldt = 7
∫
Data Pythia 6 AMBT2B Pythia 6 Z1 Pythia 6 Perugia2011 Pythia 8 4C Herwig++ [GeV/c] T p 0 0.5 1 1.5 2 2.5 3 3.5 Ratio 0.4 0.6 0.8 1 1.2 1.4 1.6 1.8 Data Uncertainties MC / DataFIG. 11. The corrected pT distribution of KS0 mesons in 900 GeV data compared with the hadron-level distributions in the MC samples for a variety of tunes, normalized to unity. The bottom part of the plot shows the ratio of the MC and data distributions, with the shaded band showing the statis-tical and systematic uncertainties on the data sample added in quadrature.
VIII. DISCUSSION AND CONCLUSIONS
While the shape of the rapidity distribution for K0 S
mesons in 7 TeV data agrees with the hadron-level pythia distributions to 5% (Fig. 9), the pythia tunes fall more slowly than data versus pTabove 2 GeV (Fig.8),
although the deviations are within 15% everywhere ex-cept at the lowest pT bin. This shape discrepancy is
much improved from the earlier generation of tunes used in ATLAS, as the current models have been tuned using minimum-bias data from the LHC experiments. The best agreement is observed in the pythia6 Z1 tune, but the variation among the pythia tunes is small. Although the shape of the herwig++ distribution (UE7-2 tune) agrees with data above 3 GeV, it does a poor job at lower momenta. All of the MC models underestimate the num-ber of K0
S mesons per minimum-bias event (Fig.10), but
the experimental uncertainties preclude drawing a sig-nificant conclusion about the shape of the multiplicity distribution.
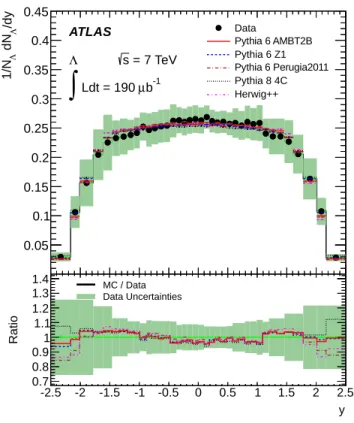
In the case of Λ baryons at 7 TeV, all of the tunes disagree with data at high-pT and to a greater degree
than in the K0
S case (Fig. 14). The worst agreement
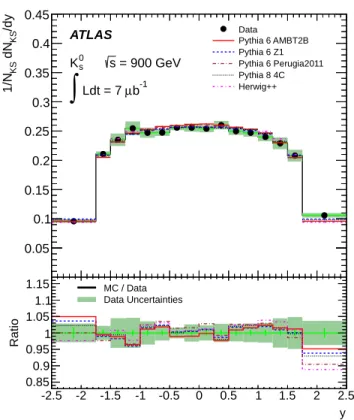
-2.5 -2 -1.5 -1 -0.5 0 0.5 1 1.5 2 2.5 /dy KS dN KS 1/N 0.05 0.1 0.15 0.2 0.25 0.3 0.35 0.4 0.45 ATLAS = 900 GeV s 0 s K -1 b µ Ldt = 7
∫
Data Pythia 6 AMBT2B Pythia 6 Z1 Pythia 6 Perugia2011 Pythia 8 4C Herwig++ y -2.5 -2 -1.5 -1 -0.5 0 0.5 1 1.5 2 2.5 Ratio 0.85 0.9 0.95 1 1.05 1.1 1.15 Data Uncertainties MC / DataFIG. 12. The corrected rapidity distribution of K0
Smesons in 900 GeV data compared with the hadron-level distributions in the MC samples for a variety of tunes, normalized to unity. The bottom part of the plot shows the ratio of the MC and data distributions, with the shaded band showing the statis-tical and systematic uncertainties on the data sample added in quadrature.
is for pythia8, which deviates from data by a factor of about 2.5 at the highest measured momenta. The Perugia2011 and Z1 tunes also significantly overestimate the production of Λ baryons per event at both energies (Fig.16).
The AMBT2B tune agrees with 900 GeV data for K0 S
mesons to better than about 25% across the whole pT
range (Fig.11), while herwig++ (MU900-2 tune) dis-agrees with data more strongly than in the 7 TeV case (UE7-2 tune). The number of K0
S mesons per event
(Fig. 13) is underestimated as in the 7 TeV data. In the Λ pTdistribution (Fig.17) all tunes agree with data
better at 900 GeV than at 7 TeV.
The Λ/Λ production ratio at both energies is consis-tent with unity everywhere and does not show a signifi-cant variation with either rapidity or pTwithin our total
uncertainties. herwig++ (MU900-2 tune) shows a de-crease in the ratio versus both pTand rapidity at 900 GeV
that is not reproduced by the data (Fig.22). The mea-surement is consistent with other antibaryon-baryon ra-tio measurements from the ALICE, LHCb, and STAR experiments [1, 29,31, 32]. Measurements from several other experiments are shown in Fig.24 in terms of the difference between the rapidity of the observed baryons
0 1 2 3 4 KS /dN ev dN ev 1/N 0 0.1 0.2 0.3 0.4 0.5 0.6 0.7 Data Pythia 6 AMBT2B Pythia 6 Z1 Pythia 6 Perugia2011 Pythia 8 4C Herwig++ ATLAS = 900 GeV s S 0 K -1 b µ Ldt = 7
∫
multiplicity S 0 K 0 1 2 3 Ratio 0.6 0.8 1 1.2 1.4 Data Uncertainties MC / DataFIG. 13. The corrected multiplicity distribution of K0 Smesons in 900 GeV data compared with the hadron-level distributions in the MC samples for a variety of tunes, normalized to unity. The bottom part of the plot shows the ratio of the MC and data distributions, with the shaded band showing the statis-tical and systematic uncertainties on the data sample added in quadrature.
and the rapidity of the proton beam (ybeam≈ 8.9 and 6.9
at 7 TeV and 900 GeV, respectively), along with a com-bined fit to the following functional form [29] that has been found empirically to describe the data at several energies:
1
ratio = 1 + C × e
(αJ−αP)∆y, (3)
where αJ and αP are related to the string-junction and
Pomeron models, respectively. Following Ref. [29], the parameters are fixed to αJ = 0.5 and αP = 1.2 and the
value C = 4.6 ± 0.5 is obtained from the fit, assuming that the uncertainties are uncorrelated among the mea-surements.
In summary, measurements are presented of the pT,
rapidity, and multiplicity distributions of K0
S and Λ
pro-duction in pp collisions at √s = 0.9 and 7 TeV with the ATLAS detector, as well as the Λ/Λ production ra-tio. The data results are compared with several recent pythiaMC models that were tuned on early LHC data and are found to describe the data significantly better
1 2 3 4 5 6 7 8 9 10 T /dpΛ dN Λ 1/N -5 10 -4 10 -3 10 -2 10 -1 10 1 ATLAS = 7 TeV s Λ -1 b µ Ldt = 190
∫
Data Pythia 6 AMBT2B Pythia 6 Z1 Pythia 6 Perugia2011 Pythia 8 4C Herwig++ [GeV/c] T p 1 2 3 4 5 6 7 8 9 10 Ratio 0.5 1 1.5 2 2.5 3 Data Uncertainties MC / DataFIG. 14. The corrected pTdistribution of Λ baryons in 7 TeV data compared with the hadron-level distributions in the MC samples for a variety of tunes, normalized to unity. The bot-tom part of the plot shows the ratio of the MC and data distributions, with the shaded band showing the statistical and systematic uncertainties on the data sample added in quadrature.
than the previous generation of tunes. All pythia tunes underestimate the production of KS0 mesons per event
and overestimate the production of Λ baryons per event. The herwig++ tunes significantly disagree with data in both pT and multiplicity at the respective energies.
Despite the general improvement in the agreement with data, no considered model agrees in both the pTand
mul-tiplicity quantities simultaneously, indicating the need for further model development. The Λ/Λ ratio is consistent with unity in data, indicating that no significant trans-port of baryon number to mid-rapidities is present, in accordance with SM predictions and measurements from other experiments.
IX. ACKNOWLEDGEMENTS
We thank CERN for the very successful operation of the LHC, as well as the support staff from our institutions without whom ATLAS could not be operated efficiently. We acknowledge the support of ANPCyT, Argentina; YerPhI, Armenia; ARC, Australia; BMWF, Austria; ANAS, Azerbaijan; SSTC, Belarus; CNPq and FAPESP, Brazil; NSERC, NRC and CFI, Canada; CERN;
CON--2.5 -2 -1.5 -1 -0.5 0 0.5 1 1.5 2 2.5 /dyΛ dN Λ 1/N 0.05 0.1 0.15 0.2 0.25 0.3 0.35 0.4 0.45 ATLAS = 7 TeV s Λ -1 b µ Ldt = 190
∫
Data Pythia 6 AMBT2B Pythia 6 Z1 Pythia 6 Perugia2011 Pythia 8 4C Herwig++ y -2.5 -2 -1.5 -1 -0.5 0 0.5 1 1.5 2 2.5 Ratio 0.7 0.8 0.9 1 1.1 1.2 1.3 1.4 Data Uncertainties MC / DataFIG. 15. The corrected rapidity distribution of Λ baryons in 7 TeV data compared with the hadron-level distributions in the MC samples for a variety of tunes, normalized to unity. The bottom part of the plot shows the ratio of the MC and data distributions, with the shaded band showing the statis-tical and systematic uncertainties on the data sample added in quadrature.
ICYT, Chile; CAS, MOST and NSFC, China; COL-CIENCIAS, Colombia; MSMT CR, MPO CR and VSC CR, Czech Republic; DNRF, DNSRC and Lundbeck Foundation, Denmark; ARTEMIS, European Union; IN2P3-CNRS, CEA-DSM/IRFU, France; GNAS, Geor-gia; BMBF, DFG, HGF, MPG and AvH Foundation, Germany; GSRT, Greece; ISF, MINERVA, GIF, DIP and Benoziyo Center, Israel; INFN, Italy; MEXT and JSPS, Japan; CNRST, Morocco; FOM and NWO, Netherlands; RCN, Norway; MNiSW, Poland; GRICES and FCT, Portugal; MERYS (MECTS), Romania; MES of Rus-sia and ROSATOM, RusRus-sian Federation; JINR; MSTD, Serbia; MSSR, Slovakia; ARRS and MVZT, Slovenia; DST/NRF, South Africa; MICINN, Spain; SRC and Wallenberg Foundation, Sweden; SER, SNSF and Can-tons of Bern and Geneva, Switzerland; NSC, Taiwan;
TAEK, Turkey; STFC, the Royal Society and Lever-hulme Trust, United Kingdom; DOE and NSF, United States of America.
The crucial computing support from all WLCG part-ners is acknowledged gratefully, in particular from CERN and the ATLAS Tier-1 facilities at TRIUMF (Canada), NDGF (Denmark, Norway, Sweden), CC-IN2P3 (France), KIT/GridKA (Germany), INFN-CNAF (Italy), NL-T1 (Netherlands), PIC (Spain), ASGC (Tai-wan), RAL (UK) and BNL (USA) and in the Tier-2 fa-cilities worldwide. 0 1 2 3 4 Λ /dN ev dN ev 1/N 0 0.2 0.4 0.6 0.8 Data Pythia 6 AMBT2B Pythia 6 Z1 Pythia 6 Perugia2011 Pythia 8 4C Herwig++ ATLAS = 7 TeV s Λ -1 b µ Ldt = 190
∫
multiplicity Λ 0 1 2 3 Ratio 1 2 Data Uncertainties MC / DataFIG. 16. The corrected multiplicity distribution of Λ baryons in 7 TeV data compared with the hadron-level distributions in the MC samples for a variety of tunes, which are normalized to unity. The bottom part of the plot shows the ratio of the MC and data distributions, with the shaded band showing the statistical and systematic uncertainties on the data sample added in quadrature.
[1] ALICE Collaboration, Eur. Phys. J. C 71, 1594 (2011). [2] CMS Collaboration, JHEP 05 (2011) 064.
[3] CDF Collaboration, Phys. Rev. D 72, 052001 (2005). [4] A. Capella et al., Phys. Rep. 236, 225 (1994); A.B.
Kaidalov and K.A. Ter-Martirosyan, Sov. J. Nucl. 411 Phys. 39, 1545 (1984).
[5] G.C. Rossi and G. Veneziano, Nucl. Phys. B123, (1977) 507; X. Artru, Nucl. Phys. B85, 442 (1975); M. Imachi, S.
0.5 1 1.5 2 2.5 3 3.5 T /dpΛ dN Λ 1/N -2 10 -1 10 1 ATLAS = 900 GeV s Λ -1 b µ Ldt = 7
∫
Data Pythia 6 AMBT2B Pythia 6 Z1 Pythia 6 Perugia2011 Pythia 8 4C Herwig++ [GeV/c] T p 0.5 1 1.5 2 2.5 3 3.5 Ratio 0.6 0.8 1 1.2 1.4 1.6 1.8 Data Uncertainties MC / DataFIG. 17. The corrected pT distribution of Λ baryons in
900 GeV data compared with the hadron-level distributions in the MC samples for a variety of tunes, normalized to unity. The bottom part of the plot shows the ratio of the MC and data distributions, with the shaded band showing the statis-tical and systematic uncertainties on the data sample added in quadrature.
Otsuki and F. Toyoda, Prog. Theor. Phys. 52, 341 (1974); Prog. Theor. Phys. 54, 280 (1975); B.Z. Kopeliovich, Sov. J. Nucl. Phys. 45, 1078 (1987); B.Z. Kopeliovich, B. Povh, Z. Phys. C75, 693 (1997); B.Z. Kopeliovich, B. Povh, Phys. Lett. B446, 321 (1999); D. Kharzeev, Phys. Lett. B378, 238 (1996); C. Merino et al., Eur.Phys.J. C54 577 (2008); C. Merino, M.M. Ryzhinskiy, Yu.M. Shabel-ski, arXiv:0906.2659; S. E. Vance and M. Gyulassy, Phys. Rev. Lett. 83, 1735 (1999).
[6] ATLAS Collaboration, New J. Phys. 13 (2011) 053033. [7] The ATLAS reference system is a Cartesian right-handed
coordinate system, with the nominal collision point at the origin. The counter-clockwise beam direction defines the positive z-direction, while the positive x-direction is defined as pointing from the collision point to the center of the LHC ring and the positive y-axis points upwards. The azimuthal angle φ is measured around the beam axis and the polar angle θ is measured with respect to the z-axis. The pseudorapidity is defined as η = − ln [tan(θ/2)], while the rapidity is defined as y =1
2ln E+pL
E−pL, where E
is the particle energy and pLis the particle momentum along the z-axis.
[8] ATLAS Collaboration, JINST 3 (2008) S08003.
[9] L. Evans, (ed.) and P. Bryant, (ed.), JINST 3 (2008) S08001.
[10] T. Sjostrand, S. Mrenna, and P. Skands, JHEP 05 (2006)
-2.5 -2 -1.5 -1 -0.5 0 0.5 1 1.5 2 2.5 /dyΛ dN Λ 1/N 0.05 0.1 0.15 0.2 0.25 0.3 0.35 0.4 0.45 ATLAS = 900 GeV s Λ -1 b µ Ldt = 7
∫
Data Pythia 6 AMBT2B Pythia 6 Z1 Pythia 6 Perugia2011 Pythia 8 4C Herwig++ y -2.5 -2 -1.5 -1 -0.5 0 0.5 1 1.5 2 2.5 Ratio 0.6 0.8 1 1.21.4 Data UncertaintiesMC / Data
FIG. 18. The corrected rapidity distribution of Λ baryons in 900 GeV data compared with the hadron-level distributions in the MC samples for a variety of tunes, normalized to unity. The bottom part of the plot shows the ratio of the MC and data distributions, with the shaded band showing the statis-tical and systematic uncertainties on the data sample added in quadrature.
026.
[11] ATLAS Collaboration, ATLAS Monte Carlo Tunes for MC09, ATL-PHYS-PUB-2010-002.
[12] geant4 Collaboration, S. Agostinelli et al., Nucl. Instr. Meth. A506 (2003) 250303.
[13] R. Engel, Z. Phys. C66 (1995) 203-214.
[14] ATLAS Collaboration, ATLAS tunes of pythia6 and
pythia8for MC11, ATL-PHYS-PUB-2011-009.
[15] J. Pumplin et al., JHEP 07 (2002), 012. [16] P. Skands, Phys. Rev. D 82, 074018 (2010).
[17] CTEQ Collaboration, Eur. Phys. J. C 12 (2000) 375. [18] R. Field, Early LHC Underlying Event Data - Findings
and Surprises (2010), arXiv:1010.3558.
[19] T. Sjostrand, S. Mrenna, and P. Skands, Comput. Phys. Comm. 178 (2008).
[20] R. Corke and T. Sjostrand, JHEP 03 (2011) 032. [21] M. Bahr et al., Eur. Phys. J. C 58 (2008), 639-707. [22] S. Gieseke, et al., herwig++ 2.5 Release Note (2011),
arXiv:1102.1672.
[23] http://projects.hepforge.org/herwig/trac/wiki/MB UE tunes. [24] A. Sherstnev and R. S. Thorne, Eur. Phys. J. C 55 (2008),
553-575.
[25] ATLAS Collaboration, Performance of the ATLAS Sili-con Pattern Recognition Algorithm in Data and
Simula-tion at√s = 7 TeV, ATLAS-CONF-2010-072.
0 1 2 3 4 Λ /dN ev dN ev 1/N 0 0.2 0.4 0.6 0.8 1 Data Pythia 6 AMBT2B Pythia 6 Z1 Pythia 6 Perugia2011 Pythia 8 4C Herwig++ ATLAS = 900 GeV s Λ -1 b µ Ldt = 7
∫
multiplicity Λ 0 1 2 3 Ratio 0.5 1 1.52 Data UncertaintiesMC / Data
FIG. 19. The corrected multiplicity distribution of Λ baryons in 900 GeV data compared with the hadron-level distributions in the MC samples for a variety of tunes, which are normalized to unity. The bottom part of the plot shows the ratio of the MC and data distributions, with the shaded band showing the statistical and systematic uncertainties on the data sample added in quadrature. |y| 0 0.5 1 1.5 2 2.5 ) Λ / Λ ratio( 0.2 0.4 0.6 0.8 1 1.2 Data Pythia 6 AMBT2B Pythia 6 Z1 Pythia 6 Perugia2011 Pythia 8 4C Herwig++ ATLAS = 7 TeV s -1 b µ Ldt = 190
∫
FIG. 20. The production ratio between Λ and Λ baryons in 7 TeV data versus the absolute value of the rapidity. The error bars show the statistical uncertainties while the band shows statistical and systematic uncertainties added in quadrature.
to Monte Carlo simulation at√s = 900 GeV,
ATLAS-CONF-2010-011.
[27] K. Nakamura et al. (Particle Data Group), J. Phys. G 37, 075021 (2010).
[28] ATLAS Collaboration, JINST 3 (2008) P04003.
[29] ALICE Collaboration, Phys. Rev. Lett. 105, 072002 (2010).
[30] ATLAS Collaboration, dE/dx measurement in the AT-LAS Pixel Detector and its use for particle identification, ATLAS-CONF-2011-16.
[31] LHCb Collaboration, Measurement of V0
production
ratios in pp collisions at √s = 0.9 and 7 TeV,
arXiv:1107.0882.
[32] STAR Collaboration, Phys. Rev. C 75, 064901 (2007).
[GeV] T p 0.5 1 1.5 2 2.5 3 3.5 4 ) Λ / Λ ratio( 0.2 0.4 0.6 0.8 1 1.2 Data Pythia 6 AMBT2B Pythia 6 Z1 Pythia 6 Perugia2011 PYTHIA 8 4C Herwig++ ATLAS = 7 TeV s -1 b µ Ldt = 190
∫
FIG. 21. The production ratio between Λ and Λ baryons in 7 TeV data versus pT. The error bars show the statistical uncertainties while the band shows statistical and systematic uncertainties added in quadrature.
|y| 0 0.5 1 1.5 2 2.5 ) Λ / Λ ratio( 0.2 0.4 0.6 0.8 1 1.2 Data Pythia 6 AMBT2B Pythia 6 Z1 Pythia 6 Perugia2011 Pythia 8 4C Herwig++ ATLAS = 900 GeV s -1 b µ Ldt = 7
∫
FIG. 22. The production ratio between Λ and Λ baryons in 900 GeV data versus the absolute value of the rapidity. The error bars show the statistical uncertainties while the band shows statistical and systematic uncertainties added in quadrature.
[GeV] T p 0.5 1 1.5 2 2.5 3 3.5 ) Λ / Λ ratio( 0.4 0.6 0.8 1 1.2 1.4 1.6 1.8 2 Data Pythia 6 AMBT2B Pythia 6 Z1 Pythia 6 Perugia2011 Pythia 8 4C Herwig++ ATLAS = 900 GeV s -1 b µ Ldt = 7
∫
FIG. 23. The production ratio between Λ and Λ baryons in 900 GeV data versus pT. The error bars show the statistical uncertainties while the band shows statistical and systematic uncertainties added in quadrature.
y ∆ 2 3 4 5 6 7 8 9 10 ) Λ / Λ ratio( 0.2 0.4 0.6 0.8 1 1.2 ATLAS = 7 TeV s ATLAS data - = 900 GeV s ATLAS data - = 7 TeV s LHCb data - = 900 GeV s LHCb data - = 200 GeV s STAR data -
FIG. 24. The production ratio between Λ and Λ baryons measured by ATLAS and other experiments versus the rapid-ity difference with respect to the beam. The error bars on the ATLAS data show statistical and systematic uncertain-ties added in quadrature. The solid line shows the fit to all data points described in the text.
The ATLAS Collaboration
G. Aad48, B. Abbott111, J. Abdallah11,
A.A. Abdelalim49, A. Abdesselam118, O. Abdinov10,
B. Abi112, M. Abolins88, H. Abramowicz153,
H. Abreu115, E. Acerbi89a,89b, B.S. Acharya164a,164b,
D.L. Adams24, T.N. Addy56, J. Adelman175,
M. Aderholz99, S. Adomeit98, P. Adragna75,
T. Adye129, S. Aefsky22, J.A. Aguilar-Saavedra124b,a,
M. Aharrouche81, S.P. Ahlen21, F. Ahles48,
A. Ahmad148, M. Ahsan40, G. Aielli133a,133b,
T. Akdogan18a, T.P.A. ˚Akesson79, G. Akimoto155,
A.V. Akimov94, A. Akiyama67, M.S. Alam1,
M.A. Alam76, J. Albert169, S. Albrand55, M. Aleksa29,
I.N. Aleksandrov65, F. Alessandria89a, C. Alexa25a,
G. Alexander153, G. Alexandre49, T. Alexopoulos9,
M. Alhroob20, M. Aliev15, G. Alimonti89a, J. Alison120, M. Aliyev10, P.P. Allport73, S.E. Allwood-Spiers53,
J. Almond82, A. Aloisio102a,102b, R. Alon171,
A. Alonso79, B. Alvarez Gonzalez88,
M.G. Alviggi102a,102b, K. Amako66, P. Amaral29,
C. Amelung22, V.V. Ammosov128, A. Amorim124a,b,
G. Amor´os167, N. Amram153, C. Anastopoulos29,
L.S. Ancu16, N. Andari115, T. Andeen34, C.F. Anders20,
G. Anders58a, K.J. Anderson30, A. Andreazza89a,89b,
V. Andrei58a, M-L. Andrieux55, X.S. Anduaga70,
A. Angerami34, F. Anghinolfi29, N. Anjos124a,
A. Annovi47, A. Antonaki8, M. Antonelli47,
A. Antonov96, J. Antos144b, F. Anulli132a, S. Aoun83,
L. Aperio Bella4, R. Apolle118,c, G. Arabidze88,
I. Aracena143, Y. Arai66, A.T.H. Arce44,
J.P. Archambault28, S. Arfaoui83, J-F. Arguin14,
E. Arik18a,∗, M. Arik18a, A.J. Armbruster87,
O. Arnaez81, A. Artamonov95, G. Artoni132a,132b,
D. Arutinov20, S. Asai155, R. Asfandiyarov172, S. Ask27,
B. ˚Asman146a,146b, L. Asquith5, K. Assamagan24,
A. Astbury169, A. Astvatsatourov52, G. Atoian175,
B. Aubert4, E. Auge115, K. Augsten127,
M. Aurousseau145a, G. Avolio163, R. Avramidou9,
D. Axen168, C. Ay54, G. Azuelos93,d, Y. Azuma155,
M.A. Baak29, G. Baccaglioni89a, C. Bacci134a,134b,
A.M. Bach14, H. Bachacou136, K. Bachas29, G. Bachy29,
M. Backes49, M. Backhaus20, E. Badescu25a,
P. Bagnaia132a,132b, S. Bahinipati2, Y. Bai32a,
D.C. Bailey158, T. Bain158, J.T. Baines129,
O.K. Baker175, M.D. Baker24, S. Baker77, E. Banas38,
P. Banerjee93, Sw. Banerjee172, D. Banfi29,
A. Bangert137, V. Bansal169, H.S. Bansil17, L. Barak171,
S.P. Baranov94, A. Barashkou65, A. Barbaro Galtieri14, T. Barber27, E.L. Barberio86, D. Barberis50a,50b,
M. Barbero20, D.Y. Bardin65, T. Barillari99,
M. Barisonzi174, T. Barklow143, N. Barlow27,
B.M. Barnett129, R.M. Barnett14, A. Baroncelli134a,
G. Barone49, A.J. Barr118, F. Barreiro80, J. Barreiro
Guimar˜aes da Costa57, R. Bartoldus143, A.E. Barton71, V. Bartsch149, R.L. Bates53, L. Batkova144a,
J.R. Batley27, A. Battaglia16, M. Battistin29,
G. Battistoni89a, F. Bauer136, H.S. Bawa143,e,
B. Beare158, T. Beau78, P.H. Beauchemin161,
R. Beccherle50a, P. Bechtle41, H.P. Beck16, S. Becker98,
M. Beckingham138, K.H. Becks174, A.J. Beddall18c,
A. Beddall18c, S. Bedikian175, V.A. Bednyakov65,
C.P. Bee83, M. Begel24, S. Behar Harpaz152,
P.K. Behera63, M. Beimforde99,
C. Belanger-Champagne85, P.J. Bell49, W.H. Bell49,
G. Bella153, L. Bellagamba19a, F. Bellina29,
M. Bellomo29, A. Belloni57, O. Beloborodova107,
K. Belotskiy96, O. Beltramello29, S. Ben Ami152,
O. Benary153, D. Benchekroun135a, C. Benchouk83,
M. Bendel81, N. Benekos165, Y. Benhammou153,
D.P. Benjamin44, M. Benoit115, J.R. Bensinger22,
K. Benslama130, S. Bentvelsen105, D. Berge29,
E. Bergeaas Kuutmann41, N. Berger4, F. Berghaus169, E. Berglund49, J. Beringer14, P. Bernat77,
R. Bernhard48, C. Bernius24, T. Berry76,
A. Bertin19a,19b, F. Bertinelli29, F. Bertolucci122a,122b,
M.I. Besana89a,89b, N. Besson136, S. Bethke99,
W. Bhimji45, R.M. Bianchi29, M. Bianco72a,72b,
O. Biebel98, S.P. Bieniek77, K. Bierwagen54,
J. Biesiada14, M. Biglietti134a,134b, H. Bilokon47,
M. Bindi19a,19b, S. Binet115, A. Bingul18c,
C. Bini132a,132b, C. Biscarat177, U. Bitenc48,
K.M. Black21, R.E. Blair5, J.-B. Blanchard115,
G. Blanchot29, T. Blazek144a, C. Blocker22, J. Blocki38, A. Blondel49, W. Blum81, U. Blumenschein54,
G.J. Bobbink105, V.B. Bobrovnikov107,
S.S. Bocchetta79, A. Bocci44, C.R. Boddy118,
M. Boehler41, J. Boek174, N. Boelaert35, S. B¨oser77,
J.A. Bogaerts29, A. Bogdanchikov107, A. Bogouch90,∗,
C. Bohm146a, V. Boisvert76, T. Bold37, V. Boldea25a,
N.M. Bolnet136, M. Bona75, V.G. Bondarenko96,
M. Bondioli163, M. Boonekamp136, G. Boorman76,
C.N. Booth139, S. Bordoni78, C. Borer16, A. Borisov128,
G. Borissov71, I. Borjanovic12a, S. Borroni87, K. Bos105,
D. Boscherini19a, M. Bosman11, H. Boterenbrood105, D. Botterill129, J. Bouchami93, J. Boudreau123,
E.V. Bouhova-Thacker71, C. Bourdarios115,
N. Bousson83, A. Boveia30, J. Boyd29, I.R. Boyko65,
N.I. Bozhko128, I. Bozovic-Jelisavcic12b, J. Bracinik17,
A. Braem29, P. Branchini134a, G.W. Brandenburg57,
A. Brandt7, G. Brandt15, O. Brandt54, U. Bratzler156,
B. Brau84, J.E. Brau114, H.M. Braun174, B. Brelier158,
J. Bremer29, R. Brenner166, S. Bressler152,
D. Breton115, D. Britton53, F.M. Brochu27, I. Brock20,
R. Brock88, T.J. Brodbeck71, E. Brodet153,
F. Broggi89a, C. Bromberg88, G. Brooijmans34, W.K. Brooks31b, G. Brown82, H. Brown7,
P.A. Bruckman de Renstrom38, D. Bruncko144b,
R. Bruneliere48, S. Brunet61, A. Bruni19a, G. Bruni19a,
M. Bruschi19a, T. Buanes13, F. Bucci49, J. Buchanan118,
N.J. Buchanan2, P. Buchholz141, R.M. Buckingham118,
A.G. Buckley45, S.I. Buda25a, I.A. Budagov65,
B. Budick108, V. B¨uscher81, L. Bugge117,
D. Buira-Clark118, O. Bulekov96, M. Bunse42,
T. Buran117, H. Burckhart29, S. Burdin73, T. Burgess13,