Instituto Politécnico de V
iseu
Escola Superior de
Tecnologia e Gestão de V
iseu
Brigida MauroBehavior of pellets combustion produced with pine and
RDF (Refused derived fuel) in a domestic boiler.
Tese de Mestrado
Master in Environmental Technologies
Professora Doutora Isabel Paula Lopes Brás
July 2019
i
A me ed al coraggio. Ai cambiamenti ed alle opportunità. A Mario,mio fratello,che mi insegna cosa vuol dire lottare.
A mamma, papà e al loro infinito amore. Alla mia Nonna Rosetta, mia zia Dani e i miei zii Lello ed Ernesto,per l’amore che mi hanno fatto sentire anche quando ero tanto lontana.
iii Resumo
O principal objectivo deste trabalho é a avaliação das características físicas e das emissões poluentes decorrentes da combustão de peletes compostas por diferentes tipos de matérias-primas, nomeadamente o Pinus pinaster e o combustíveis derivados de resíduos (CDR). O procedimento experimental decorreu Através da utilização de utilização de uma caldeira doméstica (com potência térmica de 20 kW) tendo-se avaliado asua eficiência térmica com a utilização das diferentes misturas do materiais acima referidos.
Os peletes de pinheiro utilizados já estavam certificados de acordo com os padrões ENplus, uma vez que foram cedidos por uma produtora portuguesa. Da mesma empresa também foi cedida a madeira de pinheiro moída utilizada durante a fase de peletização no laboratório dos combustíveis compostos por diferentes percentagens de pinheiro e CDR. Este último foi cedido pelo sistema de gestão de resíduos sólidos urrbanos da Associaçao de Municípios da Região do Planalto Beirão.
Inicilamente começou-se por preparar as misturas dos dois tipos de matérias-primas (pinho e CDR) em três percentagens: 5% de CDR / 95% de pinus, 10% de CDR / 90% de pinus e 15% de CDR / 85% de pinho, avaliando como comparação peletes apenas de pinho. As análises físicas foram então realizadas na matéria-prima (teor de humidade e análise granulométrica). Após o preparação, as características das peletes foram avaliadas (humidade, durabilidade mecânica, teor de finos, tamanho e densidade aparente). Posteriormente, foi avaliada a combustão, nomeadmanete a efeciência da calderia e as emissoes gasosas resultantes do processo, apenas com a carga térmica "alta" na caldeira.
Durante a combustão, a eficiência térmica foi determinada usando o método direto e, em particular, os parâmetros registrados no estado estacionário. No mesmo regime, foram analisadas as emissões poluentes (CO, NOx e CO2) e compostos orgânicos voláteis (COV).
Os resultados mostram que a eficiência térmica foi maior no caso de peletes de pinho (cerca de 61%), como esperado, mas foi quase similar no caso dos três tipos de pellets compostos por diferentes percentuais de pinus e CDR (cerca de 50%).
Os níveis de emissões de CO, CO2 e NOx, como esperado, são maiores no caso de
peletes com CDR em comparação com peletes de pinheiro (100% de pinho). As emissões de CO, em particular, são de cerca de 379 ppm no caso de peletes formados a partir de pinheiro e cerca de 498 ppm e 442 ppm, respectivamente, no caso de peletes formados por 10% e 15% de CDR. A diferença é menos evidente no caso das emissões de CO2, mas é patente no caso
das emissões de NOx e NO. De facto, para o NOx existem emissões de cerca de 90, 150 e 164
ppm, respectivamente, para combustíveis formados por pinho, 10% e 15% de RDF. A mesma tendência ocorre no caso das emissões de NO.
v Abstact
The main object of this work is the evaluation of the physical characteristics and the pollutant emissions resulting from the combustion of pellets composed of different types of raw material, namely Pinus pinaster and refused derived fuel (RDF). The thermal efficiency of the domestic boiler (with a thermal output of 20kW) used in the experiments was also evaluated.
The pine pellets used were already certified according to ENplus standards as they were ceded by a Portuguese manufacturer. From the same company was also ceded the milled pine wood used during the pelletizing phase, performed in the laboratory, of fuels composed of different percentages of pine and RDF. This last one was provided by the Assocaiaçã de Municipios da Região do Planalto Beirão waste management system.
The first step was to mix the two types of raw material (pine and RDF) in three differents percentages: 5% of RDF/95% of pine, 10% of RDF/90% of pine and 15% of RDF/85 % of pine, having 100% pine as reference. Then the physical analyzes on the raw material were performerd (humidity content and particle size distribution). After their pelettization, the characteristics of the experimental pellets were evaluated (humidity content, durability, fine content, dimensions and bulk density).
During the combustion, with the "high" thermal load, the thermal efficiency was determined using the direct method through parameters recorded in the stationary regime. In the same regime the pollutant emissions (CO, NOx and CO2) were analysed, as well as the
volatile organic compounds (VOCs).
The results show that the thermal efficiency was higher in the case of pine pellets (about 61%), as expected, but it was almost similar in the cases of the three types of pellets composed of different percentages of pine and RDF (approx. 50%).
The levels of CO, CO2 and NOx emissions, as expected, are higher in the case of
pellets also formed by RDF compared to pine. The CO emissions in particular are about 379 ppm in the case of pellets formed from pine and about 498 ppm and 442 ppm respectively in the case of pellets formed by 10% and 15% of RDF. The difference is less evident in the case of CO2 emissions but very evident in the case of NOx and NO emissions. In fact, for NOx
there are emissions of about 90, 150 and 164 ppm respectively for fuels formed by pine, 10% and 15% of RDF. The same tendency will occur in the case of the NO emissions.
vii Astratto
Lo scopo principale di questo lavoro è la valutazione delle caratteristiche fisiche e delle emissioni inquinanti derivanti dalla combustione di pellet composti da diversi tipi di materie prime, vale a dire Pinus pinaster e combustibile solido secondario (CSS). È stata anche valutata l'efficienza termica della caldaia domestica (con una potenza termica di 20 kW) utilizzata negli esperimenti.
I pellet di pino usati erano già certificati secondo gli standard ENplus in quanto ceduti da un produttore portoghese. Dalla stessa azienda è stato anche ceduto il legno di pino macinato utilizzato durante la fase di pellettizzazione, eseguita in laboratorio, di combustibili composti da diverse percentuali di pino e CSS. Quest'ultimo è stato fornito dal sistema di gestione dei rifiuti di Associazione di comuni della regioni di Planalto Beirão.
Il primo passo consisteva nel mescolare i due tipi di materie prime (pino e CSS) in tre percentuali diverse: 5% di CSS / 95% di pino, 10% di CSS / 90% di pino e 15% di CSS / 85% di pino, con pino al 100% come riferimento. Poi sono state eseguite le analisi fisiche sulla materia prima (contenuto di umidità e distribuzione delle dimensioni delle particelle). Dopo la loro pelettizzazione, sono state valutate le caratteristiche del pellet sperimentale (contenuto di umidità, durata, contenuto fine, dimensioni e densità apparente).
Durante la combustione, con il carico termico "alto", l'efficienza termica è stata determinata utilizzando il metodo diretto attraverso i parametri registrati nel regime stazionario. Nello stesso regime sono state analizzate le emissioni inquinanti (CO, NOx e
CO2), nonché i composti organici volatili (COVs).
I risultati mostrano che l'efficienza termica era maggiore nel caso di pellet di pino (circa il 61%), come previsto, ma era quasi simile nei casi dei tre tipi di pellet composti da diverse percentuali di pino e CSS (circa 50 %).
I livelli di emissioni di CO, CO2 e NOx, come previsto, sono più alti nel caso di pellet
formato anche da CSS rispetto al pino. Le emissioni di CO in particolare sono circa 379 ppm nel caso di granuli formati da pino e circa 498 ppm e 442 ppm rispettivamente nel caso di pellet formato dal 10% e dal 15% di CSS. La differenza è meno evidente nel caso delle emissioni di CO2, ma molto evidente nel caso delle emissioni di NOx e NO. Infatti, per NOx ci
sono emissioni di circa 90, 150 e 164 ppm rispettivamente per i combustibili formati da pino, il 10% e il 15% di CSS. La stessa tendenza si verificherà nel caso del NO inquinante.
Palavras-chave: combustão, pellet, CDR (combustível derivado recusado),pinho,caldeira doméstica, biomassa.
Keywords: combustion, pellet, RDF (Refused derived fuel), pine, domestic boiler, biomass. Parole chiave: combustion, pellet, CSS (Combustibile solido secondario), pino, caldaia domestica, biomassa.
ix
ACKNOWLEDGMENT
I thank Professor Isabel Brás who supported me in my work and gave me opportunities that I never thought I could have. Thank you Professor Isabel because the "Pizza de batata" was an exchange of cultures but above all an act of strong friendship.
I thank Professor Massimiliano Fabbricino who trusted me from day one and allowed me to create a small but great experience that has opened the way to so many opportunities.
I thank sweet Tania, my laboratory tutor, but above all my great Portuguese friend. Thank you for sharing your knowledge with me and supporting me. Thank you for having endured all my "Sorry Tania..the last question please!" And thank you for being my Portuguese home.
I thank Manuela for showing us the best side of Portugal, all its features and its potential. Thank you ―Mon ami‖.
I thank Professor Carlos Pereira for providing me with the laboratory, the material and his knowledge.
I thank Professor Edmundo Marques who has dedicated much of his time and curiosity to my research, giving me many tips and above all a lot of confidence.
I thank my companions of the student residence (Jessica, Maja, Tünde, Pia, Maaike, Beyhan, Kübra, Elena (even though she didn't live with us!)) who always welcomed me with a smile after a busy day of work. I thank them because they made me smile even when I didn't feel like it. And with them I thank all my companions on this fantastic journey that was the Erasmus.
I thank my friend Jessica for having been my home.
Finally I feel the need to thank the magnificent country of Portugal, thanks for everything.
INDEX
GENERAL INDEX
1. Introduction ... 1
1.1. Work objective and procedure ... 2
1.2. Work organization ... 2
1.3. Work schedule ... 3
2. Literature Review ... 5
2.1. Fossil fuels and biomass ... 5
2.2. What are RDFs ... 5
2.3. Objectives of Europe ... 7
2.4. Pellets and their development ... 8
2.5. ENplus Normative ... 10 2.6. Combustion ... 12 2.6.1. Stationary regime ... 13 2.6.2. Biomass combustion ... 13 2.6.3. Gaseous emissions ... 15 2.6.3.1. CO and CO2 emissions ... 15 2.6.3.2. NOx emissions ... 16
2.6.4. Volatile organic compounds (VOCs) ... 17
2.6.5. Advantages and disadvantages of co-combustion of RDF pellets and biomass 18 3. Experimental procedure ... 20
3.1. Milling Process ... 20
3.2. Characterization of the raw material ... 20
3.2.1. Humidity content... 20
3.2.2. Particle size distribution ... 22
3.3. Pelletizing phase ... 24
3.4. Characterization of pellets ... 25
xiii
3.4.3. Density ... 26
3.4.3.1. Mass ... 26
3.4.3.2. Particle density ... 26
3.4.3.3. Bulk density ... 27
3.4.4. Fine dust content ... 28
3.4.5. Mechanical durability ... 28
3.5. Burning Tests ... 30
3.5.1. Experimental setup of burning tests ... 30
3.5.1.1. The thermal load ... 32
3.5.2. The combustion test ... 33
3.5.2.1. Thermal efficiency of the boiler ... 33
3.5.2.1.1. The lower heating value (LHV) ... 34
3.5.3. Gas emissions ... 34
4. Evaluation of results and discussion ... 37
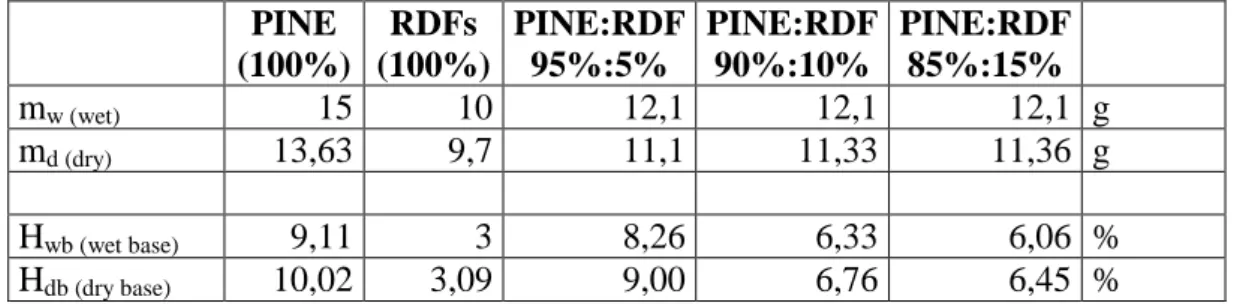
4.1. Characterization of the raw material ... 37
4.1.1. Humidity content ... 37
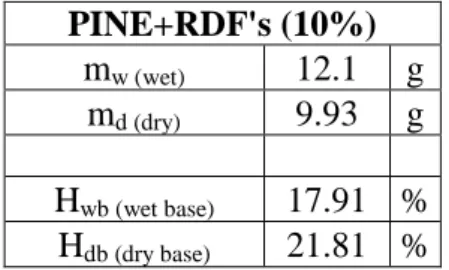
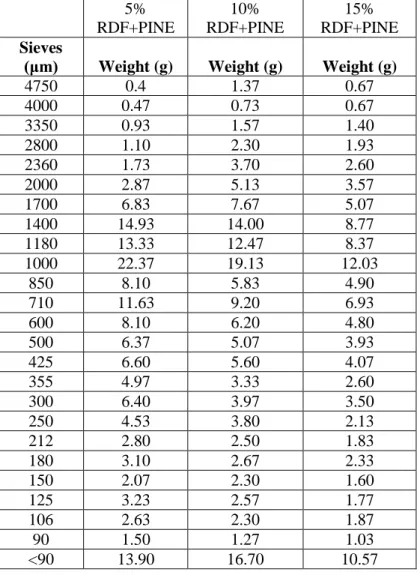
4.1.2. Particle size distribution ... 39
4.1.3. Pelletizing phase and humidity of the pellets ... 44
4.1.4. The influence of lignin ... 45
4.2. Pellet characterization ... 46
4.2.1. Mass ... 46
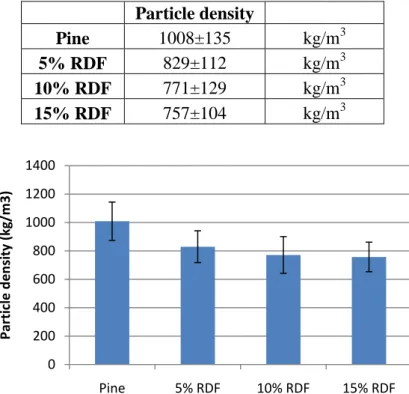
4.2.2. Diameter, length and density ... 47
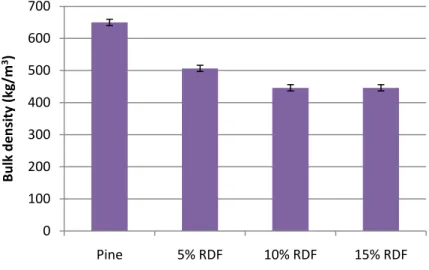
4.2.3. Bulk density ... 50
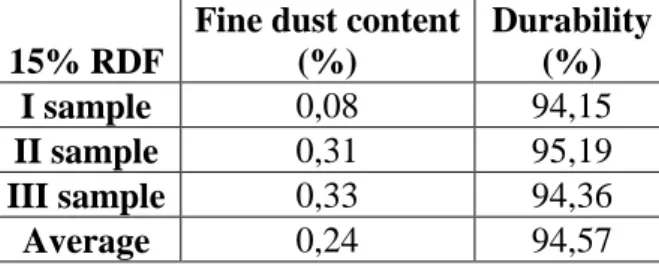
4.2.4. Fines content and mechanical durability ... 51
4.2.5. Chemical characterization of pellets ... 54
4.3. Burning Tests ... 55
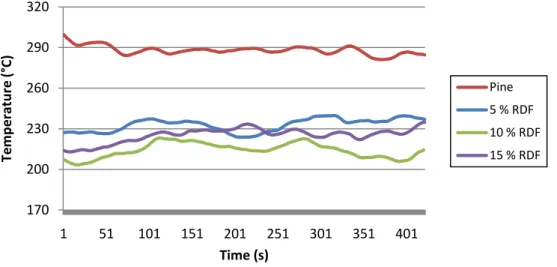
4.3.1. Temperature of gases during the stationary regime ... 55
4.3.2. Evaluation of thermal efficiency ... 57
4.3.2.1 LHV calculation and evaluation ... 58
4.3.3. CO, CO2 and NOx emissions ... 59
INDEX
4.3.3.1.1. The influence of mechanical durability and temperature on CO
emissions 62
4.3.3.2. NOx emissions ... 63
4.3.4. Volatile organic compounds (VOCs) ... 65
5. Conclusions ... 69
6. Bibliography ... 71
ANNEX 1- Particle size distribution ... 77
ANNEX 2- Diameter, length and mass (Volume and density) ... 85
ANNEX 3- Burning tests results ... 87
xv
IMAGES INDEX
Image 1: Waste treatment cycle (Adapted from Brás et al, 2017)... 6
Image 2: Production of Waste in EU year 2012 ( kg/person ) (Massarini and Muraro,2015). . 8
Image 3: Domestic Production and Import | Export per country for chosen countries in 2015/2016; sorted by consumption (Thrän et al. 2017)... 10
Image 4: Threshold values of the most important pellet parameters (Adapted from ENplus 14961-2). ... 11
Image 6: Stages of combustion in a forced draft suction stove (primary air and secondary air) (primary air and secondary air) (Francescato et al.,?). ... 14
Image 7: Evolution of the mass of a biomass particle during the combustion process (Dias, 2002). ... 14
Image 8: Conversion of fuel nitrogen in the case of biomass combustion (Khan et al., 2009). ... 16
Image 9 : a) Raw material (RDF) before milling ; b) Machine for milling the raw material ; c) Raw material (RDF) milled. ... 20
Image 10: a) Precision balance; b) Drying oven. ... 21
Image 11: Dryer. ... 21
Image 12: Example of raw material the 3 samples of 5% RDF + 95% pine wood. ... 21
Image 13: Retsch vibratory sieve. ... 23
Image 14: Pelletizing machine... 24
Image 15 : Digital caliper (right in its original box and left in measuring the length of a unit of pellets). ... 25
Image 16 : Pellets of only pine (pine wood 100%). ... 25
Image 17 : Pellets of RDF’s+ pine (5% RDF’s + 95% pine). ... 26
Image 18 : Pellets of RDF’s+ pine (10% RDF’s + 90% pine). ... 26
Image 19 : Pellets of RDF’s+ pine (15% RDF’s + 85% pine). ... 26
Image 20: Cup containing pine pellets used for the determination of bulk density (V = 0.0008 m3). ... 27
Image 21: Sieve used for the evaluation of fine dust content and mechanical durability (3.35 mm). ... 28
Image 22 : Aluminium (or steel) container for mechanical durability assessment. ... 29
Image 23: a) Pellet stove Meltor of 20 kW : b) Pellets of pine (100% pine wood); c) Combustion analyzer (Testo 350); d) Thermocouples for evaluating the temperature of the water entering, leaving the stove and the gases emitted; e) VOCs analyzer. ... 31
Image 24: Experimental set-up (scheme) Performance measurements. ... 32
Image 25: Cumulative curve for the three types of material composed of RDFs and pine. .... 39
Image 26: Average of the diameter for each material containing RDFs. ... 41 Image 27: a) Cumulative curve of the average mass retained as a function of the average diameter of the particles held by the sieves - Pine wood; b) Distribution of the average mass
INDEX
retained as a function of the average diameter of the particles held by the sieves - Pine wood (Ferreira, 2013). ... 42 Image 28: a) Cumulative curve of the average mass retained as a function of the average diameter of the particles held by the sieves - III sample containing 10% of RDFs; b) Distribution of the average mass retained as a function of the average diameter of the particles held by the sieves- III sample containing 10% of RDFs. ... 43 Image 29: Average values of the humidity content (%) of the four types of pellets (left); average values of mechanical durability (%) of the four types of pellets (right). ... 44 Image 30: Relation between mechanical durability (%) and humidity content (%) of the four types of pellets. ... 45 Image 31: Average mass (g) values of samples mad by 20 units of pellets (100% pine, 5% RDF, 10% RDF and 15% RDF)... 46 Image 32: Average density values (100% Pine, 5% RDF, 10% RDF and 15% RDF). ... 48 Image 33: Average diameter (mm) of the particles formed by the four different materials (on the left); Average length (mm) of the particles formed by the four different materials (right). ... 49 Image 34: Average mass (g) of the particles formed by the four different materials. ... 49 Image 35: ENplus regulation for diameter and length. ... 49 Image 36: Average values of bulk density (100% Pine, 5% RDF, 10% RDF and 15% RDF). ... 50 Image 37: Relation between durability (%) and fine dust content (%) of the four types of pellets analysed. ... 52 Image 38: Average mechanical durability values (100% pine, 5% RDF, 10% RDF and 15% RDF)... 52 Image 39: Gases temperature evolution during the combustion of the four types of pellets in the 10 minute stationary regime. ... 55 Image 40: Average thermal efficiency (%) of the four types of pellets. ... 57
Image 41: a) Oxygen (O2); b) Carbon dioxide (CO2 at 13%); c) Carbon monoxide emissions
(CO at 13%) for the four types of pellets. ... 60 Image 42: Relationship between durability (%) and CO emissions (ppm) for the four types of pellets. ... 62
Image 43: a) Emissions of nitrogen oxides (NOx) at 13% O2 for the three types of pellets; b)
Emissions of nitrogen monoxide (NO) at 13% O2 for the three types of pellets. ... 64
Image 44: Average of VOCs emissions (g/m3) during a period of 10 minutes in the stationary
regime... 65 Image 45: Sum of VOCs emissions (g/kg) during the stationary regime (10 minutes). ... 66 Image 46: Relation between VOCs emissions (g/kg) during the stationary regime and CO (ppm) emissions. ... 67
Image 47: Relation between VOCs emissions (g/kg) during the stationary regime and O2 (%).
xvii
Image 48: Relation between VOCs emissions (g/kg) during the stationary regime and Humidity (%). ... 68 Image 49: Relation between VOCs emissions (g/kg) during the stationary regime and LHV (MJ/kg). ... 68
Image A.1. 1: Particle size distribution in sieves of different meshes (5% RDF + 95% Pine). ... 77 Image A.1. 2: Granulometric curve (5% RDF + 95% Pine). ... 78 Image A.1. 3: Particle size distribution in sieves of different meshes (10% RDF + 90% Pine). ... 79 Image A.1. 4: Granulometric curve (10% RDF + 90% Pine). ... 79 Image A.1. 5: Particle size distribution in sieves of different meshes (15% RDF + 85% Pine). ... 80 Image A.1. 6: Granulometric curve (15% RDF + 85% pine). ... 81 Image A.1. 7: a) Distribution of the average mass retained as a function of the average diameter of the particles retained by the sieves; b) Cumulative curve of the average mass retained as a function of the average diameter of the particles retained by the sieves- I sample containing 5% of RDF. ... 81 Image A.1. 8: a) Distribution of the average mass retained as a function of the average diameter of the particles retained by the sieves; b) Cumulative curve of the average mass retained as a function of the average diameter of the particles retained by the sieves - II sample containing 5% of RDF. ... 81 Image A.1. 9: a) Distribution of the average mass retained as a function of the average diameter of the particles retained by the sieves; b) Cumulative curve of the average mass retained as a function of the average diameter of the particles retained by the sieves - III sample containing 5% of RDF. ... 82 Image A.1. 10: a) Distribution of the average mass retained as a function of the average diameter of the particles retained by the sieves; b) Cumulative curve of the average mass retained as a function of the average diameter of the particles retained by the sieves - I sample containing 10% of RDF. ... 82 Image A.1. 11: a) Distribution of the average mass retained as a function of the average diameter of the particles retained by the sieves; b) Cumulative curve of the average mass retained as a function of the average diameter of the particles retained by the sieves - II sample containing 10% of RDF. ... 82 Image A.1. 12: a) Distribution of the average mass retained as a function of the average diameter of the particles retained by the sieves; b) Cumulative curve of the average mass retained as a function of the average diameter of the particles retained by the sieves - III sample containing 10% of RDF. ... 83 Image A.1. 13: a) Distribution of the average mass retained as a function of the average diameter of the particles retained by the sieves; b) Cumulative curve of the average mass
INDEX
retained as a function of the average diameter of the particles retained by the sieves - I sample containing 15% of RDF. ... 83 Image A.1. 14 a) Distribution of the average mass retained as a function of the average diameter of the particles retained by the sieves; b) Cumulative curve of the average mass retained as a function of the average diameter of the particles retained by the sieves - II sample containing 15% of RDF. ... 83 Image A.1. 15: a) Distribution of the average mass retained as a function of the average diameter of the particles retained by the sieves; b) Cumulative curve of the average mass retained as a function of the average diameter of the particles retained by the sieves - III sample containing 15% of RDF. ... 84
Image A.2. 1: Values of diameter, length, mass, volume and density of 20 pellets made from 100% pine wood... 85 Image A.2. 2: Values of diameter, length, mass, volume and density of 20 pellets composed of 5% RDF + 95% pine wood. ... 85 Image A.2. 3: Values of diameter, length, mass, volume and density of 20 pellets composed of 10% RDF + 90% pine wood. ... 86 Image A.2. 4: Values of diameter, length, mass, volume and density of 20 pellets composed of 15% RDF + 85% pine wood. ... 86
Image A.3. 1: Gases temperature evolution during the combustion of pine pellets (100%). . 87 Image A.3. 2: Gases temperature evolution during the combustion of Pino pellets (100%) in the 10 minute stationary regime (1200 s-1800 s). ... 87 Image A.3. 3: Gases temperature evolution during the combustion of pine pellets of RDF (5%) + Pine (95%). ... 88 Image A.3. 4: Gases temperature evolution during the combustion of RDF pellets (5%) + Pine (95%) in the 10 minute stationary regime (1200 s-1800 s). ... 88 Image A.3. 5: Gases temperature evolution during the combustion of pine pellets of RDF (10%) + Pine (90%). ... 89 Image A.3. 6: Gases temperature evolution during the combustion of RDF pellets (10%) + Pine (90%) in the stationary regime 10 minutes (800 s-1400 s). ... 89 Image A.3. 7: Gases temperature evolution during the combustion of pine pellets of RDF (15%) + Pine (85%). ... 90 Image A.3. 8: Gases temperature evolution during the combustion of RDF pellets (15%) + Pine (85%) in the 10 minute stationary regime (800 s-1600 s). ... 90 Image A.3. 9: Gases temperature evolution during the combustion of the four types of pellets. ... 91
xix
Image A.4. 1: a) Concentration of O2 and CO2 during the combustion of pine pellets (100%
pine-test_3);b) Concentration of CO, NOx and NO during the combustion of pine pellets
(100% pine-test_3). ... 92
Image A.4. 2: a) Trend of O2 and CO2 emissions during the combustion of pine pellets (100%
pine-test_3);b) Trend of CO, NOx and NO emissions during the combustion of pine pellets
(100% pine-test_3). ... 92
Image A.4. 3: a) Concentration of O2 and CO2 during tests_5 of combustion of pine pellets
(100% pine); b) Concentration of CO, NOx and NO during the combustion of pine pellets
(100% pine). ... 93
Image A.4. 4: a) Trend of O2 and CO2 emissions during the combustion of pine pellets (100%
pine-test_5);b) Trend of CO, NOx and NO emissions during the combustion of pine pellets
(100% pine-test_5). ... 93
Image A.4. 5: a) Concentration of O2 and CO2 during the combustion of pine pellets (100%
pine-test_6);b) Concentration of CO, NOx and NO during the combustion of pine pellets
(100% pine-test_6). ... 94
Image A.4. 6: a) Trend of O2 and CO2 emissions during the combustion of pine pellets (100%
pine-test_6);b) Trend of CO, NOx and NO emissions during the combustion of pine pellets
(100% pine-test_6). ... 94
Image A.4. 7: a) Concentration of O2 and CO2 during the combustion of pine pellets
(5%RDF-test_7);b) Concentration of CO, NOx and NO during the combustion of pine pellets
(5%RDF -test_7). ... 95
Image A.4. 8: a) Trend of O2 and CO2 emissions during the combustion of pine pellets
(5%RDF -test_7);b) Trend of CO, NOx and NO emissions during the combustion of pine
pellets (5%RDF -test_7). ... 95
Image A.4. 9: a) Concentration of O2 and CO2 during the combustion of pine pellets (5%RDF
test_8);b) Concentration of CO, NOx and NO during the combustion of pine pellets (5%RDF
-test_8). ... 96
Image A.4. 10: a) Trend of O2 and CO2 emissions during the combustion of pine pellets
(5%RDF -test_8);b) Trend of CO, NOx and NO emissions during the combustion of pine
pellets (5%RDF -test_8). ... 96
Image A.4. 11: a) Concentration of O2 and CO2 during the combustion of pine pellets
(5%RDF test_9);b) Concentration of CO, NOx and NO during the combustion of pine pellets
(5%RDF -test_9). ... 97
Image A.4. 12: a) Trend of O2 and CO2 emissions during the combustion of pine pellets
(5%RDF -test_9);b) Trend of CO, NOx and NO emissions during the combustion of pine
pellets (5%RDF -test_9). ... 97
Image A.4. 13: a) Concentration of O2 and CO2 during the combustion of pine pellets
(10%RDF test_10);b) Concentration of CO, NOx and NO during the combustion of pine
INDEX
Image A.4. 14: a) Trend of O2 and CO2 emissions during the combustion of pine pellets (10%
RDF-test_10);b) Trend of CO, NOx and NO emissions during the combustion of pine pellets
(10% RDF-test_10). ... 98
Image A.4. 15: a) Concentration of O2 and CO2 during the combustion of pine pellets
(10%RDF test_12);b) Concentration of CO, NOx and NO during the combustion of pine
pellets (10%RDF -test_12). ... 99
Image A.4. 16: a) Trend of O2 and CO2 emissions during the combustion of pine pellets (10%
RDF-test_12);b) Trend of CO, NOx and NO emissions during the combustion of pine pellets
(10% RDF-test_12). ... 99
Image A.4. 17: a) Concentration of O2 and CO2 during the combustion of pine pellets
(10%RDF test_14);b) Concentration of CO, NOx and NO during the combustion of pine
pellets (10%RDF -test_14). ... 100
Image A.4. 18: a) Trend of O2 and CO2 emissions during the combustion of pine pellets (10%
RDF-test_14);b) Trend of CO, NOx and NO emissions during the combustion of pine pellets
(10% RDF-test_14). ... 100
Image A.4. 19: a) Concentration of O2 and CO2 during the combustion of pine pellets
(15%RDF test_13);b) Concentration of CO, NOx and NO during the combustion of pine
pellets (15%RDF -test_13). ... 101
Image A.4. 20: a) Trend of O2 and CO2 emissions during the combustion of pine pellets (15%
RDF-test_13);b) Trend of CO, NOx and NO emissions during the combustion of pine pellets
(15% RDF-test_13). ... 101
Image A.4. 21: a) Concentration of O2 and CO2 during the combustion of pine pellets
(15%RDF test_15);b) Concentration of CO, NOx and NO during the combustion of pine
pellets (15%RDF -test_15). ... 102
Image A.4. 22: a) Trend of O2 and CO2 emissions during the combustion of pine pellets (15%
RDF-test_15);b) Trend of CO, NOx and NO emissions during the combustion of pine pellets
(15% RDF-test_15). ... 102
Image A.4. 23: a) Concentration of O2 and CO2 during the combustion of pine pellets
(15%RDF test_16);b) Concentration of CO, NOx and NO during the combustion of pine
pellets (15%RDF -test_16). ... 103
Image A.4. 24: a) Trend of O2 and CO2 emissions during the combustion of pine pellets (15%
RDF-test_16);b) Trend of CO, NOx and NO emissions during the combustion of pine pellets
(15% RDF-test_16). ... 103
Image A.4. 25: Average O2 of tests for the four types of pellets. ... 104
Image A.4. 26: Average CO2 emissions from the combustion of the four types of pellets. . 104
Image A.4. 27: Average CO emissions of the combustion of the four types of pellets. ... 104
Image A.4. 28: Average NOx emissions from the combustion of the four types of pellets. . 105
xxi
TABLES INDEX
Table 1: Time schedule of the work carried out over the five months. ... 3 Table 2: Description of the sections of the work carried out over the five months. ... 3 Table 3: Average humidity of the studied raw materials. ... 37
Table 4: Average humidity in the raw material after adding water (RDF 10% + pine 90%). . 39
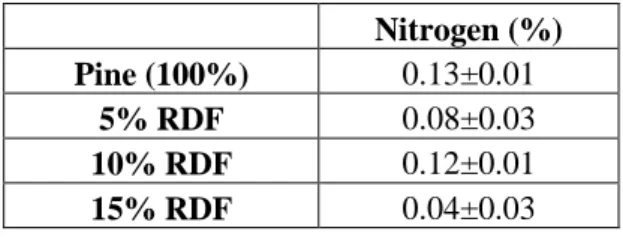
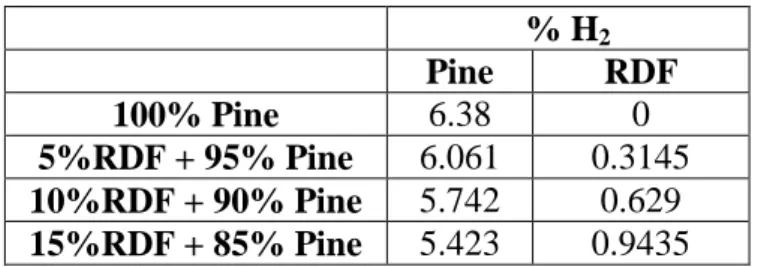
Table 5: Average mass retained by the sieves of different meshes (decreasing sieve value) for samples of each material. ... 40 Table 6: Average values of diameter, length, mass, volume and density of 20 pellets made from the four types of material. ... 47 Table 7: Average particle density values (100% pine, 5% RDF, 10% RDF and 15% RDF). 48 Table 8: Average of bulk density values (100% pine, 5% RDF, 10% RDF and 15% RDF). 50 Table 9: Values of the content of fine powders and the durability of the three pellet samples containing 5% of RDF. ... 53 Table 10: Values of the content of fine powders and the durability of the three pellet samples containing 10% of RDF. ... 53 Table 11: Values of the content of fine powders and the durability of the three pellet samples containing 15% of RDF. ... 53 Table 12: Proximate analysis (Salvati , 2019). ... 54 Table 13: Average of Nitrogen (%) contained in four types of pellet (Salvati, 2019). ... 54 Table 14: Average of Carbon (%) contained in four types of pellet. ... 55 Table 15: : Higher heating values of the four types of pellets. ... 58 Table 16: Percentages of total Hydrogen in the four types of pellets. ... 59 Table 17: Lower heating values of the four types of pellets... 59
Table 18: Average values of O2, CO and CO2 for the three types of pellets. ... 61
Table 19: Average NOx and NO values for the three types of pellets ... 64
Table 20: Sum of VOCs emissions (g/kg),O2 (%) and CO emissions (ppm) during the
stationary regime (10 minutes). ... 66
Table A.1. 1: Mass retained by sieves of different meshes (decreasing sieve value) for material samples composed of 5% RDF and 95% pine wood. ... 77 Table A.1. 2: Mass retained by sieves of different meshes (decreasing sieve value) for material samples consisting of 10% RDF and 90% pine wood. ... 78 Table A.1. 3: Mass retained by sieves of different meshes (decreasing sieve value) for material samples consisting of 15% RDF and 85% pine wood. ... 80
xxiii
ABREVIATIONS
CDR Combustíveis derivados de resíduos
CEN European committee for standardization
COV Compostos orgânicos voláteis
COV Composti organici volatili
CSS Combustibile solido secondario
EC European comission
EEA European Union Environment Agency
EU European Union
HHV Higher heating value,(kg/kJ)
ISO International organization for standardization
LHV Lower heating value,(kg/kJ)
MBT Mechanical and biological treatments
MSW Municipal solid urban waste
RDF Refused derived fuel
SRF Solid recovered fuel
i
SYMBOLS
m H2O Mass flow rate of water,(kg/s)
m pellet Pellet mass flow rate,(kg/s)
cpH2O Specific heat of the water,[kJ/(kg °C )]
masspellet Mass of the pellet (g);
PCIpellet Lower heating value (LHV) of the pellets,(kJ/kg)
Volumepellet Volume of the pellet,(m3)
ρpellet Particle density,(kg/m3)
∆T Difference between the average entering and leaving water temperatures,(°C)
BD Bulk density,(kg/m3)
D Pellet diameter,(mm)
dp Particle diameter, (mm)
dpi Arithmetic spacing average of the sieves of two subsequent sieves,(mm)
DU Mechanical durability,(%)
F Amount of fine material,(%)
ℎ Pellet length,(mm)
Hbs Dry basis humidity,(%)
Hbu Wet basis humidity,(%)
m1 Mass of the empty container,(kg)
m2 Mass of the full container,(kg)
SYMBOLS
md Dry mass of the material,(g)
mE Mass of the sample before sieving,(g)
mw Wet mass of material,(g)
V Net volume of the measuring cylinder,(m³)
xi Mass fraction of the particles of material retained in the interval i,(-)
ηT Thermal efficiency,(%)
1 1. Introduction
The final disposal of municipal solid urban waste (MSW) is still a problem in many countries, including European countries.
The increase in the price of raw materials, the lack of space for new landfills, the problems deriving from leachate and the restrictions imposed by European regulations have led to the idea of being able to use waste-derived fuels and biomass to replace fossil fuels. To do this it need an increase in the correct collection of materials and therefore of energy that lead to a lower environmental impact, lower consumption of energy resources and lower economic costs.
A system that aims good waste management pratices promotes the reduction of greenhouse gases and reduces the volumes of waste destined for landfill (Menikpura, 2013).
Another alternative to landfills is waste heat treatments and in particular refuse derived fules (RDFs) that reduce volumes, therefore spaces and through which energy is recovered (Gallardo et al., 2014). In any case, it is essential to make the correct estimate of the possible energy content of the residual fraction of the mechanical and biological treatments (MBT) and therefore of the RDF, for the planning of energy production through its combustion (Aranda et al., 2012).
The study of biomass, and therefore its quality, is essential if it is to be used for energy purposes. The energy production referred to is carried out in small domestic appliances although they do not have a high quality. All this greatly limits their use but, they have achieved good results in terms of thermal efficiency. Many studies have been carried out on the combustion of biomass and its combustion with other types of fuels and the current trend is to focus on the analysis of its characteristics especially in terms of emissions (Arranz ,?).
Biomass pellets currently play a large role in heat and energy production and the pellet market is in a phase of rapid development. In fact, it is estimated that in the future it may be one of the major sources of energy production but this leads to the realization of a good production chain. This will also be useful to make this type of fuel competitive compared to others that are generally predominant on the market (Selkimäki et al., 2010).
The objective of this work is to analyze the physical and combustion properties of commercial pine pellets and laboratory-produced pellets by combining biomass (pine wood) and RDF. The aim of the work is to be able to lay the foundations for more in-depth studies on the use of RDF for energy production.
The experimentation was conducted with the use of a domestic boiler (20kW) and all the necessary data were analysed in order to understand the combustion, although the main goal is not aimed at the use of biomass pellets (pine wood) and waste for domestic use, but rather for energy production through the combustion of large quantities of fuel in industries. This would lead, as already mentioned, to the reduction of large quantities of waste destined for landfills and therefore to their transformation into something useful and productive.
INTRODUCTION
It should be noted that it would be utopian, at least in our day, to consider using waste combustion in homes because, given their composition, it is easy to think that they have different gas emissions and may be harmful to human health.
1.1. Work objective and procedure
The main objective of this work is the evaluation of energy parameters resulting from combustion of RDF pellets and biomass pellets in a domestic boiler (nominal power of 20 kW). The aim is to demonstrate, in terms of emissions, pellet’s characteristics and energy production, that their use is alternative to fossil fuels. This will eliminate the use of coal or other fossil fuels in thermoelectric power plants and therefore will lead to savings in economic and environmental terms as well as reduce the amount of landfilled waste.
In particular, the intention is to compare the results obtained with the use of pellets made of RDF and pine tree wood, with pellets composed of pine alone (certified according to ENplus standards).
The main process on which the following work focuses is the combustion of pellets composed of RDF and biomass. In particular, the procedure can be described in four basic steps:
1) Milling process which consists of reducing the raw material into smaller pieces; 2) Pelletizing materials (RDF + pine), mix pine and RDF in a pelletizing equipment
to compact the material and give it the shape of the pellets in order to achieve a biomass densification (according to EN 14780 - Sample preparation). Pellets with different percentages of materials were done and tests were carried out:
- 5% RDF + 95% pine, - 10% RDF + 90% pine, - 15% RDF + 85% pine;
3) Physical characterization of pellets evaluating the humidity, durability, content of fine particles, diameter, length and apparent density (the properties will then be compared and verified based on the normal ENPlus EN 14961-2);
4) Pellet combustion in a domestic stove (20 kW) using only the "high" thermal load and the simultaneous evaluation of combustion efficiency and gas emissions.
1.2. Work organization
The work is mainly divided into 5 chapters which outline the organization and timing of the work itself.
The first section focuses on the general problem of waste and on Europe's future objectives regarding this topic. Furthermore, the focus is on the identity of the pellets and the potential that the mixing between wood pellets and waste can have. No less important in this section is the issue of emissions that when it comes to combustion, is always in the foreground.
3
The second part of this study deals with is the description of how the experimental work was carried out with reference to the standards. The latter are also taken into consideration in the chapter "Results and discussion" in which the values obtained from the experimental work are set out with reference to other studies.
The fifth part is almost the summary of what ended at the end of the research. In addition to the conclusion, suggestions for future work are added.
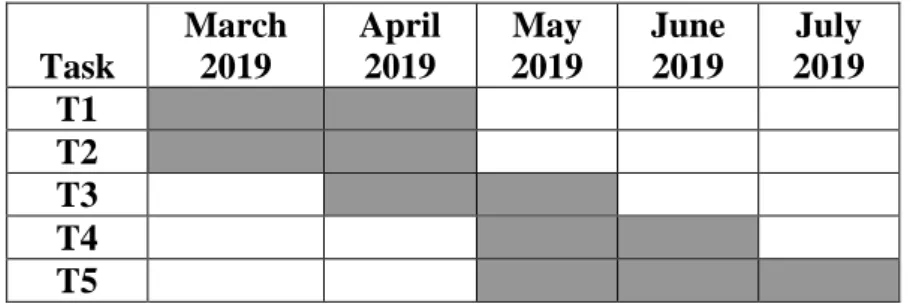
1.3. Work schedule
Table 1: Time schedule of the work carried out over the five months.
Task March 2019 April 2019 May 2019 June 2019 July 2019 T1 T2 T3 T4 T5
Table 2: Description of the sections of the work carried out over the five months.
Task Title Description
T1 Literature review Collection of information on the effects of combustion of refuse derived fuels RDF (with biomass and the impact on energy and gas emissions.
T2 Preparation of combustible mixes Preparation of mixes for combustion in a domestic boiler - evaluation of technical difficulties and best practice.
T3 Burning assays with evaluation of thermal efficiency and gaseous emissions
Burning tests of the prepared mixes and data collection.
T4 Data analysis Data analysis and statistical evaluation.
5 2. Literature Review
2.1. Fossil fuels and biomass
One of the most widely used fossil fuels in the world today is coal despite strong competition in the market with other types of fuels and despite their negative environmental impact. In fact, it is the most popular source of energy production due to its abundance and because over the years many different technologies have been developed for the advanced coal combustion for energy production. Generally the greater use of coal is in the field of electricity production (Demirbas,2003).
When it comes to fossil fuels it is may find "non-renewable" and in fact these energy sources are destined to run out very soon. These hydrocarbons also represent the main source of greenhouse gases, responsible for important environmental phenomena such as the greenhouse effect, acidic rain and global warming. When they are burned to produce energy, they release large amounts of CO2 and pollutants that create a great impact on the
environment. Unfortunately, their use has much lower cost than renewable energy sources and can release greater amounts of energy. Hydrocarbons such as oil, methane and coal owe their fortune to these factors, the ease of their transport and political and multinational interests.
Biomass fuels, a renewable source of energy, are growing strongly. Biomasses are all the products of agricultural and forestation, agricultural processing residues and food industry waste, algae, all organic products deriving from animal biological activity.
The combustion of biomass allows an energy recovery through, for example, thermochemical treatments. They are based on the exothermic reactions of biomass combustion (for example wood and its derivatives). Their main use is heat production. In fact, even if very often it is not realized, it is used biomass to heat our homes (fireplaces, pellet stoves, etc.) and sometimes even to cook (using charcoals and wood stoves).
The second use of biomasses, even if not direct, is the conversion of the heat produced by their combustion to produce electricity. This can be done in traditional plants that use gas, coal, etc. or by replacing it with biomass.
The use of fuel biomass could lower the level of environmental alert because it contains a low level of nitrogen and ash. Furthermore, biomass is considered a "CO2 neutral
fuel" because it consumes the same amount of CO2 that it emits during combustion. This
implies that there is a balance between what is emitted and what is absorbed and does not contribute to the greenhouse effect (Demirbas, 2003; Klason and Bai, 2007).
2.2. What are RDFs
RDFs are fuels derived from the last treatment phase of solid waste, or the so-called "rejected". This type of fuel is the product of the last phase of the Mechanical and Biological Treatment (MBT) process. It is aimed at stabilizing the organic fraction present in the residual
LITERATURE REVIEW
undifferentiated waste and at the possible enhancement of the fraction with high heating value through the production of RDF.
The phases of the urban waste treatment process is shown in the Image 1, are: separation of the waste at the origin, sorting or mechanical separation, reduction of the dimensions (shredding, cutting and milling), separation and screening, mixing, drying and pelletisation.
Image 1: Waste treatment cycle (Adapted from Brás et al, 2017).
Municipal solid waste (MSW) is first treated and passed through a magnetic separator. It is then sent to a ballistic separator to separate the low heating waste. The rest of the waste material is filtered to remove the recyclable fractions (eg metals), the inert fractions (for example glass) and the wet fraction (for example food) before the material is pulverized. In this way, the fuel produced from the waste is called RDF which are then sent to the RDF storage area.
The heating value of the RDFs, based as they are, is around 4000 kcal/kg and the reason for such a high heating value is the presence of plastic, paper or cardboard in RDF. RDFs also contain a high biomass value and this depends on the nature of urban waste and the organic or fuel content that is also related to the standard of living and consumption habits of the place where it is produced ( Brás, 2017; Kara, 2012).
As a result of the treatment of MSW in an MBT plant, paper and cardboard, cardboard, metal, plastic, glass packaging and organic waste are separated from the residual fraction which cannot be exploited and this is finally discharged into a landfill. But this residual fraction, also called waste fraction, can be profitable from the environmental and
7
economic point of view. It can be turned into waste-derived fuel (RDF), which is waste that has been treated (or processed). This process consists in eliminating the non-combustible fraction, reducing the size and moisture content, homogenizing the waste, and in some cases its transformation into granules and pellets (Gallardo, 2014).
It should be specified that the waste that can be used can be RDF and solid recovered fuel (SRF) that have a small but important difference. It consists in quality: by appropriately treating the RDF (removal of materials that have lower heating value) it is possible to derive the SRF. The bacterial load is eliminated, the humidity is reduced up to a maximum of 5% and regular shapes are made in order to compact the material into pellets. This obviously implies a greater investment in energy and resources, which is why it is often considered almost indifferent to use RDF rather than SRF.
2.3. Objectives of Europe
Although the combustion of RDF and biomass pellets is very advantageous, there are also many concerns related to emissions of dust, NOx, SOx into the environment. Precisely for
this reason, each country and each installation must comply with European standards.
For many years, research in the European Union (EU) has been conducted with the aim of finding a useful, economical and environmentally compatible way to reuse waste for energy production. Currently it is produced using fossil fuels which, however, have less stable chemical-physical characteristics than fuels derived from waste (RDF), which currently represent an alternative source of fuel.
Over the years there has been a fat and continuous increase in the production of waste that stopped at the beginning of the economic crisis. This led to a decrease in consumption which in turn led to a reduction in waste production. Despite this, the value recorded in 2012 for the production of urban waste per capita was 247 million tons in Europe (Massarini and Muraro,2015).
In 2014, Austria, Belgium, Denmark, Germany, the Netherlands and Sweden sent virtually no urban waste to landfills, while Cyprus, Croatia, Greece, Latvia and Malta still dispose of more than three quarters of their urban waste in landfills.
Although waste management in the EU has significantly improved in recent decades, almost a third of municipal waste is deposited in confined spaces and less than half is recycled or composted (with wide variations between Member States).
In 2020, every citizen will produce 558 kg of waste. The forecast was launched by the European Union Environment Agency not without fear. From the studies carried out, it was possible to realise that every year in Europe the quantity of waste produced by every single inhabitant grows: if in 1995 the annual garbage per capita was about 468 kg, in 2008 it rose to 524 and in 2020 it will be 558 kg if not action is taken (EEA, 2011).
Looking at the image 2 it is possible to observe the growth of waste production in the last few years and the average production in terms of kg per person.
LITERATURE REVIEW
Image 2:Production of Waste in EU year 2012 ( kg/person ) (Massarini and Muraro,2015).
The damage resides in the environment, for example with the release of leachate, but also in the amount of CO and equivalent emissions produced in landfills. An excellent start is to limit the waste that ends up in landfills, recycling all the materials that can be used again for the production of new materials.
Improving waste management could provide benefits for the environment, climate, human health and the economy. As part of a change in EU policy towards a circular economy, the European Commission has made four legislative proposals that introduce new targets in waste management with regard to re-use, recycling and landfill disposal.
Currently the objective of Europe with respect to the problem is to reach a recycling rate of 65% of urban waste and 80% of packaging by 2030 (EC, 2015; EU, 2018)
The objective has therefore been shifted, from recycling up to 50% of urban waste in 2020, to the new and more ambitious goal of 2030.
The proposed measures, which would also make it possible to reduce the environmental impact and emissions of greenhouse gases, provide for the prohibition from 2025 of placing recyclable waste in landfills.
Innovative design, better and more resistant products, more efficient and sustainable production processes, far-sighted business models and technical advances to transform waste into a resource will contribute to increasing efficiency.
2.4. Pellets and their development
History tells us that wood has always been the most used method to produce thermal energy. This condition remained until the 1920s after the fossil fuels took over which,
9
The alternative today is wood pellets which have become an important fuel in terms of heat production. The reason for their development is the size of the cylinders, ease of transport and emissions.
The production of pellets takes place in a pelletizing equipment sometimes with the addition of binders that facilitate compaction. These fuels are cylindrical in shape, usually with a low moisture content and high heating value. Another advantage of the use of fuels that possess this regular geometry is the feeding phase. In fact, the pellet stove has a screw that supplies the combustion chamber at constant time intervals. If the pellets did not have this shape the mechanism would probably be blocked. They even have CO2 emissions close to
defining them as "neutral", a great potential from the point of view of energy and they are easy to transport abroad (Sikanen,2008; Selkimäki, 2010).
The popularity of pellets is extended in many countries of the world and especially throughout Europe where it is still evolving. The increase in the number of domestic systems installed (pellet stoves) has allowed a development of the market of this type of fuel to satisfy the continuously growing demand. This type of equipment as reported in other studies are very competitive with those in oil or gas in terms of energy but above all in terms of maintenance (Selkimäki, 2010).
The wood pellet market, in fact, has grown internationally (Junginger et al., 2008) with a size that has even doubled from 2007 to 2010 (Savolainien, 2007). The market capacity has increased more rapidly than expected, with an approximate production of 6.2 million metric tons (Spelter and Toth 2009; Mani 2006).
There is a need to ensure good quality throughout the chain (production, delivery and storage) to support the further development of this type of fuel and make it competitive with fossil fuels (Selkima¨ki, 2010). The producers of densified biomass fuels, and specifically the producers of pellets, are obliged to guarantee the high quality of the product to remain within the limit values required by the regulations.
The leader producers of pellets are Germany, Sweden, Latvia, Estonia and France while the consumers are the United Kingdom followed by Denmark and Italy (Bioenergy Europe, 2019). Among the major producers of pellets there is also Portugal followed. The pellet market in Portugal since 2005 has undergone a strong development mainly for domestic use, public buildings and small industries. Not all biomass fuels produced in Portugal are destined for internal consumption. In fact, most of them (90%) are exported to northem Europe (Ferreira,2013).
The results of some research (Obernberger and Thek,2004) also show that pellets from Austria, Italy, Sweden, Spain, Norway and the Czech Republic are of very good quality.
In general it can be said that the market for this type of fuel in the last 10 years has undergone a strong global growth (average increase of around 14% since 2011). New countries have been involved in production and consumption like East Asia. To date, the leaders in the intercontinental trade sector are still the United States and the United Kingdom. This excludes that for the sale of pellets for domestic use the activity is intra-European (Thrän et al. 2017).
LITERATURE REVIEW
Image 3 shows the world situation of the pellet market.
Image 3: Domestic Production and Import | Export per country for chosen countries in 2015/2016; sorted by consumption (Thrän et al. 2017).
To date, the goal is to promote the use of these materials for small and large consumers in order to standardize their production and stabilize their prices. In the near future therefore the aim is to increase the possibilities of its expansion and the development of new raw materials for their production. Furthermore, it is necessary to build trust in buyers who, as with everything new, do not place much trust in this technology.
2.5. ENplus Normative
The certified pellets present on the European market can have different acronyms and among these, one of the most widespread and known is the ENplus Certification.
In 2011 the ENplus certification system was born, thanks to a tight agreement within the European Pellet Council, with the aim of certifying pellets as fuels and guaranteeing a high quality of combustion. ENplus is an additional element that allows the consumer to rely on the brand and choosing an efficient product.The European technical reference standard is EN 14961.
11
Image 4: Threshold values of the most important pellet parameters (Adapted from ENplus 14961-2).
This particular certification includes checks not only in the selection of the raw material, but also in the procedures followed within the production plant. Within the ENplus certification scheme, three different classes of pellet quality are defined:
- ENplus A1; - ENplus A2; - ENplus B.
Each class is determined by the technical characteristics of the product and the raw material used. The highest quality class is ENplus A1. In Image 4, the difference in the parameters between the various classes are shown.
The additives allowed in the ENplus certification are only biological products and in a maximum quantity equal to 2% of the total weight of the pellet. The type and quantity of all the additives used must be carefully documented.
The substances allowed, as mentioned, are exclusively natural, like starch, masi flour, potatoes or vegetable oil. Generally, they are added to increase the quality of the fuel.
LITERATURE REVIEW
However, the low percentage of these elements that is inserted guarantees the need to select raw materials which, alone, already guarantee high results.
ENplus not only guarantees a high level of fuel yield but, thanks to the activation of a monitoring system entrusted to a third body, it is able to attest to the safety and sustainability of the production process.
2.6. Combustion
Combustion is a highly exothermic chemical oxidation phenomenon that occurs between a fuel and oxygen with an intense light manifestation and heat emission. The essential conditions for combustion to occur are (Image 5):
- Having a fuel;
- Having air, to have oxygen;
- Having a particular ignition or temperature called flammability temperature.
Most combustion reactions concern the rapid oxidation of the substance by O2, but
reactions that occur even in the absence of O2 are known. In reality it is more opportune to
speak of an oxide-reduction reaction rather than a simple "oxidation". In these reactions the oxidizing species is called comburent and the reducing species is called fuel (Anticendio Italia,2017).
A combustion that has a high thermal efficiency involves the emission of less harmful products. Wanting to refer to fossil fuels, what happens during the oxidation-reduction reaction is the transformation of hydrogen into water and carbon into carbon dioxide (as can be seen from the equation below). It may happen that the carbon is oxidized to an intermediate level of reaction and in that case the formation of carbon monoxide (CO) occurs (as shown in the equation below). If the combustion reaction will take place completely, the formation of carbon dioxide (CO2) will occur (as shown in the equation below).
H2+1
2O2 → H2O + 241,8 kJ/mol
C + O2 → CO2+ 383,5 kJ/mol
2C + O2 → 2CO
CO is a highly toxic product whose formation involves an energy loss as well as an objective risk for human health. Another risk factor and a reduction in energy efficiency lies in the incomplete oxidation reaction of the hydrocarbons, leading to the VOCs formation. The latter is also influenced by the combustion speed which, as in many other types of reactions, increases with increasing temperature. When the temperature is low (<1000°C) the combustion takes place slowly with energy dissipation (slow combustion). In this case there is
13
significant life times. These intermediates, for example, are the cause in the combustion of hydrocarbons from the formation of VOCs between products (Cavaliere,2017;Anticendio Italia,2017).
2.6.1. Stationary regime
From an engineering point of view, the essential problem, in the presence of heat transmission, is the determination of the thermal power transmitted for a given temperature difference (ΔT). The size of the boilers, for example, or heat exchangers in general, in fact, does not depend only on the amount of heat exchanged but also on the thermal power. This makes us understand that time is a fundamental variable for the study of heat transmission (Gómez and Watterson,2006).
In the present work the temperature reached is studied during the combustion of a certain mass of pellets made available for the stove. In particular, is studied the variation of the temperature of the combustion gases over time and therefore during the transitory regime phase and then during the stationary regime phase. The transitory regime includes that period in which, following the ignition, the temperature increases, the flame expands and involves all the fuel.
Most interesting for research and for determining thermal efficiency are the values studied in the stationary regime phase. The reason lies in the definition of a stationary regime which is the phase of combustion (before switching off) during which a certain temperature is reached which remains unchanged over time. It is clear that in this way, having a constant factor, it will be easier and more correct to study all the other combustion characteristics (Gómez and Watterson,2006).
2.6.2. Biomass combustion
Good combustion involving biomass must have low emissions and a low residue content which requires a good supply of air, good mixing of fuel (pellets)/oxidising (air) and the right mass supply inside the equipment. The latter must be divided into a primary and a secondary combustion zone and each of them must have its own air supply.
Usually the combustion is made by about primary and secondary air, which intervene in the process in two successive steps. The primary air is allowed to enter the combustion chamber of the biomass boiler (in a natural way or with forced ventilation) in the area of the grid, to allow the ignition of the wood material (the start of combustion). This phase, for biomasses, is called gasification. Combustible gases are developed such as hydrogen and carbon monoxide, which, when properly conveyed to the brazier area, help combustion thanks to the introduction of secondary air (also introduced near the embers) with the aim of maximizing the combustion of the biomass.
In the primary combustion zone there will be a second phase during which the gases produced by the first phase are burned in the presence of excess air. It is necessary that there
LITERATURE REVIEW
is a good mix between the gases produced in the first phase and the air supplied during the second. The longer the gas stays in the boiler, the better the combustion will be. The supply of primary air and secondary air can be seen in Image 5.
Image 5: Stages of combustion in a forced draft suction stove (primary air and secondary air) (primary air and secondary air) (Francescato et al.,?).
The stages into which the biomass combustion process is divided are shown in the Image 6.
Image 6: Evolution of the mass of a biomass particle during the combustion process (Dias, 2002).
The combustion stages may be described as:
- The ignition that provides thermal energy to the fuel. It follows its heating through the irradiation of the flame in most of the combustion chamber;
15
- The drying of the fuel through the heat generated in the previous phase and the consequent evaporation of the water (the combustion temperature is around 100 ° C);
- the pyrolysis that involves the decomposition of the fuel (the boiler temperature is around 150 ° C);
- The gasification of the substance that is now dried (the combustion temperature is around 250°C). In this phase the formation of combustion gases and solid coal occurs;
- Gasification of solid coal with consequent formation of CO and CO2, water
vapor and release of O2 (the combustion temperature is around 500°C);
- Final reaction of the fuel reaching temperatures in a range of 700-1400°C and oxidation of combustible gases.
The flame will thus expand to the new fuel supplied by the boiler hopper (Francescato and Antonini,2009).
2.6.3. Gaseous emissions
The formation of polluting emissions depends mainly on the quality and completeness of the combustion. In particular from the combustion temperature, from the quality of the mixing between fuel and air supplied and the too short time of permanence of the combustible gases in the combustion area. The ―not-burned‖ pollutants are CO, HC, tar, polycyclic aromatic hydrocarbons (PAH), hydrocarbons (CxHy) and coal particles while the second
category includes ash, nitrogen and sulfur. In particular, the second type of pollutants are closely related to the characteristics of the burned biomass and can include particulate (PM), nitrogen oxides (NOx, mainly NO and NO2 and N2O) and sulfur oxides (SOx, mainly as SO2)
(Khan, 2009).
2.6.3.1. CO and CO2 emissions
The main reasons for the formation of CO and CO2 are linked to the completeness of
the combustion. The more complete the combustion, the more CO2 emissions will be at the
expense of CO emissions.
To fully understand the mechanism of formation of these pollutants during thermal processes requires that their combustion chemistry be known as shown in chapter 8.3.4.1 of this work.
It can be said that what is produced during the ideal oxidation reaction (during complete and good quality combustion) is CO2 and water. In the event that the air supplied to
the reaction is insufficient in the combustion zone there will also be the formation of carbon monoxide (CO) (Wielgosiński and Grzegorz,2011).
LITERATURE REVIEW
2.6.3.2. NOx emissions
Nitrogen compounds include nitrogen oxide (NO) and nitrogen dioxide (NO2), which
are commonly called nitrogen oxides (NOx) and nitrous oxide (N2O). All of them play an
important role in atmospheric reactions that create a lot of environmental damage like the release of particulate matter in the atmosphere, ozone (smog in general) or acid rain (Khan et al., 2009).
Organic compounds containing nitrogen, such as those found in fossil fuels, participate in the formation of NOx during combustion. It depends on the amount of nitrogen
contained and its concentration in fuels, liquid or solid. Usually in fossil fuels the amount is 0.3-2% nitrogen by weight (Fluent Inc., 2003).
In literature there are many studies on NOx emissions which suggest that most of them
come from fuel nitrogen. Furthermore, it was noted that the formation of nitrogen oxides is decidedly greater when it comes to solid fuels and waste. It is believed that in the case of biofuels, nitrogen is almost entirely in a volatile phase (66-75%) during the devolatilization phase and this occurs when there is a low carbon content. NOx is formed according to two
different and competitive paths, namely the oxidation of the nitrogenous group in the volatile gas phase and through the oxidation of the nitrogenous species linked to coal (Khan et al., 2009).
Image 7: Conversion of fuel nitrogen in the case of biomass combustion (Khan et al., 2009). During combustion, the NOx are released in the form of particles or droplets during the
devolatilization phase of the fuel and the combustion of the coal, following three types of mechanisms during combustion (Williams et al., 2012):