MEMOIRE DE RECHERCHE
2013/2014
NOM et PRENOM de l’auteur: VAZ MOÇO, Bruno
SUJET DU
MEMOIRE
TOPIC: The quantified-self movement and the integration of gamification strategies. RESEARCH QUESTION: Does quantifying ourselves have an impact on happiness?
- NOM DU DIRECTEUR DE RECHERCHE: Professor Martin KUPP
CONFIDENTIEL
Non Oui La diffusion de cerecueil est strictement réservée à
ESCP Europe.
DISSERTATION SUBMITTED IN PARTIAL FULFILMENT OF REQUIREMENTS FOR THE DOUBLE MASTER DEGREE IN BUSINESS, AT ESCP-EUROPE – PARIS AND
UNIVERSIDADE CATÓLICA PORTUGUESA – LISBON.
ABSTRACT
The increasing number of connected devices that quantify daily activities are expected to have an impact on individual motivation and improve daily habits, but little is known about their effect on individual happiness. This study proposes to analyse the impact of self-quantification on happiness by assuming that it will promote virtuous behaviour. A sample of 10 participants was used, divided into 3 groups: study, placebo and control groups. Happiness levels and changes in behaviour were measured for each group using the Oxford Happiness Questionnaire (Hills and Argyle, 2002) and the Virtues Score (Cawley et al., 2000) respectively. The study lasted for a period of 21 days, ending with a qualitative interview for each participant. Results suggest that quantified-self through the use of a connected devices may have a positive impact on individual happiness. The effect of self-quantification on the practice of virtuous behaviour could not be confirmed. Based on study results, an extended theoretical model is proposed and business implications discussed. Study limitations and future research are also presented.
Keywords: quantified-self, connected devices, happiness, virtuous behaviour, Internet of Things.
RESUME
Le nombre croissant d’appareils connectés qui mesure les activités quotidiennes est censé avoir un impact sur la motivation individuelle et améliorer les habitudes des utilisateurs. Néanmoins, leurs effets sur le bonheur individuel reste peu connus. Cette étude propose d’analyser l’impact de la quantification sur le bonheur en supposant que la
self-quantification encouragera les comportements vertueux. Un échantillon de 10 participants a
été utilisé, divisé en 3 groupes : un groupe étude, un groupe placebo et un groupe contrôle. Cette étude a mesuré les niveaux de bonheur et des changements de comportement pour chaque groupe avec respectivement le Oxford Happiness Questionniare (Hills and Argyle, 2002) et le Virtues Score (Cawley et al., 2000). L'étude a duré pendant une période de 21 jours, se terminant par un entretien qualitatif pour chaque participant. Les résultats suggèrent que la self-quantification, au travers de l'utilisation des appareils connectés, peut avoir un impact positif sur le bonheur individuel. L'effet de la self-quantification sur la pratique d'un comportement vertueux n'a pas pu être confirmé. Selon les résultats de l’étude, un modèle théorique élargi est proposé et discuté avec leurs implications commerciales. Les limites de l’étude et des futures recherches sont également présentés.
ACKNOWLEDGEMENTS
To my mother, for her love and support throughout my studies. Without her this work would not have been possible.
I would like to thank my research supervisor, Professor Martin Kupp, for his assistance and support during this project.
Last but not least, I’d like to thank my dear friends for participating in this study. I am grateful for their commitment and patience.
TABLE OF CONTENTS
Abstract ... 2 Résumé ... 3 Acknowledgements ... 4 Table of Contents ... 5 Introduction ... 7 Problem statement ... 8Theory and research background ... 8
3.1. What is happiness? ... 8
3.2. What impacts happiness levels ... 9
3.3. Personal achievements as a source of happiness ... 9
3.4. Virtuous Behaviour ... 10
3.5. What are connected devices ... 11
3.6. Quantified-self movement ... 12
3.7. Economics of the quantified-self market ... 13
Theoretical Framework and Hypotheses ... 15
Hypothesis 1 ... 15
Hypothesis 2 and 3 ... 16
Empirical Study ... 17
4.1. Method ... 17
4.2. Research participants and group allocation ... 17
Sample size ... 17
Abandon rate ... 18
Group allocation ... 18
4.3. Group tasks ... 19
Group 1 (study group) ... 19
Group 2 (placebo group) ... 19
Group 3 (control group) ... 19
4.5. Questionnaires ... 20 Happiness Questionnaire ... 20 Virtues Questionnaire ... 21 4.4. Timeline ... 23 Results ... 25 Descriptive statistics ... 25 Happiness Score ... 25
Virtuous Behaviour ... 28
Qualitative Information ... 29
Initial excitement ... 29
Critical timing for gamification ... 30
Increasing self-awareness ... 31
Tiredness on the 13th day ... 32
Social Sharing ... 32
Behavioural changes ... 32
Interpretation and comments ... 33
Extended Model ... 34 Self-awareness ... 35 Motivation ... 36 Opportunity ... 37 Discussion ... 38 Business Implications ... 39
Limitations and future research ... 40
Conclusion ... 42
Bibliography ... 43
Appendix... 47
Oxford Happiness Questionnaire ... 47
Virtues Scale ... 49
INTRODUCTION
The rapid expansion of connected devices in the past decade has allowed consumers to monitor daily activities in a frictionless way. Using a gamification layer, these devices encourage users to set daily goals, rewarding achievements with badges and virtual trophies. This represents a major shift in consumers’ behaviour and merits further evaluation. As a business opportunity, self-quantification is expected to grow exponentially. This may be in the form of selling hardware for connected devices, software for personal tracking or services that interconnect users’ devices and personal data. In order to fully seize this business opportunity it is essential to understand users’ motivations behind literally tracking every step they take, their sleep, their calories, their workouts and other streams of information.
Studying the link between self-quantification and individual happiness is of great importance considering that these devices are playing an ever more prominent role in peoples’ lives. These devices are expected to have an impact on individual motivation and improve daily habits, but little is known about their effect on individual happiness. The priming question of this study is to understand whether consumers are quantifying themselves because they can, or because it brings a tangible benefit to their lives.
This study thus proposes to investigate the impact of self-quantification on individual behaviour as a mechanism to positively influence individual happiness and well-being.
PROBLEM STATEMENT
To what extent does self-quantification impact on individual happiness and well-being? More and more society is applying resources, both time and money, in setting up personal ecosystems around self-quantification. Investors are pouring money into new and existing companies to develop new forms of connected devices, and to market new services to consumers with the promise of better tracking their personal activities. Society is quickly moving to a model where individuals register all their moves in computers and remote servers. The real question is why do people do this? Can people benefit from this behaviour? To answer this question it is important to begin by defining and understanding the concepts behind this research. In the next chapter the main concepts will be explained and the literature reviewed.
THEORY AND RESEARCH BACKGROUND
3.1. WHAT IS HAPPINESS? Happiness is a very difficult concept to define.
As a phenomenon, happiness has been studied by philosophers since the dawn of written history (McMahon, 2006), but only in the past decade with the rise of positive psychology has attention to happiness and other positive states been legitimized (Sheldon et al., 2000). This sharply contrasts with the previously dominant disease model which disproportionately directed attention to illness, depression, stress and similar negative outcomes (Fisher, 2010). There are two distinctive concepts of happiness – the hedonic and the eudaimonic perspective (Fisher, 2010). The hedonic perspective looks at happiness as pleasant feelings and favourable judgments, while the eudaimonic perspective sees happiness as doing what is virtuous, morally right. In other words, in the eudaimonic perspective, to be happy is to be true to one’s self, meaningful, and growth producing (Deci and Ryan, 2008). Society’s focus on hedonic happiness is changing towards a more eudaimonic view on happiness and focusing more on virtue and moral values. This represents an interesting return to the Aristotelian approach of happiness (Helliwell et al., 2013). For Aristotle, there are many dimensions to happiness, or eudaimonia, like pleasure, wealth, honour, health and virtue, or perhaps a combination of these (Kraut, 1991).
To further complicate the understanding of happiness, there is no absolute value for happy or unhappy (Prelipcean, 2013), people can only be happier or unhappier. Meaning that happiness will always be relative among individuals, and also relative through time, like a pendulum that balances higher or lower but never reaching its highest or lowest point – and can never be fixed through time as the pendulum is always in movement.
3.2. WHAT IMPACTS HAPPINESS LEVELS
Besides being a complex construct to study, the understanding of happiness depends not only on geographical and environmental aspects (Brereton et al., 2008), but also on genetic factors and personality traits (Argyle and Lu, 1990).
The idea that happiness is determined by genetics can be a daunting thought for many. In fact it is known that genes play a big role in determining happiness levels and subjective wellbeing. Multiple research in the field reports on the importance of different genes on happiness, with the impact of genes on individual happiness varying from about 33% (De Neve et al., 2012) to values as high as 50% (Nes, 2010). The good news is that other variables also have a positive (and negative) impact on our happiness. Aristotle defended that happiness comes from individual virtues which in turn come from our habits (Kraut, 1991). This means that practicing a virtuous behaviour can have a positive impact on individual happiness. In other words, according to Aristotelian philosophy, by living a virtuous life and having high standards of moral ethics, people can be happier.
3.3. PERSONAL ACHIEVEMENTS AS A SOURCE OF HAPPINESS
Although there is no simple recipe to increase happiness, the achievement of individual goals is a demonstrated source of happiness (Dewar et al., 2013). Framing goal achievement is a very broad approach, given that goals will vary from one individual to another. Furthermore, goal achievement depends on the individuals’ perception of their own performance and how great they value their merit. There is extensive research on the human need to demonstrate competence when faced with a challenge, such as in the context of sports (Nicholls, 1984). This particular research describes that people will have a different perception of task performance depending on whether they are ego or task oriented. Task-oriented individuals use self-referenced criteria to evaluate competence and feel successful when they improve or master a task. On the other hand, when they are ego involved, individuals use
other-referenced criteria to evaluate competence and feel successful when they demonstrate superiority over others (Nicholls, 1984). Nonetheless, whether individuals are task or ego oriented they will be happier from their goal achievements. It’s thus important to identify an individual’s goal and its respective achievement. Only then can the real source of happiness in terms of goal achievement for that individual be understood.
3.4. VIRTUOUS BEHAVIOUR
A virtue, or moral virtue, is a disposition of character that is considered to be morally good. It can be seen as the right amount of a given trait between excess and deficiency. In Aristotelian literature virtuous behaviour is considered to be a source of happiness. Therefore increasing one’s demonstration of virtues through habit would shape his behaviour to the point where it would lead up to higher levels of happiness and well-being. Aristotle believed that all traits have two extreme positions, and the virtue lies in balancing the right amount of both extremes, which can depend on the situation, person and desired outcome. This does not mean that people should strive for a mid-point in a spectrum of extremes, in fact it’s quite the opposite. Aristotle defended that the virtue lies in finding the right position between the two extremes, the “golden mean”. For example, Confidence is the golden mean between self-deprecation and vanity (Aristotle, 2013).
To develop virtues people should shape their behaviour. Aristotle believed that virtues came from habit and from practicing virtuous behaviour. This sheds some light on how to develop one’s virtues. According to Aristotle, people who bring forward their virtues through the practice of virtuous behaviour will shape their behaviour, and their traits become more virtuous. In other words, by practicing virtuous behaviour people shape their true behaviour to become more virtuous.
“Watch your thoughts, for they become words. Watch your words, for they become actions. Watch your actions, for they become habits. Watch your habits, for they become your character. And watch your character,
for it becomes your destiny. What we think, we become.” – Margaret Thatcher.
There are many well documented virtues that can be measured in one’s behaviour, examples are persistence, empathy, self-control, discipline, confidence, purpose, patience and bravery. This research will consider virtuous behaviour as the practice of multiple virtues in one’s behaviour.
3.5. WHAT ARE CONNECTED DEVICES
The IoT (Internet of Things) brings a paradigm shift where devices around us can communicate with each other. It brings interoperability across different platforms, opening new possibilities in terms of device interdependence. In the past years, the IoT has been rapidly growing – a trend that is expected to continue as information systems and processes become more intelligent and automated. Interconnectivity across multiple devices is also paving the way for big data and the potential of exploiting this collective data. A resulting consequence from this trend is predictive diagnostics – an example of this would be a car insurer charging consumers based on the time and safety of their driving instead of their accident track record.
The IoT has the power to reshape the Economy and it will disrupt many businesses, but this also means a lot of profit for some companies. Cisco, a big evangelist of the IoT, estimates that by 2020 the worldwide profits from the IoT will be 14,4 trillion dollars, with 50 billion connected devices around the world (Burt, 2013).
Connected devices are at the core of the IoT. In this research, connected devices are considered to be those that can be remotely monitored and controlled. Most importantly, connected devices are those that can gather and catalogue data about their environment, and countless other variables (Mertins, 2014). The opportunity of this new market relies not only in producing and selling connected devices, though they are already a profitable business, but also in the exploitation of the big data deriving from this network of connected devices. Connected devices are often times called “smart objects” since they are usually smarter implementations of traditional objects. This is usually done through the use of touchscreen interfaces, wireless communication radios, interactive user experiences, and the ability to remotely store information from the user while exchanging such information with other devices authorized by the end-user.
3.6. QUANTIFIED-SELF MOVEMENT
The quantified-self movement started in San Francisco when Gary Wolf started the “Quantified Self” blog1 in 2007. By 2012 there were already meetings and conferences taking place in over 50 cities worldwide (Bottles, 2012). Using connected devices, consumers have been tracking their daily routines and habits. These connected devices then store users’ personal information in cloud powered databases. Common tracked variables include, among others, daily steps, calories burnt, blood pressure, mood, diet and sleep patterns.
It’s not that this kind of self-tracking was not possible before. In fact humans have been doing such recordings for many years using solely pen and paper, for example registering daily in a notebook the date, duration and distance of a run. Even if self-monitoring is nothing new, the quantified-self movement assumes that consumers are able to measure themselves with minimum effort. The multiple sensors around consumers keep track of their daily habits in an automated fashion. Data from these sensors includes extensive personal variables such that if all were measured manually they would take more time to register than to perform the activities themselves.
Another important aspect of the quantified-self movement that makes it unique when compared with analogic self-tracking is the potential new ways of using personal data after it has been registered. With the use of connected devices, consumers can allow multiple devices to share their information with one another. Data can be stored in one place while users grant access to specific data so that other services can derive insights from the aggregate data. For example, data of body weight, blood pressure, daily diet, and burnt calories may not say much on their own, but a service that looks at all the four variables together can understand the interconnection of a person’s health and suggest better habits. It can even alert the user of a change of behaviour.
There are 4 main reasons that fuelled the immense growth of this movement in the past years (Wolf, 2010):
Electronic sensors got smaller and better, meaning users could easily integrate them in their daily lives;
People started to carry powerful computing devices with them, typically disguised as mobile phones;
Social media made it seem normal to share everything with friends and acquaintances;
Cloud computing became ubiquitous and people started to expect to access their data from any computing device, cloud computing also made it possible for service providers to use the power of the cloud for analysing big data created from users.
3.7. ECONOMICS OF THE QUANTIFIED-SELF MARKET
While there are many companies producing their own connected devices and fuelling the quantified-self movement, this is a fairly new market. We are still identifying the main forces of this new technological ecosystem. Some companies are focusing on producing their own physical devices, allowing them to interoperate as much as possible with platforms from competitors – aiming at being open players in the market (i.e.: no switching costs for users). Examples of this strategy is Fitbit 2and Withings3. With activity trackers from these companies, users can upload their data to purely digital platforms like RunKeeper4. These digital platforms are also open and compete to become the de facto quantified-self repository, accepting data from all connected devices on the market.
On the other hand some companies are focusing on creating platforms with high switching costs, forcing users to remain in their ecosystem. The best example of such a strategy would be the Nike+5 platform. Nike is selling its own hardware in the form of a sports watch or a wristband as well as digital apps that run on smartphones. These devices and apps then feed the Nike+ platform with users’ activity. The Nike+ platform does not accept data from competing devices, and users cannot use Nike’s devices with other platforms such as RunKeeper, becoming effectively locked to the platform and the device.
It is yet to be verified which strategy will prove to be more successful, but a recent event hints that perhaps the open model on the software side has more advantages. In a recent turn of events Nike announced that it would lay off its entire hardware team behind the Nike+ devices. While they are moving out of the hardware part of the quantified-self movement
2 http://www.fitbit.com/ 3 http://withings.com/ 4 http://runkeeper.com/ 5 http://nikeplus.com/
(which is highly competitive) they are investing more in their digital platform, going as far as announcing that they would for the first time integrate their platform with competitors’ devices. This means that Nike would be competing on the software side, providing services that can run on top of the already highly competitive hardware market.
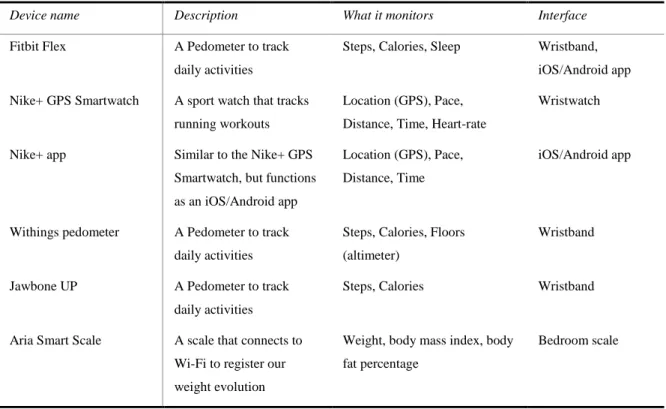
This research focuses on the usage of the Fitbit Flex, a smart bracelet capable of tracking the user’s steps, calories and sleep patterns. It’s a full-fledged connected device that can be tied into other ecosystems and thus integrated with other connected devices, such as smart scales and other biometric smart devices. As a matter of reference, Table 1 shows some of the most prominent connected devices used for the purpose of self-monitoring that are widely available on the market today.
TABLE 1 – MOST COMMON CONNECTED DEVICES IN USE FOR SELF-QUANTIFICATION
Device name Description What it monitors Interface
Fitbit Flex A Pedometer to track daily activities
Steps, Calories, Sleep Wristband, iOS/Android app Nike+ GPS Smartwatch A sport watch that tracks
running workouts
Location (GPS), Pace, Distance, Time, Heart-rate
Wristwatch
Nike+ app Similar to the Nike+ GPS Smartwatch, but functions as an iOS/Android app
Location (GPS), Pace, Distance, Time
iOS/Android app
Withings pedometer A Pedometer to track daily activities
Steps, Calories, Floors (altimeter)
Wristband
Jawbone UP A Pedometer to track daily activities
Steps, Calories Wristband
Aria Smart Scale A scale that connects to Wi-Fi to register our weight evolution
Weight, body mass index, body fat percentage
THEORETICAL FRAMEWORK AND HYPOTHESES
Considering the current revolution around connected devices and the increasing trend for society to measure itself, it is important to understand the purpose of this fast growing trend. Past literature analysed extensively the multiple dimensions of happiness and its sources. It also analysed how an individual’s behaviour today can result in a more virtuous behaviour in the future, which will in itself, be a source of happiness. What largely remains to be explored is whether or not the use of connected devices for the purpose of self-quantification can have a positive impact on an individual’s behaviour, making it more virtuous, thus acting as a source of happiness.
This study proposes a theoretical model composed of 3 main hypothesis. Two of them will be researched in detail while the third will be taken from past literature.
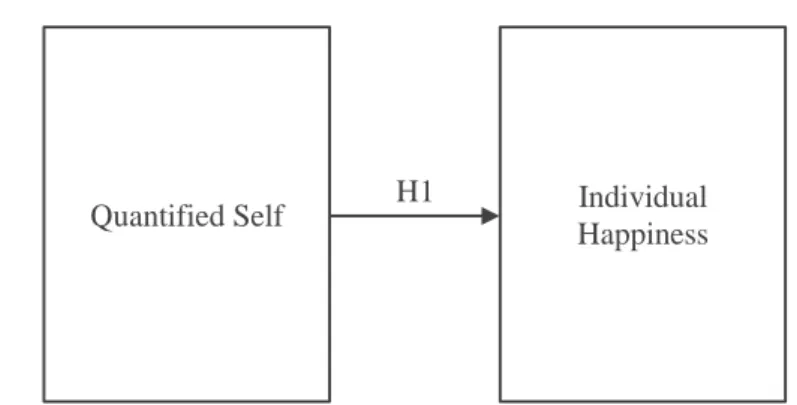
HYPOTHESIS 1
The main hypothesis of the study (H1) is that self-quantification will have an impact on individual happiness. There may be many reasons for this, and considering the literature review discussed, goal achievement derived from self-quantification may in itself be a source of happiness. If H1 is believed to be true then it is reasonable to assume that self-quantification as a means to increase individual happiness and well-being is a valid reason for the use of such devices.
Therefore H1: “Self quantification through the use of connected devices has a positive impact on individual happiness”.
FIGURE 1 – PRELIMINARY THEORETICAL FRAMEWORK FOR H1.
Quantified Self Individual
Happiness H1
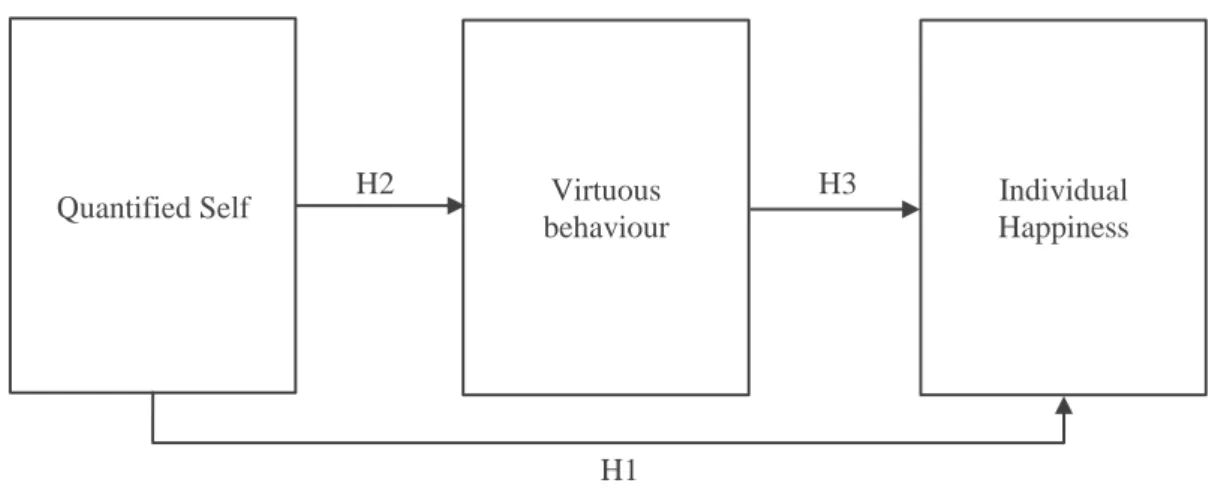
HYPOTHESIS 2 AND 3
To study in more detail the relationship between self-quantification and individual happiness, this study proposes two more hypothesis. H2 and H3 will be used to explain the impact of self-quantification on individual happiness and well-being by promoting virtuous behaviour. The relationship between virtuous behaviour and individual happiness, as put forward by many philosophers including Aristotle and Plato, has been extensively highlighted. Given the widely acceptance of this relationship by the academic community, this research will only focus on the impact of self-quantification on changes in virtuous behaviour.
Therefore H2: “Self quantification through the use of connected devices increases the propensity for virtuous behaviour”
Therefore H3: “The practice of virtuous behaviour has a positive impact on individual happiness”.
Both hypothesis will now be added to the preliminary model introduced in Figure 1.
FIGURE 2 – COMPLETE THEORETICAL FRAMEWORK FOR H1, H2 AND H3.
The complete theoretical framework is presented in Figure 2. In the next chapters, H1 and H2 will be analysed in the light of the gathered data and the validity of the theoretical framework will be discussed.
Quantified Self Individual
Happiness Virtuous
behaviour
H2 H3
EMPIRICAL STUDY
4.1. METHOD
To test the hypothesis a sample of 10 participants was used, divided into 3 different groups. Each group was asked to fulfil a task for a period of 21 days. All participants also had to complete a set of 10 questionnaires that were the same across the 3 groups.
As a complement to quantitative data gathered from participants’ questionnaires, individual interviews were conducted with all participants, to better understand the information gathered. Interviews occurred following the completion of all individual questionnaires. All interviews followed the same general structure for the sake of comparison, but some exploratory questions were used to gather insight about each participant’s experience during the study.
Statistical analysis was not applied to the results due to the small sample size, and methodology focused on analysing the gathered quantitative and qualitative data in order to interpret the proposed theoretical model.
4.2. RESEARCH PARTICIPANTS AND GROUP ALLOCATION
Given the intense nature of this study – lasting for 21 days with 10 demanding questionnaires and some imposed changes in the participant’s lifestyle – it was deemed wiser to select participants that were well known to the researcher and considered reliable to complete the study. Of all the preselected participants, a sample of 10 was chosen from the first 10 individuals that accepted to take part in the study.
Sample size
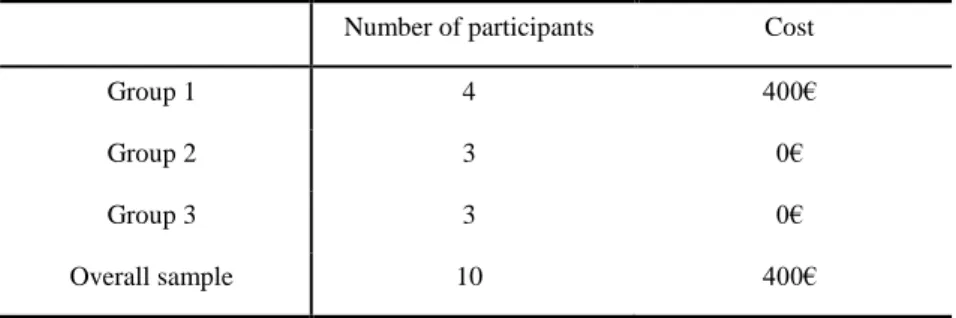
Sample size was mainly constrained by the financial restrictions imposed by the required material. As it will be discussed further on, members from one of the groups were asked to wear a self-quantifying device. The device chosen for this study was the Fitbit Flex, which is a smart bracelet costing around 100€ per device. As the budget for this research was 400€ it was decided to have 4 participants wearing the device. Because the other 2 groups were used as a comparison to the study group (placebo and control groups) it would not make sense to have a larger placebo group than the study group, and the same goes for the control
group. Therefore it seemed reasonable to have a study group with 4 participants, and another 6 participants split equally between two other groups (placebo and control).
TABLE 2 – SAMPLE SIZE AND SAMPLE COST, DIVIDED ACROSS SAMPLE GROUPS
Number of participants Cost
Group 1 4 400€
Group 2 3 0€
Group 3 3 0€
Overall sample 10 400€
Abandon rate
During the study one of the participants from Group 1 failed to complete the required tasks and was removed from the sample. The choice was associated with the potentially poor quality of results from this participant, and possible impact on the final interpretation of the group as a whole.
At the end of the study sample size was 10, with an abandon rate of 10% and a final useful sample of 9 participants.
TABLE 3 – FINAL SAMPLE SIZE AND ABANDON RATE OF THE STUDY
Initial sample size Final sample size
Group 1 4 3 Group 2 3 3 Group 3 3 3 Overall sample 10 9 Abandon rate: 10% Group allocation
Although the selection of study participants was not absolutely random, the allocation to their respective group was arbitrary. Once the sample of 10 participants had been chosen, their names were written on Excel and for each of them a random number generating formula. This formula created a random discrete number from 1 to 3. One by one, all were attributed
to their respective group, respecting the condition that group 1 would have four participants, and group 2 and 3 would have three participants each.
4.3. GROUP TASKS
Each group had a specific task to complete during a set number of days and as a result each group represents a unique setting for participants. This way the study envisioned that the participants’ group is an independent variable, while the questionnaire results are dependent variables.
During the study, none of the participants knew the subject or goal of the research, the composition of the groups, or the other groups’ tasks. Group differences will now be looked at more carefully.
Group 1 (study group)
The purpose of this study was to analyse changes in behaviour of this group, and compare them with the other two groups. Participants of Group 1 were required to wear a smart bracelet during 15 days, and were encouraged to explore the full functionality of the bracelet – tracking of steps, calories and sleep patterns – but the researcher did not interfere with the participant’s use of the device. The objective was to mimic real world usage of these devices, allowing participants to suit the device to their own needs.
Group 2 (placebo group)
Group 2 was setup to trace any placebo effect of the study itself. This group’s objective was to compare its results with the study and control groups. Participants of Group 2 were asked to eat at least one piece of fruit each day, with the restriction that the piece of fruit had to be different from the one eaten the day before. If participants wanted to eat more than one piece of fruit on a day, they were required to choose two different types of fruit, and each had to be different from the fruit of the previous day.
Group 3 (control group)
Group 3 was designed as a control group for the study. The objective was to compare results with participants from the study group and the placebo group. This group had no specific task apart from filling the required questionnaires – that were applied equally to all groups.
4.5. QUESTIONNAIRES
All three groups had to fill out the same questionnaires so that answers could be compared across groups. Since questionnaire results are dependent variables all analysis were aggregated to the independent variable – in this case the participant’s group.
For the purpose of this study 2 different questionnaires were used – a Happiness Score questionnaire and a Virtues Score questionnaire. Considering the enormous challenge that is to measure happiness levels and virtues scores it was considered wiser to use tested and published research tools, instead of creating a customized research tool for the specific purpose of this study. Therefore two instruments were chosen based on their characteristics and will now be analysed in more detail.
Happiness Questionnaire
The happiness questionnaire is based on the Oxford Happiness Questionnaire (Hills and Argyle, 2002) and is a compact scale for measuring psychological well-being. This instrument is itself based on a more complex instrument – the Oxford Happiness Inventory – created as a suitable instrument for participants deemed psychologically normal, that is to say, participants that are not considered to be maniac depressive or bearers of any other psychological disturbance. This is achieved by changing the answering scales. The Oxford Happiness Inventory follows the answering format of the Beck Depression Inventory (Beck et al., 1961) which consists of a set of multiple choice questions, each with 4 sentences to choose from that are incremental positions from the previous one. This type of scale provides a uniform distribution rather than a normal distribution when applied to maniac or non-depressed participants (Hills and Argyle, 2002).
The Oxford Happiness Questionnaire was then developed as a viable tool to assess individual happiness and psychological well-being in a non-clinical environment. Furthermore, the Oxford Happiness Questionnaire proceeded to factorial analysis to reduce the number of answers from the original Oxford Happiness Inventory, so that it could be more easily administered to participants. The resulting instrument is a questionnaire with 29 Likert questions on a scale from 1 to 6, with answers ranging from “strongly disagree” to “strongly agree”.
These are some exemplary questions taken from the questionnaire: 1. I am not particularly optimistic about the future;
3. I feel fully mentally alert; 4. I don't feel particularly healthy;
5. There is a gap between what I would like to do and what I have done.
Some questions are phrased inversely, meaning that often times a value 6 represents the happiest possible answer and in other questions the phrasing makes it so that a value 1 is the happiest possible answer. This forces participants to answer the questions carefully and increases accuracy of response. Another measure aiming at increasing accuracy of response is the use of control questions to confirm the attention of the participant, an example of such questions would be “Please choose ‘strongly disagree’ for this question”.
The final output of this instrument is a happiness score on a scale from 1 to 6, where 1 is a very unhappy person and 6 a very happy person. The full questionnaire can be found on the Annex chapter.
Virtues Questionnaire
The virtues questionnaire is based on the Virtues Scale first introduced by Cawley in 2000. According to the author, the tool was developed to understand the relationship between personality and moral development. Modern psychology prioritizes psychological traits to virtues (Allport, 1937), meaning that in most psychological frameworks the term virtue is notoriously absent to the detriment of psychological traits – even though there are similarities between the two concepts. For example, the personality trait model “Five Factor Model” which is one of the most widely used psychological models, refers to traits such as Agreeable, Conscientious, Honest and Modest, that could also be referred to as virtues (Costa Jr and McCrae, 1992).
The measurement of virtues becomes important to study the character of individuals, which can be seen as the interpretation of one’s behaviour and not one’s personality traits that are bound to be more stable through time (Cawley et al., 2000).
The Virtues Scale developed by Cawley is a set of 140 Likert questions that are then factored into 4 main virtues which have to be processed from participant’s 140 answers. These 4 factors, or main virtues, are EMPATHY, ORDER, RESOURCEFULNESS, and SERENITY. Each of the 140 questions are intended to ask about one specific virtue and have a cluster of 3 sentences so that the user better grasps the overall idea of each virtue. After assessing the main idea of each sentence cluster, the participant responds how intensely he
identifies with that idea. Answers range on a scale from 1 to 7 where 1 is “Strongly Disagree” and 7 is “Strongly Agree”.
These are 3 exemplary questions (each question is a cluster of 3 phrases) taken from the virtues questionnaire.
Question 1:
I am able to show clear and sound judgement;
I have good common sense and practical intelligence;
The people who know me best would describe me a sensible, judicious, and clearheaded.
Question 2:
I have confidence in my skills and abilities;
I have positive expectations for my future;
The people who know me best would describe me as confident, certain, and self-reliant.
Question 3:
I enjoy the pursuit of knowledge and understanding;
I read a great deal in order to remain well informed;
The people who know me best would describe me as knowledgeable, learned, and well read.
Using a cluster of sentences instead of a direct question greatly reduces subjectivity and better explains to participants about the virtue being inquired. This reduces ambiguity and increases the overall quality of responses. As in the happiness questionnaire, control questions were also included such as “Please choose ‘strongly agree’ for this question” to guarantee participants responded attentively.
Because participants were self-reporting evaluation of their own virtues (which are usually seen as desirable by society) there was the concern of social desirability bias in a questionnaire such as this one. On this matter it has been previously discussed that “social desirability scales are better interpreted as measures of substantive traits than as indicators of response bias and that they are of little use as suppressor variables in correcting scores from other scales” (McCrae and Costa, 1983). Therefore no social desirability corrections were applied to the results of the virtues questionnaire.
4.4. TIMELINE
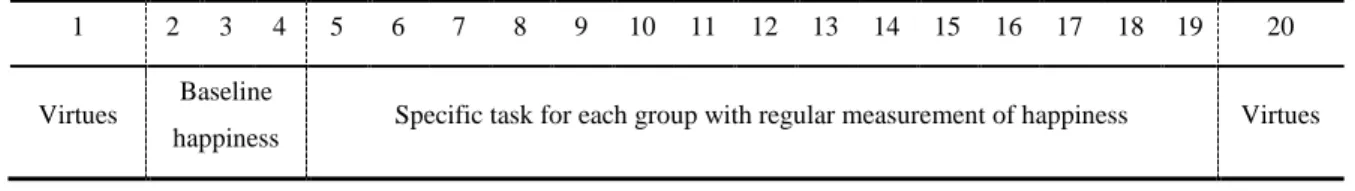
The first phase of the study was quantitative, lasted for 20 days, and included the filling of 10 questionnaires per participant. Following these 20 days an individual interview was conducted with each participant individually. Qualitative data gathered from the interviews compose the second part of the study and complement the quantitative data. Table 4 illustrates the evolution of the first phase of the study, highlighting the questionnaires asked through the 20 days.
TABLE 4 – OVERALL TIMELINE OF THE FIRST PART OF THE STUDY, EVOLUTION MEASURED IN DAYS
The virtues questionnaire was conducted twice, on the first and last day the study. During the days that followed between these two questionnaires (a total of 18 days) participants were required to fill out the happiness questionnaires. These happiness questionnaires were administered on alternate days for two main reasons: firstly to avoid exhaustion from participants, having to answer 20 questionnaires in 20 days might create fatigue on respondents; and secondly to avoid participants remembering their previous answers, since the happiness questionnaire was the same every time, conducting it with a minimal interval might distort participants answers from their memory of previous answers.
Despite having the same overall timeline, participants also had to perform their own task according to the group they were allocated to. For this, participants were asked to initiate their task on day 6 of the study, and maintain until the last day. The reason for starting the group tasks after the study had begun was to gather a baseline value for the happiness questionnaires, more precisely, every participant answered the happiness questionnaires twice before starting their tasks. Furthermore, before beginning the study participants were not aware that this task would arise, and they were only informed the day before they had to initiate it. This guarantees that the baseline values are unequivocally comparable across groups independently of group to which they belong.
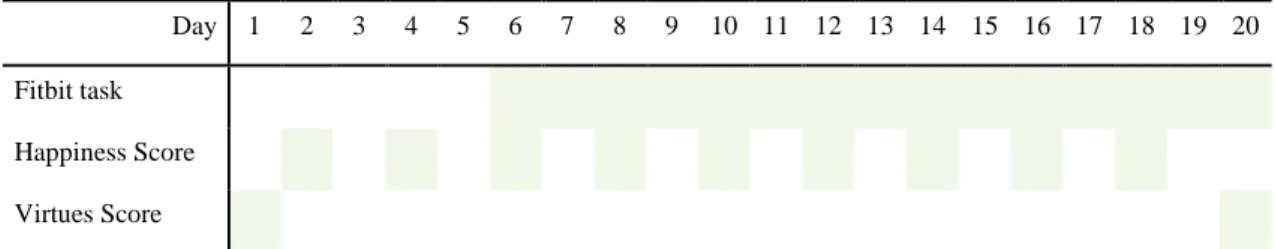
For a detailed timeline of each group’s activity and questionnaires on each day of the study please refer to Table 5, Table 6 and Table 7, with a comparison of each group’s detailed activities.
1 2 3 4 5 6 7 8 9 10 11 12 13 14 15 16 17 18 19 20
Virtues Baseline
TABLE 5 – GROUP 1 DETAILED TIMELINE
Day 1 2 3 4 5 6 7 8 9 10 11 12 13 14 15 16 17 18 19 20 Fitbit task
Happiness Score Virtues Score
Note: highlighted area represents existence of specific activity on that day.
TABLE 6 – GROUP 2 DETAILED TIMELINE
Day 1 2 3 4 5 6 7 8 9 10 11 12 13 14 15 16 17 18 19 20 Fruit task
Happiness Score Virtues Score
Note: highlighted area represents existence of specific activity on that day.
TABLE 7 – GROUP 3 DETAILED TIMELINE
Day 1 2 3 4 5 6 7 8 9 10 11 12 13 14 15 16 17 18 19 20 Happiness Score
Virtues Score
RESULTS
This chapter summarizes the main results from all the questionnaires collected and the interviews conducted with study participants. Results will first be analysed with descriptive statistics, focusing both on the happiness and the virtues questionnaires, and then individual interviews will be discussed. Initial result interpretation and preliminary conclusions will also be provided.
DESCRIPTIVE STATISTICS Happiness Score
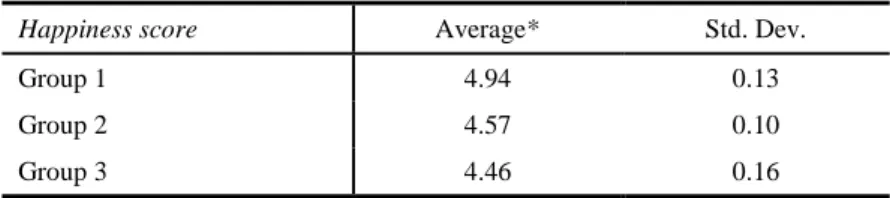
Study results show that the average happiness score of Group 1 was higher than Group 2 which in turn was higher than Group 3. Table 8 translates these findings, noting that the considered average is the average of all measurements of the happiness score for each participant from each group. Considering the small size of the sample it needs to be considered that some participants will naturally have higher happiness scores than others, independently of this study. Therefore it will be more relevant to analyse each participant’s evolution opposed to the participant’s absolute happiness score. Standard deviation follows the inverse trend of each groups’ average, as seen on Table 8, meaning that apparently Group 3 registered more variability in its answers than Group 2 or Group 1.
TABLE 8 – AVERAGE AND STANDARD DEVIATION OF HAPPINESS SCORE (AGGREGATE TIME)
Happiness score Average* Std. Dev.
Group 1 4.94 0.13
Group 2 4.57 0.10
Group 3 4.46 0.16
*Note that the average of each group includes values from all moments in time.
It can be seen on Table 9 that the three groups have individuals with significantly different baseline happiness scores. As it has been stated in the methodology chapter, the first two happiness measurements were done prior to any change in each group’s tasks (or knowledge of future tasks). Despite this fact, Group 1 starts with a somewhat higher average happiness score than the other two groups.
TABLE 9 – EVOLUTION OF EACH GROUPS’ AVERAGE HAPPINESS SCORE THROUGH TIME
Day 1 3 5 7 9 11 13 15
Group 1 4.71 4.85 4.92 5.03 5.05 5.14 4.86 4.98 Group 2 4.54 4.53 4.64 4.61 4.59 4.68 4.62 4.34 Group 3 4.22 4.52 4.57 4.49 4.23 4.60 4.46 4.61
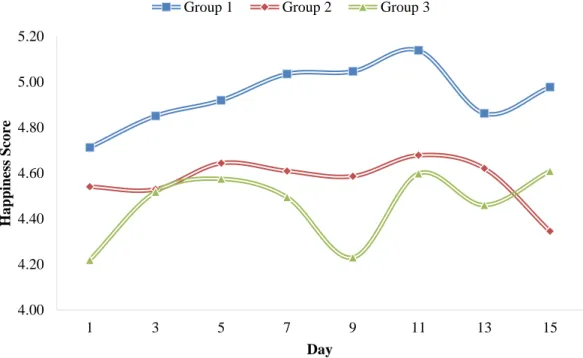
Analysing each groups’ evolution in Figure 3 it can be said that Group 1 had a consistently positive evolution through time until the 13th day, when it had an abrupt decrease in the happiness score albeit with a slight regain on the following measurement point. Group 2 had a relatively constant evolution with an overall slight gain from the beginning up until the 13th day – where it also registered a decrease on the happiness score, with an even more aggravated decrease in the happiness score on the following measurement point. Group 3, on the other hand, experienced a quite erratic evolution of the happiness score. This group seemed to follow a random evolution of the score with high increases followed by steep decreases.
FIGURE 3 – EVOLUTION OF THE AVERAGE HAPPINESS SCORE OF EACH GROUP THROUGH TIME
The total gain or loss in happiness during the period of the study should also be looked at. This indicator shows the increase or decrease in the average happiness score during the study. For this purpose the average happiness score was calculated for each group from the first 3 and compared to the last 3 measurements of each group’s score. The difference between these two values provide a good metric of gain or loss in the happiness score per group. The
4.00 4.20 4.40 4.60 4.80 5.00 5.20 1 3 5 7 9 11 13 15 H a pp ines s Sco re Day
average of the first and last 3 measurements were used to minimize potential random error inside each group.
TABLE 10 – GAIN OR LOSS IN HAPPINESS SCORE PER GROUP
Gain/loss in happiness score*
Group 1 0.16
Group 2 -0.02
Group 3 0.12
*Calculated as the difference between the first 3 and last 3 measurements of the happiness score
Table 10 summarizes the described calculations. It is noted that Group 1 has an overall gain of 0,16 in the happiness score of its members, while Group 2 registers close to no change with a slight loss of 0,02 in its score, and Group 3 also registers a gain of 0,12 in the happiness score.
TABLE 11- INCREASES AND DECREASES OF THE HAPPINESS SCORE COMPARED TO THE PREVIOUS MEASUREMENT
Day 3 5 7 9 11 13 15
Group 1 0.14 0.07 0.11 0.01 0.09 -0.28 0.11
Group 2 -0.01 0.11 -0.03 -0.02 0.09 -0.06 -0.28
Group 3 0.30 0.06 -0.08 -0.26 0.37 -0.14 0.15
Note that the shaded cells highlight the days in which the happiness score increased for that group in that day.
Putting in evidence how each group performed in each happiness score versus the previous measurement, Table 11 shows the increase or decrease in the happiness score for each day versus the previous measurement of the same score. It can be said that Group 1 was the one with the highest consistency through time. The fact that Group 1 registered an increase of the happiness score in all measured moments except on the 13th day seems to suggest that there was something sustaining that growth. On the other hand, the variability of Group 2 and Group 3 don’t allow conclusions to be made from these Groups’ evolution of the happiness score. This information is consistent with previous comments from Table 8 indicating a higher variability (standard deviation) for Group 2 and Group 3 when compared with Group 1.
Virtuous Behaviour
Analysing the results from the virtues score questionnaires can help understand the validity of H2 as previously stated in the theoretical framework. Looking at Table 12 it can be said that in the beginning of the study the 3 different groups share similar virtues score on all 4 factors, or main virtues as explained in the literature. On the other hand the difference between factors is significant, noting how the highest scoring factor is Factor 1 with 5,7, and Factor 4 the lowest scoring factor with 3,6, on a scale from 1 to 7.
TABLE 12 – VIRTUOUS SCORES AT THE BEGINNING OF THE STUDY
Factor 1 Factor 2 Factor 3 Factor 4
Group 1 5.6 4.4 5.1 3.9
Group 2 5.5 4.7 5.6 4.0
Group 3 5.9 4.4 5.3 3.0
Average 5.7 4.5 5.3 3.6
Remember that the 4 factors represent the 4 main virtues being them EMPATHY, ORDER, RESOURCEFULLNESS and SERENITY, respectively.
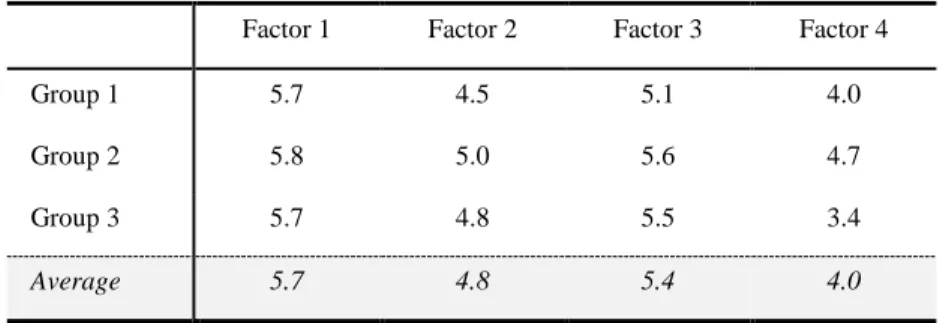
When the virtuous scores are confronted with exactly the same measurement at the end of the study it is clear that little to no changes can be registered in the two measurements. Table 13 represents the measurement of the virtuous score at the end of the study and it can be seen how closely these values match the first measurement in the beginning of the study, shown in Table 12.
TABLE 13 – VIRTUOUS SCORE AT THE END OF THE STUDY
Factor 1 Factor 2 Factor 3 Factor 4
Group 1 5.7 4.5 5.1 4.0
Group 2 5.8 5.0 5.6 4.7
Group 3 5.7 4.8 5.5 3.4
Average 5.7 4.8 5.4 4.0
To better grasp the evolution between the two measurements, the difference of the two tables was calculated and is represented in Table 14. In fact the values of Table 14 are so small that the evolution of the virtuous score during the study is more likely attributed to random error than to real changes in participants’ virtues and behaviour. The limited time span between
the two measurements might be responsible for the similar scores in the virtuous questionnaires. Results and limitations will be discussed in the following chapters.
TABLE 14 – GAIN/LOSS* IN VIRTUOUS SCORE
Factor 1 Factor 2 Factor 3 Factor 4
Group 1 0.1 0.1 0.0 0.2
Group 2 0.3 0.4 0.0 0.7
Group 3 -0.2 0.5 0.2 0.4
Average 0.1 0.3 0.1 0.4
*Difference of scores in two measurement points from Table 12 and Table 13.
QUALITATIVE INFORMATION
At the end of the study individual interviews were conducted with participants of the study. These interviews were used as a complement to the quantitative data gathered through the use of questionnaires. The main results of the gathered responses is presented in this chapter.
Initial excitement
All participants form Group 1 explained how the use of their newly acquired smart bracelet made them very happy in the beginning, but then at some point started to fade away. In fact it was said more than once that the novelty factor was very important in motivating them during the first week.
“It was like having a new toy to play with, but after some time you get tired of it” – Group 1 participant
Apparently the increase in the happiness score during the first 12 days for Group 1 was in part fuelled by the presence of a new device. Participants from Group 1 were exploring the features of the device and it kept them engaged during the first days. The critical issue is to understand whether these devices have the power to sustain engagement after the novelty factor brushes off.
It’s also important to note that participants from Group 2 and Group 3 also reported some initial excitement from participating in the study – an effect that will also be discussed in the study’s limitations.
“I was curious to see what was going to happen. Each day I would open the questionnaire waiting for new questions and trying to guess what was
this all about” – Group 3 participant
Therefore two types of initial motivation could be found among study participants:
1. Excitement around the new device – applies strictly to Group 1 and also affects consumers after their initial device purchase – highly relevant on real-life use of connected devices;
2. Excitement/curiosity around the study – applies to all the 3 groups and is only relevant in the context of this research, meaning that it won’t affect real world usage of connected devices.
Critical timing for gamification
The service behind the Fitbit Flex provides a gamification system with badges that are triggered based on users’ activity. Participants from Group 1 said they received badges from their achievements. The whole gamification system is supposed to increase motivation and sustain engagement of the bracelet through time. Participants, however, said that the gamification strategies used were sometimes not that motivating. The main reason pointed out was the exaggerated number of communication points from the company. In fact one participant said the number of daily emails he received from the company was annoying and did not influence his motivation to increase his performance goals.
“Every day I got an email with a new achievement even if I did not do anything special in that day. I think feedback information should be
instantaneous and appear on the bracelet” - Group 1 participant
The fact that the communication about the personal results and achievements was asynchronous with the user’s activity made it less valuable and less motivating for the user.
The referred user mentioned that all rewards should appear at the time the user actually ‘achieves’, and this would increase the relevancy of the whole gamification rewards.
Increasing self-awareness
Participants from Group 1 were very enthusiastic about some of the potentialities of the smart bracelet. One of the features that participants were very satisfied with was the ability to track their sleep. Behind their interest with this feature was their curiosity to know how many hours they slept, how many times they woke up during the night, and the overall quality of their sleep. Participants had mixed answers about change in behaviour, meaning that it was not evident that more insight on their sleep patterns would not make them change their routines to improve sleep quality. They were simply curious to know about their behaviour. This explains why the initial excitement with the smart bracelet quickly fade away, their sleep information would not change dramatically through time – especially because they were not trying to change their habits to improve sleep indicators – so inevitably their sleep information would soon be less interesting and eventually of no interest at all.
Nonetheless, all participants from Group 1 said they learnt new things about their own behaviour and that the daily statistics helped them to become more aware of their routines.
“I was really happy to get my iPhone in the morning and see a detailed graph of my sleep pattern from the previous night” – Group 1 participant
There was also an interesting side effect of the study that applied to all three groups. Because participants were constantly being asked questions about how they felt and about their feelings towards their personal life, the questionnaires themselves acted as a way of quantified self. Several participants said that by answering the questionnaires they were posing questions to themselves that they otherwise wouldn’t.
“We usually run around every day and don’t have time to think. Answering these questionnaires made me stop and think about some
This resulted in participants being more aware of their behaviour as time passed – increasing self-awareness. It is a mild way of self-quantification, much like the traditional methods for self-quantification already mentioned in the previous chapters. But in the short time period of the study its effect was felt by some participants across groups.
Tiredness on the 13th day
On the 13th day of the study all participants registered a substantial drop in their happiness score, and it was considered important to explore the causes of such a decrease. The first reason put forward was that the happiness score decreased as a consequence of fatigue from answering the repeating questionnaires for almost two weeks, this could be a limitation of the study in the sense that the instruments used created a side-effect on participants ability to answer accurately the questionnaires after this period of time. Indeed some participants reported fatigue in completing the questionnaires after some time and backed the claim of tiredness in their study participation. Fatigue in answering can therefore be define as a negative emotion towards the study that started to build at the end of the experiment. The already discussed novelty effect also affected answers after the first 13 days since the administered questionnaires were all the same. As nothing ‘new’ was added, fatigue eventually settled in which affected their answers by the end of the study. We can therefore define this effect as a positive emotion that was built in at the beginning of the study – as part of the experiment – but eventually decreased and affected their interest in participation.
Social Sharing
This research study did not focus on the sharing of self-quantification data. It was nonetheless asked of participants, to understand if a social dimension played a role in the use of the device. As it turned out, nobody from Group 1 shared any results of their daily achievements. Quite the opposite, participants said that in the beginning, after setting up the device for the first time, they made sure all sharing abilities were turned off. As the trend in such devices is to put sharing services at the forefront of the experience, users might be looking for more privacy in regards to their personal data – a sharp contrast between users’ actual use of the device versus what device manufacturers push to consumers.
Behavioural changes
During the interviews participants were asked about how the smart bracelet affected their day-to-day behaviour. Participants could not give a clear answer as to whether or not having
the smart bracelet made them behave differently. They stated that although they were sometimes eager to complete their daily goal of steps and calories, other factors weighed in – such as their availability or other personal life constraints.
“Sometimes I would not achieve my daily steps goal, but it’s not like I was going to miss the deadline of my assignments and go for a run alone in
the middle of the night!” – Group 1 participant
It was postulated that the bracelet was only a small element that could impact daily behaviour and other dimensions also weighed in in behavioural change. This aspect is critical in the usage of these smart devices and it will be added to the theoretical framework later.
INTERPRETATION AND COMMENTS
The results of this experiment indicate that quantified-self through the use of a smart bracelet has a positive impact on individual happiness – validating H1. At the same time, it could not be confirmed that self-quantification has a positive impact in the practice of virtuous behaviour, leaving H2 for further research.
Research suggests that the two studied hypothesis represent two pathways to increase individual happiness, one in the short-term and the other in the long-term. H1 appears to have had a greater impact on participants during the study, but only lasted while novelty of the device existed. This suggests that behind the positive effect of H1 is a perception of something new and exciting to play with – which can never have long-lasting effects. H2 on the other hand is expected to have a more durable effect on participant’s happiness and well-being. The successful improvement of habits will be more difficult to occur, but more long-lasting. Although results didn’t confirm the viability of H2 it should not be discarded entirely. Participants’ interviews demonstrated that the smart bracelet gave them incentives to improve their daily habits, but it was not the only element required to impact on their behaviour. Furthermore, virtuous behaviour which is intrinsically personal and highly engrained in one’s habits, would require more time to register changes.
Consequently, it is suggested that H2 should be further studied. Considering the present findings, it seems relevant to explore on the requirements for behavioural change to occur, instead of simply analysing the changes in virtuous behaviour.
FIGURE 4 – INITIAL THEORETICAL FRAMEWORK
Starting with the previously introduced theoretical framework (Figure 4) this study will now suggest further alterations to the model. The extended model will be presented and explained in detail in the next chapter. Some of the already presented findings have many similarities with consumer behaviour theory, which is used to structure the extended model.
EXTENDED MODEL
Qualitative information suggests that alterations should be made to the model. From participants’ feedback it was understood that self-awareness, motivation and opportunity must be present for significant behaviour changes to occur. While Group 1 reported a positive effect on self-awareness and motivation, consequence of the bracelet usage, there was no direct impact on opportunity. This study understands this to be one of the main reasons for some participants to not change their behaviour significantly. Figure 5 formalizes an extended model from the one previously introduced in Figure 4. The extended model incorporates key insights from the study’s results, and it will now be explained in more detail.
FIGURE 5 – EXTENDED THEORETICAL FRAMEWORK
Quantified Self Individual
Happiness Virtuous behaviour H2 H3 H1 Behavioural change
Quantified Self Individual
Happiness Self-awareness
Motivation
The extended model introduces 3 key components for behavioural change. These 3 key dimensions relate to previous literature, more specifically to the MOA (Motivation, Opportunity and Ability) model firstly introduced in 1986 (Batra and Ray, 1986a) and enhanced in 1989 (Maclnnis and Jaworski, 1989). The MOA model explores 3 main dimensions as critical for consumers to react to advertising messages. These dimensions are Motivation, Ability and Opportunity. It’s a widely accepted model in the field of Consumer Behaviour theory and has been used in many different sectors. For example, the MOA model was applied in Spain to study the key drivers for online airline ticket purchases and how MOA can impact patrons’ intentions for airline tickets (Bigné et al., 2010).
The MOA model will now be used in this study to complete the initially proposed model and expand it to the proposed Extended Model in Figure 5. With regard to participant’s feedback, the dimension Ability was not identified as a key driver for behavioural change. On the other hand it was identified that the dimension Self-awareness would play such a role, and therefore in this research a parallelism between the two dimensions is made. The three dimensions will now be explored in the context of this study.
SELF-AWARENESS
In the original literature of the MOA model the authors include Ability as a key dimension. It is understood that ability is the participant’s belief about his own skills and competences, and therefore his capacity to complete a given task, or achieve a certain goal. In the context of this research such dimension would be intrinsically associated with self-awareness and therefore the parallelism between the two is created in this study. Here, self-awareness is the participant’s knowledge of himself and this knowledge refers to all the biometric signals and personal behavioural patterns that the self-quantification devices allow him to register. The participant’s perception of his own behaviour must be improved for him to act on this information. Therefore it is stipulated that self-awareness is a key element for the participant to have the ability to change his individual behaviour.
“If you cannot measure it, you cannot improve it” – Lord Kevin
Individual interviews with study participants revealed that self-awareness was greatly improved through self-quantification. The curiosity of discovering some of their unique
patterns (such as the sleep pattern) made the process of using the smart bracelet a way to learn more about themselves. Therefore, quantification positively impacts on self-awareness.
MOTIVATION
Motivation is commonly viewed as a force that directs individuals towards goals. According to the MOA approach, motivation incorporates readiness, willingness, interest and desire to engage in a determined behaviour (Maclnnis and Jaworski, 1989). In the specific context of this study, motivation is considered to be the desire of participants to change their individual behaviour.
Through the use of gamification elements users are encouraged to achieve their goals – these elements will often be centred on the attribution of virtual badges and trophies. This system has the power to motivate users to improve their daily lifestyle and change their behaviour. Nevertheless, users reported that the gamification layer lacks the required elements to sustain motivation in the long term. This limitation is, however, a design flaw – meaning that such devices could improve to motivate users in a more sustainable way.
It was also found that self-awareness, as discussed previously, was a catalyst for motivation to occur. In fact the discovery of new individual information was a trigger to motivate participants to change their behaviour. While this might be true, it was also discovered that self-awareness can only spark motivation for a short period of time. This means that the first stream of individual knowledge that participants learn and that increases their self-awareness is good at motivating participants to act on that information. But it is also evident that if no new information comes from the smart devices motivation needs to come from elsewhere – hence the gamification layer. It was already stated that the study itself provided an initial source of motivation, but this motivation also faded away as initial excitement of the smart device and the study disappeared.
Therefore, it is understood that self-quantification devices can improve user motivation in two main ways:
1. Through the use of gamification techniques (daily goals, achievement badges and trophies). It has the power for long term sustainable motivation but needs improvement to become more engaging.
2. As a side-effect from self-awareness. The more relevant information users learn about themselves the more motivated they will be to act on that information. This
source of motivation is short-lived and requires new relevant insights delivered to users – that were substantially different from the previous ones.
Self-quantification devices have the power to motivate individuals, but there is still room for improvement in the way they interact with users.
OPPORTUNITY
Opportunity was the sole dimension that did not registered a direct impact from the use of self-quantification devices. In fact it was pointed out by participants several times that there was no relation between opportunity and the use of the smart bracelet. Opportunity is seen as availability of time and favourable conditions that enable action (Maclnnis and Jaworski, 1989). Although participants might had the required information of what was wrong with their behaviour (or knew a way to improve it), sometimes they simply had not enough time to change their routine – even if they had the motivation to change it.
There is a spill over effect from motivation to opportunity – as individuals are more motivated to achieve a certain goal they can make adjustments to their lifestyle to accommodate new routines, and thus creating opportunity. Even if this might be true there always needs to be some flexibility, which exists only where there is some degree of opportunity. As it is discussed in the study limitations, the fact that participants were not self-selected means that their motivation was not to achieve a particular goal, meaning that it was not expected that they would go around and change their routines because their goals were not that evident and would not require a great deal of change in their lifestyle.
DISCUSSION
From the initial theoretical framework to the extended model presented it is clear that self-quantification has an impact on happiness but not is not enough to impact behavioural change.
This study accepts H1 with some limitations. While goal setting and goal achievement can result in increased consumers’ happiness and well-being, study results seem to suggest that this only happens for a short period of time. This is being fuelled by a consumption drive other than a real sustainable change in consumers’ well-being. After the initial purchase of the device, interest on the device fades away and the link between self-quantification and individual happiness disappears. A sustainable change in consumers’ happiness will only occur through change in behaviour.
It was clear that without opportunity consumers cannot change their habits, and motivation and self-awareness have no direct impact on opportunity. For some participants the device had a positive impact on behaviour, but the mixed answers on this issue suggest that for some participants opportunity was already there – allowing the device to impact on behaviour – while other participants had no flexibility in their schedules to accommodate the required changes, therefore the device was not impacting their behaviour.
Following up with individual interviews it was also clear that there is an interconnection between the three proposed dimensions. In fact, one of the participants said that he made an effort to change his schedule because he was motivated to change his habits. In the previous chapters it has been advanced that self-awareness could impact positively on motivation. It also seems that self-awareness and motivation can both have a positive indirect impact on opportunity. This study then suggests a spill over effect among the three key dimensions, meaning that one dimension can positively impact on the other two. The result is that if smart bracelets could improve on their motivation systems and become more enticing to consumers, they could complete the missing link and allow consumers to change their behaviour and thus improve their individual happiness. This spill over effect would come by improving user experience of the device, better covering the limitations of the service as previously mentioned.