Electromagnetic Interference Analysis of Industrial
IoT Networks: From Legacy Systems to 5G
Rogério Dionísio
DiSAC - R&D Unit
Polytechnic Institute of Castelo Branco
Castelo Branco, Portugal https://orcid.org/0000-0002-6810-2447
Teodora Loli´c
Faculty of Technical Sciences University of Novi Sad
Novi Sad, Serbia
https://orcid.org/0000-0001-5522-6558
Pedro Torres
School of Technology
Polytechnic Institute of Castelo Branco
Castelo Branco, Portugal https://orcid.org/0000-0003-4835-5022
Abstract—The presence of Industrial IoT systems on the factory shop floor in recent years, are becoming an attractive solution with many advantages, including flexibility, low cost and easy deploy-ment. As more and more devices are wirelessly connected, spectral noise level increases and consequently radio interference between IoT devices. In this paper, we present an agnostic methodology to assess radio interferences between different industrial IoT systems on the factory floor, using appropriate propagation models. Several interference scenarios are simulated, ranging from legacy systems to future communication standards implementations (5G). We highlight some of the challenges and open issues that still need to be addressed to decrease interference and make industrial wireless systems compatible.
Index Terms—Electromagnetic Interference, 5G, Industrial IoT, SEAMCAT
I. INTRODUCTION
During the last 30 years, the industry has automated every-thing that can be automated in the factory shop-floor, using wired technology. The main processes which have so far not been fully automated are the integration of logistics, material handling, and factory automation. The integration of logistics, material handling, and factory automation can only be achieved by using wireless technology [1]. The fourth industrial revolu-tion (Industry 4.0) brings a total transformarevolu-tion of industrial production through the fusion of digital technology and the internet with the conventional industry, causing all processes on the factory floor to be digitally connected. Wireless tech-nologies in industrial production his already present nowadays. We see a multitude of wireless technologies being used for different use cases in industrial production. Initially, wireless technologies were used for selected non-critical applications, but increasingly wireless technology is becoming the norm, and increasingly, it is becoming more and more used in mission-critical applications. According to a survey from HMS [2], currently, the most comprehensive wireless technology in industrial production is WiFi. Most respondents indicated that they are using it either on the factory floor or in their products (74 %). In addition to that, 39 % of the interviewees indicated using Bluetooth, and in some cases, specifically Bluetooth Low Energy (BLE) in their companies. A smaller part, 13 %, mentioned their companies were also using other wireless communication systems: WirelessHART, ZigBee, SigFox, or
LoRA, among others. Wireless communications systems re-move the physical barriers of traditional wired communication architectures at a reduced level of cost, are easy to deploy, require low maintenance, and are flexible [3]. However, all these technologies are using unlicensed frequency bands, such as the Industrial, Scientific, and Medical (ISM) band. As the ISM band do not require any license, radio interference management is not only challenging because of the noise level and heavy usage, but because of the different standards operating in parallell [4]. There is also the legal limit to the level of emitted radiation of unlicensed bands. As a result, range and wall penetration of the radiated power is low. In brief, the use of unlicensed spectrum for industrial applications may not satisfy the more demanding quality requirements [1]. For this reason, the full potential of wireless technologies in the industry has not yet been fully implemented. The advent of 5G, the mobile network of the 5thgeneration, promises to overcome the
shortcomings of other wireless systems [5]. 5G was designed to become the new standard for industrial connectivity. It offers different configurations fitted to the usage scenarios identified by the ITU-R: Enhanced Mobile Broadband (eMBB), Massive Machine-Type Communication (mMTC), and Ultra-Reliable Low Latency Communications (URLLC). 5G uses licensed frequency bands. In Europe, the carrier frequencies planned for 5G networks are 700 MHz, 900 MHz, 2100 MHz, 3.5 GHz, and 26 GHz [6]. Even if they all fall outside the ISM bands and 5G networks manage frequencies centrally, they need to coexist with legacy systems. Without proper filtering for each band, emissions from intermodulation products, spurious or out-of-band emissions can cause spurs outside the allocated channel. Thus, potential interference between 5G networks and legacy radio systems in the shop-floor should be investigated. So far, research was conducted to assess the interference between 5G mobile networks and other services in the 26 GHz band [7]. In 2016, the Radio Spectrum Policy Group (RSPG) considered the frequency band 3400-3800 MHz (n78) [8] to be the primary band suitable for the introduction of 5G-based services in Europe in the short term (i.e. in 2020), given that it is already harmonized for mobile networks and offers wide channel band-width [9], [10]. More recently, with the publication of 3GPP Standard (Release 16) in July 2020 [11], several additional
operating bands were assigned to 5G, with frequencies channels adjacent to the 2.4 GHz ISM band. In particular, operating band n53 ranges between 2483.5 MHz and 2495 MHz, both for uplink or downlink, in TDD mode. The objective of this paper is to simulate interference scenarios on the factory floor using the appropriate propagation models and system configuration. We will conduct a coexistence analysis between 5G New Radio (NR) local Base Station (BS) and User Equipment (UE) operat-ing in band n53 and legacy systems (e.g. WiFi, WirelessHART, Bluetooth) using the 2.4 GHz ISM band. The rest of the paper is organized as follows. Section II provides an overview of the methodology used in the interference simulations. Section III presents the radio system specifications. Section IV describes the interference scenarios. Section V discusses the simulation results and highlights the findings. Finally, Section VI presents paper conclusions together with future work proposals.
II. METHODOLOGY
The criterion used for interference to occur to have interfer-ence to noise ratio I/N less than the minimum allowable value. First, we need to establish the wanted signal from the corre-sponding transmitter C , to compute the I/N of the receiver from legacy systems, suffering from interference (victim link). This signal is produced by the interfering transmitter I , and the thermal noise N . Aforementioned is done by defining technical parameters for each radio system. The process includes the receiver and transmitter specifications of both the victim and the interfering links, the propagation model associated with the medium of communication, and a measure of the quality of service required. The position of the victim transmitter and receiver is identified, and a link budget is computed. The same process occurs for the interfering system. Knowing both the victim signal and the interfering signal allows the victim receiver I/N to be computed using a Monte-Carlo technique. After all, the systems are configured and the simulation runs a series of trials. For each trial, the received primary signal C is compared to the sensitivity S of the victim link receiver. If C falls below S , the trial is discarded. Then, if I/Ntrial is
higher than I/Ntarget, no interference is registered; Otherwise,
interference occurs, and this event accumulates to the number of trials with the same result (Kint). Finally, when all trials are
computed (Kall), the probability of interference is expressed as
[12],
Pinterf erence= Kint/Kall (1)
This way, we are able to quantify the probability of interfer-ence between a victim link and interferer system, considering many independent simulation trials in an agnostic way. SEAM-CAT - Spectrum Engineering Advanced Monte- Carlo Analysis Tool [6], from CEPT, is used to study the interference between legacy systems like WiFi, WirelessHART, Bluetooth and 5G systems using a Monte Carlo technique for the radio simulation model.
III. SYSTEMSPECIFICATIONS
This section describes the radio systems, including the trans-mitter and the receiver, used in the interference analysis in Section IV.
A. Legacy System Specifications
The technical specifications for WiFi, Bluetooth and Wire-lessHART systems are presented in Table I.
TABLE I
WIFI, WIRELESSHART,ANDBLUETOOTH TECHNICAL SPECIFICATIONS.
❵ ❵ ❵ ❵ ❵ ❵ ❵ ❵ ❵ Property System
WirelessHART WiFi Bluetooth Frequency band 2400-2483.5 MHz Channel bandwidth 1 MHz 22 MHz 1 MHz Channel spacing 5 MHz 25 MHz 1 MHz Number of channels 16 3 (1,6,11) 79 In-Block EIRP 10 dBm 20 dBm 0 dBm Antenna height Tx: 2.5 m Tx: 3.0 m Tx: 1.5 m Rx: 1.0 m Rx: 1.5 m Rx: 1.5 m
Antenna type omnidirectional
Antenna gain Tx: 2 dBi Tx: 6 dBi Tx: 0 dBi Rx: 0 dBi Rx: 0 dBi Rx: 0 dBi Receiver sensitivity -90 dBm -95 dBm -95 dBm Environment 50 % indoor 100 % indoor
50 % outdoor below roof
Propagation model ITU-R Extended
P.1546-6 Hata SRD
Coverage radius 200 m 50 m 20 m
Prob. Transmission 10 % 90 % 50 %
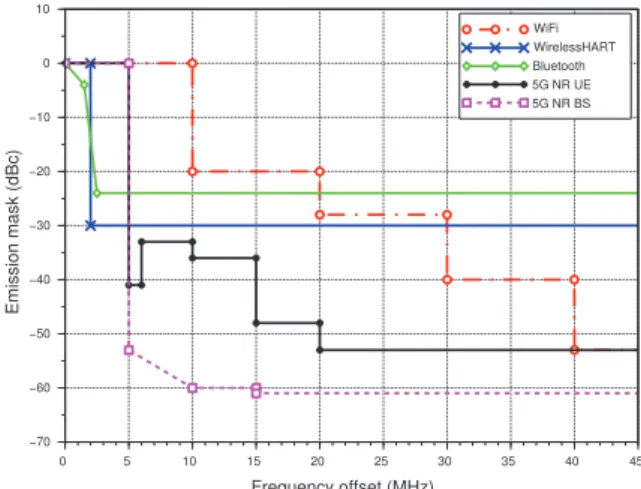
WiFi and Bluetooth systems are assumed to be indoor (wall loss= 10 dB, std dev = 5) and wirelessHART has 50 % outdoor probability. Antenna pattern is assumed to be omnidirectional in azimuth and elevation. Transmitter's emission masks and re-ceiver's blocking masks for WiFi, Bluetooth, and wirelessHART are represented in Fig. 1 and Fig. 2, respectively [13].
0 5 10 15 20 25 30 35 40 45 0 −60 −40 −20 −70 −50 −30 −10 10 Frequency offset (MHz) Emission mask (dBc) WiFi WirelessHART Bluetooth 5G NR UE 5G NR BS
Fig. 1. WiFi, Bluetooth, wirelessHART and 5G NR Transmitter emission masks.
WirelessHART and WiFi systems use ITU-R P.1546-6 (Land Mobile, 50 % time, 50 % locations, dense urban clutter)
0 2 4 6 8 10 12 14 16 18 20 0 −20 20 40 60 −10 10 30 50 Frequency offset (MHz) Blocking mask (dB) WiFi WirelessHART Bluetooth 5G NR UE 5G NR BS
Fig. 2. WiFi, Bluetooth, wirelessHART and 5G NR receiver blocking masks.
propagation model, which s is adequate for this particular scenario. For Bluetooth, we use the Extended Hata SRD model that is adequate to devices with antenna heigh up to 3 m and a distance range up to 300 m. Each system was also configured to implement frequency hopping among their available channels. The frequency channel is randomly selected among a list of available channels from the 2.4 GHz ISM band to simulate frequency hopping for Bluetooth and WirelessHART systems. All the channels have an equal probability of being selected. To accommodate a similar approach for WiFi, e.g. some APs have the capability to scan the spectrum and allocate a different channel for the system, channels 1 (2.412 GHz), 6 (2.437 GHz) and 11 (2.462 GHz) are listed with equal usage probability during the simulations. The transmission probability was also differentiated among all systems to mimic real scenarios (90 % for WiFi, 10 % for WirelessHART, and 50 % for Bluetooth).
B. 5G System Specifications
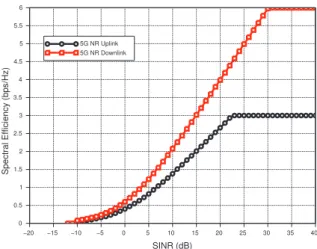
The specification of the Base Station (BS) [11] and the User Equipment [8] are listed in Table II and Table III, for macro cells and micro cells, respectively. Transmitter's emission masks and receiver's blocking masks of BS ad UE are represented in Fig. 1 and Fig. 2, respectively. A lookup table is used to map the throughput in terms of spectral efficiency (bps per Hz) with respect to the computed SINR level [14]. Link level data (bitrate mapping) is represented in Fig. 3 for uplink and downlink traffic in micro and macro cells.
Antenna pattern is a 3GPP tri-sector for BS and is assumed to be omnidirectional in azimuth and elevation for UE. During simulations, we consider that the receiver antenna always returns the peak gain value specified, regardless of the direction. From 3GPP Standards for BS (Table 5.3.5-1) [11] and UE (Table 5.3.2-1) [8], the Resource Block (RB) bandwidth can be computed using the following equation,
BWRB= (BWChannel− 2 × BWGB)/NRB (2) 0 −20 −15 −10 −5 5 10 15 20 25 30 35 40 0 2 4 6 1 3 5 0.5 1.5 2.5 3.5 4.5 5.5 SINR (dB) Spectral Efficiency (bps/Hz) 5G NR Uplink 5G NR Downlink
Fig. 3. Bitrate mapping for 5G NR Uplink (circles) and Downlink (squares).
wereBWRBis the RB bandwidth,BWChannelis the
Chan-nel Bandwidth, NRB is the number of Resource Blocks and
BWGB is the guard-band bandwidth. Considering operating
band n53 with 15 kHz Sub-Carrier Spacing (SCS), the RB bandwidth is (10000 − 2 × 312.5)/52 = 180 kHz.
TABLE II
5G NRTECHNICAL SPECIFICATIONS FORBASESTATION ANDUSER
EQUIPMENT FOR AMACROCELL.
❵ ❵ ❵ ❵ ❵ ❵ ❵ ❵ ❵ Property System
Base station User Equipment Frequency band 2483.5 - 2495 MHz (n53, TDD) System bandwidth 10 MHz Bandwidth of a RB 180 kHz Maximum RB per BS 52 Number of RB per UE 13 In-Block EIRP 46 dBm 24 dBm Antenna height 30 m 1.5 m
Antenna type tri-sector 3GPP peak gain antenna
Antenna gain 15 dBi 0 dBi
Min. Coupling Loss 70 dB
Receiver Noise Figure 4 dB 8 dB Propagation Model ITU-R P.1546-6, mobile
Handover margin 3.1 dB Environment 100 % outdoor 10 % outdoor, 90 % indoor: wall loss = 10 dB std. dev. = 5
IV. SIMULATIONSCENARIOS
The criterion used for interference to occur in legacy systems is to have interference to noise ratio I/N less than -6 dB [15]. The same value is also used for 5G cellular networks as a protection criterion. This value was considered because, in an industrial scenario, the interference has to be very low to avoid communication failure between the machines and between the machines and operators, but this does not imply that other I/N values cannot be used. All the simulation scenarios consists of one victim link, and one or more interfering links and networks.
TABLE III
5G NRTECHNICAL SPECIFICATIONS FORBASESTATION ANDUSER
EQUIPMENT FOR AMICROCELL.
❵ ❵ ❵ ❵ ❵ ❵ ❵ ❵ ❵ Property System
Base Station User Equipment Frequency band 2483.5 - 2495 MHz (n53, TDD) System bandwidth 10 MHz Bandwidth of a RB 180 kHz Maximum RB per BS 52 Number of RB per UE 13 In-Block EIRP 46 dBm 24 dBm Antenna height 6 m 1.5 m
Antenna type peak gain antenna
Antenna gain 6 dBi 0 dBi
Min. Coupling Loss 53 dB
Receiver Noise Figure 4 dB 8 dB Propagation Model ITU-R P.1546-6, mobile
Handover margin 3.1 dB Environment 100 % outdoor 10 % outdoor, 90 % indoor: wall loss = 10 dB std. dev. = 5
The relative position between the victim and interferer systems follows a uniform spatial distribution inside the area of the factory, and allow the simulation of mobility among wireless devices. Several scenarios with different characteristics are needed to get acceptable results from interference simulations. Therefore, we consider three deployment and several coexis-tence scenarios:
• Deployment 1: Interference over legacy systems from
legacy systems;
• Deployment 2: Interference over legacy systems from
legacy systems and 5G UE (hybrid, UL);
• Deployment 3: interference over 5G BS (hybrid, DL) and
5G UE (hybrid, UL), from legacy systems.
A. Deployment 1
All simulation scenarios are composed of one victim system, and one or more interfering system, where each of them is composed of one transmitter and one receiver. Every legacy system (WiFi, Bluetooth, and wirelessHART) was considered in turn a victim link and an individual interfering link for the other two systems, as described in Table IV. We considered a downlink scenario in which the transmitter is an Access Point (AP) or gateway and the receivers are mobile devices. All the receivers will be randomly deployed within the area centered on the transmitter and delimited by the coverage area, to simulate movement among wireless systems. The coverage area is delimited by a rectangular area with a size of 80 m × 80 m, to simulate an environment similar to a factory shop-floor.
B. Deployments 2 and 3
From the list of possible environments for the deployment of 5G networks for industrial applications presented in Section I, we select a cellular test environment to execute the simulations consisting of two layers, a 2-tiers macro layer and a micro layer.
TABLE IV
COEXISTENCESCENARIOS BETWEENLEGACYSYSTEMS
Victim System Interferering System Scenario 1 WiFi Bluetooth Scenario 2 WirelessHART WiFi Scenario 3 WirelessHART Bluetooth Scenario 4 Bluetooth WiFi Scenario 5 WiFi WirelessHART Scenario 6 Bluetooth WirelessHART
The macro-layer base stations are placed in a regular grid with 15 km spacing between BSs, following an hexagonal layout with three transmitters each, as shown in Fig. 4 below. For the micro layer, there are two micro sites randomly dropped in each macro transmitter coverage area [16]. Each micro site has a coverage area of 300 m. For each simulations, legacy systems are uniformly located at the proximity of the center of the reference cell in Fig. 4.
Fig. 4. Celular layout of 5G NR hybrid scenario with macro and micro cells [17].
V. RESULTS ANDDISCUSSION
A. Interference over Legacy Systems
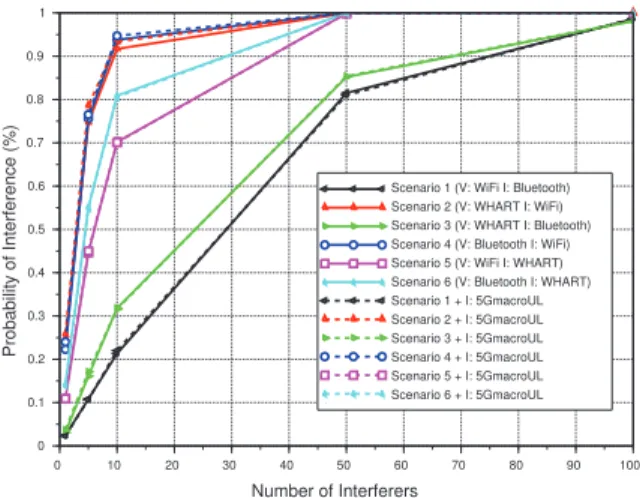
Twenty thousand events (trials) have been run in each simu-lation. For each victim link, we increase the number of legacy interferers from 1 to 100 (1,5,10,50,100), and compute the probability of interference exceeding the predefined criterion I/N = −6 dB. Results from Fig. 5 (full line) shows that the worst-case came from WiFi interfering with Bluetooth systems. With 10 WiFi BS interferers, the probability of interference exceeding the predefined criterion is higher than 95 %. On the opposite side, the best scenario is between WiFi as a victim link and Bluetooth as the interferer system. For the same ten interferers and the same criterion, the probability of interference is 21 %.
When a 5G cellular network is added as an interferer, the interference results are presented in Fig. 5 (dashed line) for
0 10 20 30 40 50 60 70 80 90 100 0 1 0.2 0.4 0.6 0.8 0.1 0.3 0.5 0.7 0.9 Number of Interferers Probability of Interference (%)
Scenario 1 (V: WiFi I: Bluetooth) Scenario 2 (V: WHART I: WiFi) Scenario 3 (V: WHART I: Bluetooth) Scenario 4 (V: Bluetooth I: WiFi) Scenario 5 (V: WiFi I: WHART) Scenario 6 (V: Bluetooth I: WHART) Scenario 1 + I: 5GmicroUL Scenario 2 + I: 5GmicroUL Scenario 3 + I: 5GmicroUL Scenario 4 + I: 5GmicroUL Scenario 5 + I: 5GmicroUL Scenario 6 + I: 5GmicroUL
Fig. 5. Probability of interference for 6 different coexistence scenarios between WiFi, Bluetooth and wirelessHART systems, with (dashed lines) and without (full lines) 5G NR UE in uplink mode in a micro cell.
a 5G macro-cell in uplink mode and Fig. 6 (dashed line) for a 5G micro-cell in uplink mode. For each simulations, and according to the specifications given in Table II and Table III (13 RBs per UE), the maximum number of active users (UE) per BS is three. The simulation results shows an overall deterioration of the interference levels due to the presence of an additional interfering system in an adjacent frequency channel (n53) closed to 2.4 GHz ISM band. The deterioration is more pronounced when interference is coming from UE uplink from a cellular micro-cell. 0 10 20 30 40 50 60 70 80 90 100 0 1 0.2 0.4 0.6 0.8 0.1 0.3 0.5 0.7 0.9 Number of Interferers Probability of Interference (%)
Scenario 1 (V: WiFi I: Bluetooth) Scenario 2 (V: WHART I: WiFi) Scenario 3 (V: WHART I: Bluetooth) Scenario 4 (V: Bluetooth I: WiFi) Scenario 5 (V: WiFi I: WHART) Scenario 6 (V: Bluetooth I: WHART) Scenario 1 + I: 5GmacroUL Scenario 2 + I: 5GmacroUL Scenario 3 + I: 5GmacroUL Scenario 4 + I: 5GmacroUL Scenario 5 + I: 5GmacroUL Scenario 6 + I: 5GmacroUL
Fig. 6. Probability of interference for 6 different coexistence scenarios between WiFi, Bluetooth and wirelessHART systems, with (dashed lines) and without (full lines) 5G NR UE in uplink mode in a macro cell.
B. Interference over 5G Systems
For the same criterion I/N = −6 dB, other simulations were conducted to identify the effect of non-licensed systems,
using the ISM band (2.4 GHz), over 5G networks using a licensed spectrum in band n53. The results are measured in bitrate loss, as a function of the number and kind of legacy interferers (WiFi, WirelessHART or Bluetooth). The results from Fig. 7 shows the average bitrate loss for a hybrid 5G network (macro-micro cell) in downlink mode, considering a variable number of interferers (1, 100, and 1000) for each individual legacy interfering system. The average bitrate loss increases proportionally with the number of interferers, and Wifi systems are causing higher losses, up to 0.14 % when 1000 devices are present in the vicinity of the BS.
0 100 200 300 400 500 600 700 800 900 1 000 0 0.1 0.02 0.04 0.06 0.08 0.12 0.14 Number of Interferers
Average bitrate loss (%)
WiFi Bluetooth WirelessHART
Fig. 7. Average bitrate loss for a hybrid 5G network BS downlink, considering the interference criterion I /N = -6 dB.
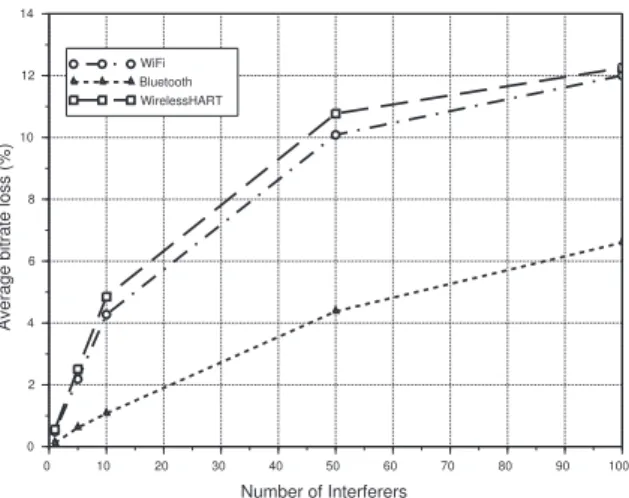
Fig. 8 shows the interference simulations results from legacy systems into 5G macro cell network using spectrum band n53, considering the uplink scenario. We have considered a variable number of interferers (1, 5, 10, 50 and 100) for each individual legacy system. The average bitrate loss increases proportionally with the number of interferers. The results shows a similar bitrate degradation effect from WiFi and WirelessHART inter-ferers over the 5G uplink, with a bitrate loss over 10 % in the presence of 50 interferers or more.
VI. CONCLUSION
In this paper, we use SEAMCAT as an agnostic simulation tool to assess radio interferences between three wireless com-munication systems commonly used on the factory shop floor (WiFi, Bluetooth, and WirelessHART) and a 5G network. As more and more devices are wirelessly connected, spectral noise level increases and consequently radio interference between devices. Considering that critical or massive machine-type communication on the factory shop-floor may be using wireless systems soon, spectrum compatibility studies are essential to assess coexistence between them. These studies, expressed for instance in terms of interference probability or bitrate loss, are needed to evaluate, define and validate rules and conditions under which new or evolved technologies, such as legacy
0 10 20 30 40 50 60 70 80 90 100 0 10 2 4 6 8 12 14 Number of Interferers
Average bitrate loss (%)
WiFi Bluetooth WirelessHART
Fig. 8. Average bitrate loss for a hybrid 5G macro network UE uplink, considering the interference criterion I /N = -6 dB.
wireless systems or newcomers such as 5G mobile, can access spectrum. The results from the interference scenarios have shown that, from an electromagnetic point of view, interference levels affect the receiver of legacy systems, 5G UE, and 5G BS differently, and to some extent, may affect their performance. From the simulated scenarios, legacy systems are more prone to suffer interference from other legacy systems working in co-channel arrangements (e.g. 2.4 GHz ISM band) than from 5G networks using the adjacent channel n53. When the 5G network is simulated as the system suffering interference, legacy systems produces a higher degradation in the UE uplink channel , with a maximum bitrate loss of 12 % with WiFi as the interfering system.
REFERENCES
[1] 5G-ACAI, “5G for Connected Industries and Automation, 2nd
Ed.” ACAI, Tech. Rep., February 2019.
[2] M. Alzin, “5G: Is the industry ready? - Study about the preparedness of industry for 5G,” HMS industrial Networks, Tech. Rep., 2019. [3] M. Ehrlich, L. Wisniewski, and J. Jasperneite, “State of the art and future
applications of industrial wireless sensor networks,” in Kommunikation und Bildverarbeitung in der Automation. Springer, 2018, pp. 28–39. [4] J. Mennig, L. Hajek, and P. Munder, “5G in Production,” Umlaut, Tech.
Rep., October 2019.
[5] S. A. Ashraf, I. Aktas, E. Eriksson, K. W. Helmersson, and J. Ansari, “Ultra-reliable and low-latency communication for wireless factory au-tomation: From LTE to 5G,” in 2016 IEEE 21st International Conference on Emerging Technologies and Factory Automation (ETFA), 2016, pp. 1– 8.
[6] G. Ancans and V. Bobrovs, “Spectrum Usage for 5G Mobile Commu-nication Systems and Electromagnetic Compatibility with Existent Tech-nologies,” Broadband Communications Networks–Recent Advances and Lessons from Practice//Haidine A., Aqqal A., ed. London: IntechOpen, pp. 27–41, 2018.
[7] F. P. A. Teixeira, L. C. Freitas, and J. C. W. A. Costa, “Interference Analysis between 5G Mobile Networks and Fixed Services in the 26 GHz Band,” in 2019 7th International Engineering, Sciences and Technology Conference (IESTEC), 2019, pp. 592–595.
[8] 3GPP, “TS 138 101-1 V15.10.0 (2020-07), Technical Specifications: “5G; NR; User Equipment (UE) radio transmission and reception; Part 1: Range 1 Standalone (Release 15)”,” ETSI, Tech. Rep., July 2020.
[9] Radio Specrum Committee, “Opinion of the RSC pursuant to Advisory Procedure under Article 4 of Regulation 182/2011/EU and Article 4.2 of Radio Spectrum Decision 676/2002/EC,” European Commision, CEPT Mandate RSCOM16-40rev3, December 2016.
[10] Keysight Technologies, “Understanding 5G Coexistence - Testing Re-quirements,” Keysight, White Paper, August 2020.
[11] 3GPP, “TS 38.104 V16.4.0 (2020-06) - 3rd Generation Partnership Project; Technical Specification Group Radio Access Network; NR; Base Station (BS) radio transmission and reception (Release 16),” ETSI, Tech. Rep., June 2020.
[12] R. Dionisio, P. Marques, and J. Rodriguez, “Interference study between wireless microphone systems and TV White Space devices,” in 2012 IEEE International Conference on Communications (ICC), 2012, pp. 1874– 1878.
[13] S. Petersen and S. Carlsen, “Performance evaluation of WirelessHART for factory automation,” in 2009 IEEE Conference on Emerging Technologies & Factory Automation. IEEE, 2009, pp. 1–9.
[14] A. J. Viterbi, A. M. Viterbi, and E. Zehavi, “Other-cell interference in cellular power-controlled cdma,” IEEE Transactions on Communications, vol. 42, no. 234, pp. 1501–1504, 1994.
[15] D. Guiducci, P. Faris, and J. Carrascosa, “How to evolve regulation with technologies for the effective spectrum management,” in 2018 IEEE 29th Annual International Symposium on Personal, Indoor and Mobile Radio Communications (PIMRC), 2018, pp. 795–799.
[16] Radiocommunication Study Groups - Working Party 5D, “Guidelines for evaluation of radio interface technologies for IMT-2020,” ITU, Draft 557 rev1, October 2017.
[17] ECO - European Communications Office. SEAMCAT (Spectrum Engi-neering Advanced Monte Carlo Analysis Tool).
![Fig. 4. Celular layout of 5G NR hybrid scenario with macro and micro cells [17].](https://thumb-eu.123doks.com/thumbv2/123dok_br/15916691.1093337/4.892.459.832.430.712/fig-celular-layout-hybrid-scenario-macro-micro-cells.webp)