ISSN 1546-9239
© 2012 Science Publications
Utilization of Charge Transfer and
Kinetic Methods for the Determination of Doripenem
Nora H. Al-Shaalan
Department of Chemistry, Faculty of Science,
Princess Nora Bint Abdul Rahman University, Riyadh, Saudi Arabia
Abstract: Problem statement: This study presents rapid, uncomplicated and sensitive spectrophotometric techniques for the analysis of doripenem in both its pure and pharmaceutical forms. Approach: The main principle of the approaches and procedures that have been developed is the reaction of doripenem as an n-electron donor to ninhydrin and π-acceptors, such as tetracyanoethylene, 7,7,8,8-tetracyanoquinodimethane, 2,3,5,6-tetrachloro-1,4-benzoquinone, 2,3-dichloro-5,6-dicyano-1,4-benzoquinone and chloranilic acid. The wavelengths 580, 264, 320, 357, 375 and 465 nm was used for measuring the resulting complexes for ninhydrin, chlorine, chloranilic acid, DDQ, TCNQ and TCNE respectively. Results: The suggested procedures for the determination of doripenem were successfully put into practice with good recovery; the percent recovery ranged from 99.31-100.55. Benes-Hildebrand plots were also used to study the association constants and the free energy changes. Conclusion: The results of the CT method agree with those of the kinetic method and there is no significant difference between them.
Key words: Charge transfer, kinetic method, association constants, significant difference, chloranilic acid, energy changes, stability studies, aqueous solutions
INTRODUCTION
Doripenem (S-4661) is a novel carbapenem with antibacterial activity against a broad range of Gram-positive and Gram-negative bacteria. For example, against members of the family Enterobacteriaceae, Homophiles influenza and Mirabella catarrhal is, the MIC90 (MIC: minimum inhibitory concentration) range from 0.032-0.5 g mL−1 (Tsuji et al., 1998). In all carbapenems, a β-lactic ring is required for their antibacterial activity (Cielecka-Piontek et al., 2011).
Two other parenteral carbapenems panipenem and biapenem are licensed in the Far East, whereas faropenem, an oral penem, is available in Japan and India and the first oral carbapenem, tebipenem received approval in Japan in 2009 (Hikida et al., 1999). Doripenem's EU and US indications cover intra-abdominal infection and complicated urinary tract infection, with clinical trials supporting its use in nosocomial pneumonia currently under review by the US Food and Drug Administration and the European Medicines Evaluation Agency (Livermore, 2009). As with meropenem, ertapenem and biapenem, doripenem has a 1-β-methyl group, hindering attack by renal dehydropeptidase (Mori et al., 1996) and unlike imipenem, does not need to be protected with a dehydropeptidase inhibitor. Doripenem also has a weaker protoconvulsive effect than imipenem and
meropenem (Horiuchi et al., 2006). A literature survey reveals the use of only high-performance liquid chromatography for the determination of doripenem. The HPLC method was developed for doripenem determination in intravenous solutions (Psathas et al., 2008), in body fluids (Sutherland and Nicolau, 2007) and during stability studies in aqueous solutions.
Ultraviolet spectrophotometry (first-derivative, first-derivative of ratio spectra and bivariate analysis) was used in the stability-indicating determination of ertapenem (Zajac et al., 2006; 2007; Hassan et al., 2009), meropenem (Elragely et al., 2008; Mendez et al., 2003) and doripenem (Piontek and Jelinska, 2010).
In general, the charge-transfer complexation can simply depend on the ionisation potential of the donor and the electron affinity of the acceptor (Hamed et al., 1998; Mulliken, 1950). The most important feature of this non-covalent interaction is that it is the primary director of the specificity, rate control and reversibility of many biochemical reactions (Foster, 1969). In addition, stoichiometric reaction of the donor and acceptors depends primarily on the nature of the donor and acceptor and, in some cases, on the solvent used (Dozal et al., 2000; Alqaradawi and Nour, 2004; El-Din, 1985).
511 determination of doripenem in pharmaceutical formulations. The methods are based on the reaction of the primary amino group of doripenem with ninhydrin and π-acceptors.
MATERIALS AND METHODS
Apparatus: All absorption spectra were measured in the region 700-250 nm using a Shimadzu UV-1601 (UV-visible) spectrophotometer with a scanning speed of 200 nm min−1 and a band width of 2.0 nm, equipped with 10 mm matched quartz cells.
Materials and reagents: All of the reagents and solvents used were of analytical reagent grade. In addition, de-ionised water was used in all preparations. Doripenem for the injections, DORIBAX™ (Janssen-Cilag International NV), is a white to slightly yellowish off-white sterile crystalline powder. The injection vials contained 500 mg of doripenem monohydrate on an anhydrous basis. NIN, CH, CHA, DDQ, TCNQ and TCNE were purchased from Merck Schuchardt OHG, Darmstadt, Germany.
General procedure:
Preparation of standard stock solutions for charge transfer:
Standard stock solutions preparation: A standard solution of doripenem in ethanol (EtOH) with a concentration of 0.1 mg mL−1 was prepared and stored in the dark at a temperature less than 25°C. Standard solutions of CH, ChA, DDQ and TCNE with concentrations of 2.5 mg mL−1 for CH and 1.5 mg mL−1 for ChA, DDQ and TCNE were prepared freshly in ACN every day. The solution of 1 mg mL-1 TCNQ in acetonitrile (ACN) was observed to be stable for a minimum of one week at 5°C. A fresh solution of the ninhydrin reagent was prepared daily in mthanol with a concentration of 1.5 mg mL−1.
Approach 1 (with ninhydrin): A 1.5 ml aliquot of the ninhydrin/mthanol reagent and 10 mL of de-ionised water were added to each test tube of a group of test tubes containing different aliquots of the drug (doripenem) solution and then the test tubes were heated for 20 min in a water-bath at 65±5°C. After cooling, a final concentration range of 1.5-25 mg mL−1 was obtained by transferring the solutions from the test tubes to volumetric flasks and adding de-ionised water to the desired volume. The absorbance of the solutions was measured against a blank sample at 580 nm to obtain a calibration curve, which was prepared by plotting the absorbance Vs. concentration.
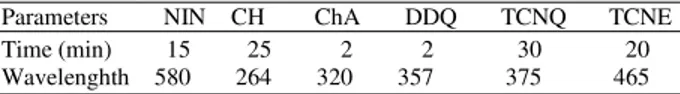
Table 1: Optimum conditions for the reaction between NIN and π -acceptors
Parameters NIN CH ChA DDQ TCNQ TCNE
Time (min) 15 25 2 2 30 20
Wavelenghth 580 264 320 357 375 465
Approach 2 (with π-acceptors): Doripenem/π -acceptor solutions with different final concentration ranges (5-15 mg mL−1 for ChA, 8-10 mg mL−1 for CH, 3-20 mg mL−1 for TCNE, 1-15 mg mL−1 for DDQ and 2-25 mg mL−1 for TCNQ) were prepared by adding 1 mL of the π-acceptors and 10 mL of ACN to volumetric flasks containing different quantities of drug solutions and these solutions remained at room temperature while the reaction occurred. (Table 1 shows the reaction times). Subsequently ethanol was added up to achieve the desired final volume and then absorbance of the solutions was measured against a blank sample at λ max values of 580, 264, 320, 357, 375 and 465 nm for ninhydrin, chloranil, chloranilic acid, DDQ, TCNQ and TCNE, respectively. By plotting the absorbance Vs. concentration, a calibration curve was obtained.
Preparation of standard solutions for the kinetic method: A 1.0 mL aliquot of 0.5 M NaOH and 2 mL of 4×10⁻³ M KMnO4 were mixed and transferred to a 25 mL calibrated flask. The appropriate amount of the drug (8-40 µg) was added and the solution was diluted to the desired final volume with double distilled water; the flask and its contents were shaken gently at room temperature for 20 min. The absorbance was measured directly at 508 nm against a blank. The concentration of the drug was then calculated from the corresponding equation for the calibration graph for the fixed time method.
Pharmaceuticals formulation procedures: For each formulation, approximately 5.0 mg of DORIBAX™ was weighed. A proper amount of the drug powder corresponding to 10 mg of doripenem was dissolved in 10 mL of ethanol. The procedure was performed as described in the general procedures.
Interference from excipients: The interference from excipients was studied by preparing samples consisting of 50 mg of doripenem mixed with different amounts of common excipients such as glucose, lactose, fructose, talc powder, starch the procedure was performed as described in the general procedures.
RESULTS AND DISCUSSION
Doripenem exhibits a weak UV absorption at 235 nm. Using well-known spectrophotometric methods, a low sensitivity is obtained (Alqaradawi and Nour, 2004).
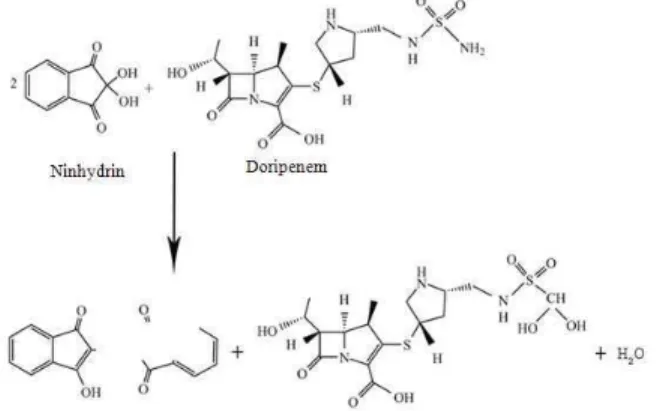
Reaction with Ninhydrin (NIN): Ninhydrin reagent is most commonly used to identify primary aliphatic amines (Cielecka-Piontek et al., 2011; Psathas et al., 2008). Generally, the main step of this reaction is heating the reagents for a short time in an organic solvent/water mixture; then the absorbance of the reaction product is measured at 580 nm (Gorog, 1995). During the reaction, an oxidative deamination of the primary amino group, representing the interaction between doripenem and the ninhydrin reagent in a methanol medium, occurs and produces a reduced ninhydrin that undergoes a condensation reaction to form a complex with a λ max of 580 nm (Fig. 1 and 2). Doripenem appears to be capable of reacting with ninhydrin only at higher temperatures. The maximum color of the reaction complex was acquired by heating the reaction solution for 15 min on a water bath at 65±5°C. Additionally, it was observed that an extended heating time reduced the chromomeric intensity, which emphasizes the importance of controlling the reaction time. To match the reaction criteria, many solvents such as water, methanol, ethanol, acetone, isopropanol, acetonitrile and dioxin have been examined. However, methanol provided the optimal results.
Fig. 1: Suggested reaction pathway between doripenem and NIN
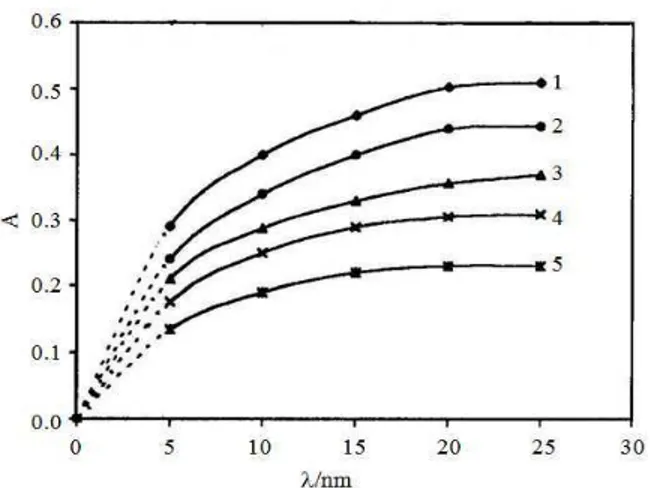
Reaction with π-acceptors: An intense coloration was produced by mixing the doripenem solution (Lewis base) and the π-acceptor solutions (Lewis acid) in an acetonitrile medium at room temperature, which indicates the formation of a CT complex. The formed complexes exhibited broad absorption bands in the 250-470 nm region as follows: 357 nm for DDQ, 320 nm for Chan, 264 nm for CH, 375 nm for TCNQ (Fig. 3) and 465 nm for TCNE (Fig. 2).
Fig. 2: Absorption spectra of the products of the reactions of doripenem with NIN and TCNE
Fig. 3: Absorption spectra of the products of the reactions of doripenem with CH, ChA, DDQ, and TCNQ
513
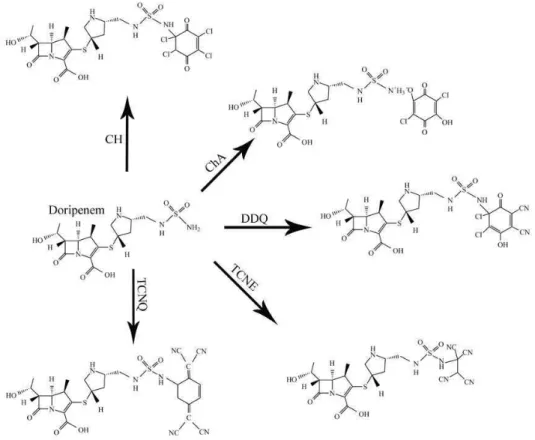
Fig. 5: Suggested reaction pathway between doripenem and CH, ChA, DDQ, TCNE and TCNQ
The formation of the CT complex was confirmed by the observation that none of the reactants was associated with the produced colors. A proposed mechanism for the formation of new bands could be represented by an electron-transfer complexation reaction between doripenem (lone-pair donor) and electron-deficient π -acceptors followed by the formation of radical ions. As the concentration of doripenem increased, the intensity of these bands increased. The proposed mechanisms with respect to each π-acceptor are depicted in Fig. 5. donor-acceptor mixture of the reaction was imperative for obtaining reproducible results. The transformation of the molecular complex (outer complex) into the inner complex involves the formation of radical ions, which is responsible for the observed wavelength and requires time to be completed. To optimize the conditions, some parameters, such as solvent, time, reagent concentration and temperature, were explored; one variable was changed and its effect on the absorbance of the colored complex was observed. Figure 4 displays representative spectra, which demonstrate the pure doripenem spectra and those of different concentrations of doripenem with a constant concentration of chloranil (75 mg mL−1). However, the change in the doripenem spectra with added chronal is understandable.
Reagent concentration: The ideal volume of the doripenem stock solution for conducting the assays with the polycyanoquinone and polyhaloquinone π -acceptors was found to be 1 mL, whereas 1.5 mL of ninhydrin was used. Thus, increased concentrations of the reagents used may be helpful for rapidly achieving equilibrium and minimizing the time needed for the CT complex formation.
Reaction time: The determination of the reaction time was performed by tracing the absorbance of the produced colour at different time periods at ambient temperature (25±5°C) for all of the reagents except ninhydrin (65°C). For each of the investigated reagents, the complete formation of the color was achieved either promptly or after 10-30 min (Table 1).
Association constants and standard free energy changes: The Benesi-Hildebrand equation was used for the determination of the association constants for the interaction of each drug with a NIN, CH, ChA, DDQ, TCNE or TCNQ complex (Benesi and Hidelbrand, 1949):
x
C a 1 1 1
= + ×
In this equation, Ca and Cb are the concentrations of the acceptor and donor, respectively. A is the absorbance of the complex, ε is the molar absorptivity of the complex and Kc is the association constant of the complex.
Table 2 shows straight lines that were obtained from plotting the values of Ca Vs. A according to the aforementioned equation. The standard free energy changes ( G°) for the complexation reaction were calculated from the association constants using the following equation:
G 2.303 RTlogKc
∆ ° = −
Here:
G° = The free energy change of the complex (kJ mol-1) R = The gas constant (0.001987 K cal mol−1 deg−1) T = The temperature in Kelvin (273°C) and
Kc = The association constant of the drug acceptor complexes (1 mol−1) given in Table 3 (Martin and Bustamante, 1993).
Reaction stoichiometry: Considering Job’s method of continuous variation the observed molar ratio of the doripenem to NIN, CH, ChA, DDQ, TCNE and TCNQ was 1:1 for all reagents except NIN, which had a ratio of 1: 2.
Quantification:
Linearity, accuracy and precision: Successive calibration standards were prepared and four linearity curves including seven non-zero concentrations were analysed to verify the linearity, accuracy and precision. For the proposed procedures, linear regression equations were acquired. A linear reliance of the absorbance on Beer’s law was demonstrated by the calibration curve as given in Table 2, which displays the results of the statistical analysis of the experimental data, including the slopes, intercepts and the square of the correlation coefficients acquired by the linear least-squares processing of the results. Solutions with different concentrations of doripenem were prepared and analysed in five replicates for the purpose of determining the accuracy and precision of the methods.
Table 2: Quantitative parameters for the reactions of doripenem with NIN, CH, ChA, DDQ, TCNE and TCNQ
Linearity Intercept Slope Molar Acceptor µg mL−1 A B r2 absorptivity
NIN 1-25 0.022 0.012 0.9990 43553
CH 8-10 0.011 0.031 0.9999 62322
ChA 5-15 0.001 0.026 0.9998 50992
DDQ 1-15 -0.031 0.054 0.9995 72466
TCNQ 2-25 -0.093 0.043 0.9997 94845 TCNE 3-20 -0.105 0.025 0.9999 81734
Table 4 summarises the analytical results obtained from this investigation. The values of the Relative Standard Deviation (RSD) and the Standard Deviation (SD) acquired were quite acceptable. According to the present experimental conditions, the intensity of the absorption at the specified wavelength is a function of the concentration of doripenem. Beer’s law plots in all studied situations were linear with very small intercept values (-0.105-0.022). Table 2 indicates that the slopes ranged from 0.012-0.054 in the general concentration ranges. A least-square method was used to derive the regression equations for the proposed procedures and the correlation coefficient ranged from 0.9995-0.9999.
Specificity: Several experiments were conducted to study the influence of common additives, excipients and adjutants on the proposed approach before handling the analysis of the pharmaceutical preparations. Regarding the interference resulting from the degradation products of doripenem and the interference of the excipients and additives commonly existing in pharmaceutical formulations, the Energy of the Charge Transfer (ECT) relies on the Ionisation Potential (IP) of the donor and the electron affinity of the acceptor (EA); thus, the λ max values of other p-donors differ from those of the examined acceptors if they can form Charge-Transfer (CT) complexes. The basic characteristics of doripenem gave rise to this specificity in the charge-transfer reaction of doripenem because they allow the charge transfer to occur; however, the low basicity of doripenem’s degradation products makes the charge transfer difficult to achieve. In the dosage forms, the potential interference caused by the excipients was also studied. Table 5 shows the obtained recovery percentages, which were good and no interference was observed from any of these excipients in the proposed approaches.
Detection Limit (DL) and Quantification Limit (QL): The DL and QL values for doripenem with NIN and each π-acceptor were calculated. The theoretical DL and QL values were examined by a real analysis of these concentrations via proposed methods.
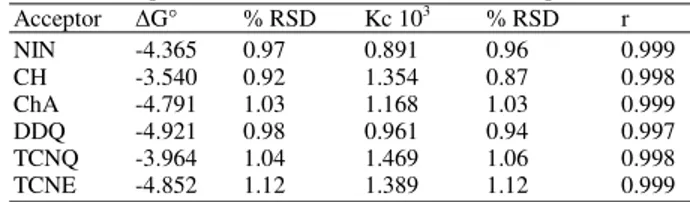
Table 3: Association constants (Kc), correlation coefficients and standard free energy changes ( G°) of the doripenem complexes obtained from Benesi-Hildebrand plots
Acceptor G° % RSD Kc 103 % RSD r
NIN -4.365 0.97 0.891 0.96 0.999
CH -3.540 0.92 1.354 0.87 0.998
ChA -4.791 1.03 1.168 1.03 0.999
DDQ -4.921 0.98 0.961 0.94 0.997
TCNQ -3.964 1.04 1.469 1.06 0.998
515
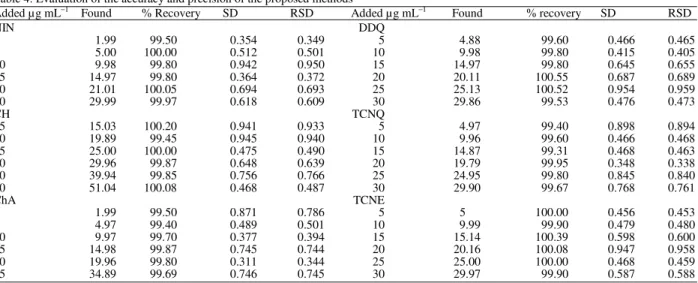
Table 4: Evaluation of the accuracy and precision of the proposed methods
Added µg mL−1 Found % Recovery SD RSD Added µg mL−1 Found % recovery SD RSD
NIN DDQ
2 1.99 99.50 0.354 0.349 5 4.88 99.60 0.466 0.465
5 5.00 100.00 0.512 0.501 10 9.98 99.80 0.415 0.405
10 9.98 99.80 0.942 0.950 15 14.97 99.80 0.645 0.655
15 14.97 99.80 0.364 0.372 20 20.11 100.55 0.687 0.689
20 21.01 100.05 0.694 0.693 25 25.13 100.52 0.954 0.959
30 29.99 99.97 0.618 0.609 30 29.86 99.53 0.476 0.473
CH TCNQ
15 15.03 100.20 0.941 0.933 5 4.97 99.40 0.898 0.894
20 19.89 99.45 0.945 0.940 10 9.96 99.60 0.466 0.468
25 25.00 100.00 0.475 0.490 15 14.87 99.31 0.468 0.463
30 29.96 99.87 0.648 0.639 20 19.79 99.95 0.348 0.338
40 39.94 99.85 0.756 0.766 25 24.95 99.80 0.845 0.840
50 51.04 100.08 0.468 0.487 30 29.90 99.67 0.768 0.761
ChA TCNE
2 1.99 99.50 0.871 0.786 5 5 100.00 0.456 0.453
5 4.97 99.40 0.489 0.501 10 9.99 99.90 0.479 0.480
10 9.97 99.70 0.377 0.394 15 15.14 100.39 0.598 0.600
15 14.98 99.87 0.745 0.744 20 20.16 100.08 0.947 0.958
20 19.96 99.80 0.311 0.344 25 25.00 100.00 0.468 0.459
35 34.89 99.69 0.746 0.745 30 29.97 99.90 0.587 0.588
Table 5: Recovery of doripenem in the presence of different excipients % Recovery
---
Ingredient NIN CH ChA DDQ TCNQ TCNE
Glucose 99.32 100.02 99.97 99.98 99.59 99.98 Fructose 100.00 100.10 99.91 99.79 99.76 99.47 Lactose 100.01 99.98 100.97 99.49 99.92 99.65 Starch 99.97 99.94 100.91 100.03 100.02 100.97 Talc 99.96 100.06 99.93 100.08 100.01 99.86
Table 6: Determination of the concentration of doripenem in commercial pharmaceutical preparations by the proposed and reference method (Mulliken, 1950)
Dorebax™ Mean% recovery SD RSD T-test F-test
Reference 99.60 1.01 1.01 0.07 1.11
NIN 99.30 1.03 1.03 0.11 1.21
CH 100.20 0.97 0.97 0.87 1.09
ChA 99.90 0.98 0.98 1.03 1.18
DDQ 99.70 1.03 1.03 1.06 1.21
TCNQ 100.40 1.05 1.05 1.11 1.28
TCNE 100.04 0.97 0.97 1.21 1.37
The QL values of doripenem with NIN, CH, ChA, DDQ, TCNQ and TCNE were 0.363, 1.02, 0.34, 0.21, 0.11 and 0.08 mg mL−1, respectively, whereas the DL values were 0.12, 0.45, 0.1, 0.05, 0.07 and 0.21 mg mL−1, respectively.
Analysis of pharmaceutical dosage forms: To analyze the doripenem in pharmaceutical formulations, the proposed spectrophotometric charge-transfer approaches were used in conjunction with the reference method (Mulliken, 1950). The same samples were involved in the determination. In the case of the calculated and theoretical values (95% confidence) of the proposed and formally valid methods, no substantial variation was observed between the results, as determined by t and F tests. However, these results suggest a similarity between accuracy and precision. The data in Table 6 indicate that the current procedures
could be introduced to the assay of these drugs in their single dosage forms without interference. Repeatedly, no interference was observed for the commonly encountered ingredients of the formulations. For the acceptors that were used, the recovery percentages ranged from 99.31-100.55.
Kinetic and optimization of the reaction condition: The reaction between doripenem and alkali potassium permanganate results in a maximum absorbance at 508 nm. Because the intensity of the color increases with time, this behavior was used to analyze the above-cited drug in its pure and pharmaceutical preparations.
The reaction rate increased substantially as the color development increased. Therefore, room temperature was selected as the optimum temperature. Heating the solution was observed to increase the rate of the reaction, but MnO2 was precipitated.
The increase in the reaction rate and the maximum absorbance as a function of time was investigated with increasing KMnO4 concentrations. It was observed that 2 mL of 4×10⁻³ M KMnO4 was adequate to achieve the maximum absorbance. Using more than 2 ml resulted in no change in the reaction rate and the maximum color intensity, whereas less than the optimal volume (2 mL) resulted in a color intensity that was less than the maximum value and required an increased time to form.
Fig. 6: Graphs of absorption versus time for the reaction between doripenem and potassium permanganate showing the dependence of the reaction on the doripenem concentration. The concentration of doripenem was (1) 2.14 ×10⁻⁵, (2) 3.21×10⁻⁵, (3) 4.28×10⁻⁵, (4) 5.36×10⁻⁵, or (5) 6.43×10⁻⁵ M, the concentration of sodium hydroxide was 0.5 M and the concentration of potassium permanganate was 5×10⁻³ at room temperature
To summarise the optimum working conditions for the kinetic analysis of doripenem, 1.0 mL of 0.5 M NaOH and 2.0 mL of 4×10⁻³ M KMnO4 at room temperature were used.
The rate of the reaction was also found to be dependent on the doripenem concentration. The rate was followed at room temperature with various concentrations (5-26 µg mL−1) of doripenem and KMnO4 and NaOH were maintained at the optimum concentrations described above.
It is clear from the graph shown in Fig. 6 that the rate increased as the concentration of the drug increased, indicating that the reaction rate obeys the following equation:
Rate = K` (drug) n
Here, K` is the pseudo-order rate constant and n is the order of the reaction.
The rate of the reaction was estimated by the variable-time method measurement as A/ t, where A is the absorbance and t is the time in seconds.
Taking logarithms of the rates and concentration, Eq. 1 can be transformed into the following equation:
(
)
Log rate = log A=log KW + n log
t drug
The regression of log (rate) versus log [doripenem] gave the following regression equation:
( )
Log rate = −0.517 + 1.04 log c (r = 0.9969)
Hence, K` = 0.304 sec-1 and the reaction is first order (n = 1.04) with respect to the doripenem concentration.
Initial-rate method (pseudo-zero-order-method): In the initial-rate method, graphs of the rate (at the beginning of the reaction) versus the drug concentration were difficult to obtain because the first step of the reaction is not rate determining and is too fast to follow; thus, tangents to the curves at zero time are difficult to draw. Therefore, this method was abandoned.
Rate-constant method: Graphs of log (absorbance) versus time for doripenem concentrations in the range of 1.5×10⁻⁵-6.5×10⁻⁵ M were studied and found to be straight lines. The pseudo-first order rate constants (K`) corresponding to different concentrations of doripenem were calculated from the slopes multiplied by -2.303 and are presented in Table 7.
A regression of C versus K` gave the following equation:
5
K' = −5.90 10× − + 0.133 C r = 0.9977
The poor linearity is likely due to changes in the rate constant (K`) with the inevitable slight changes in the elevated temperature of the reaction.
Fixed-absorbance method: The reaction rate was recorded for different concentrations of doripenem in the range of 1.4×10⁻⁵-6.6×10⁻⁵ M. A pre-selected value of the absorbance was fixed and the time was measured in seconds. The reciprocal of time versus the initial concentration of the drug (Table 7) was plotted. The following equation of the calibration graph was obtained:
(
)
1 / t = 1.98 10× − +3 9.7 10 3 C r × − = 0.9264
The range of the drug concentration giving the most acceptable calibration graph with the above equation was limited to 8-20 µg mL−1, which could be a disadvantage.
517
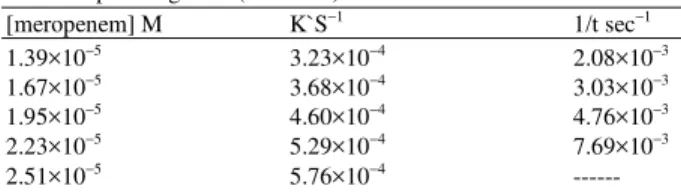
Table 7: Values of K` and the reciprocal of time for different rates of variable concentrations of the drug at constant concentrations of NaOH (0.5 M) and potassium permanganate (5×10⁻³ M)
[meropenem] M K`S−1 1/t sec−1
1.39×10⁻⁵ 3.23×10⁻⁴ 2.08×10⁻³
1.67×10⁻⁵ 3.68×10⁻⁴ 3.03×10⁻³
1.95×10⁻⁵ 4.60×10⁻⁴ 4.76×10⁻³
2.23×10⁻⁵ 5.29×10⁻⁴ 7.69×10⁻³
2.51×10⁻⁵ 5.76×10⁻⁴ ---
Table 8: Application of the proposed kinetic method to the determination of doripenem in its pharmaceutical formulation
Preparation Found±SD (%)a
DORIBAX™ 99.91±0.40
t = 1.02 (3.182)b
F = 1.84 (9.12)b aMean ± standard deviation of five determinations bThe tabulated
values of t- and F-tests at 95% confidence limit
The formation of doripenem includes a transfiguration of the hydroxyethyl group and the hydroxyl functionality is oxidized in two sequential steps, of which the second is rate determining, via conversion of the radical to a ketene.
Analysis of pharmaceutical dosage forms: The fixed method was applied to the determination of the studied drug in vial forms. The concentration of doripenem that was calculated using the corresponding calibration equation is shown in Table 8 at a fixed time of 20 min
CONCLUSION
The proposed approaches meet the enduring needs of the routine analysis of doripenem used in pharmaceutical quality control laboratories, particularly in terms of simplicity, accuracy, precision, speed and cost. These methods offer low cost analysis and maintain accuracy. Their application to the analysis of doripenem in pharmaceutical formulations was successfully performed. Because all of the utilised π -acceptor reagents showed proper outcomes in the quantitative analysis of doripenem and because the complexes form directly to obtain the lowest DL and QL values, it is recommended, according to a comparative study depending on the validation data, that ChA and DDQ are the most suitable reagents for doripenem analysis. Ninhydrin is also a suitable and useful reagent due to its derivitisation character through which it offered highly reliable statistical data in our experiment. The results of the CT method agree with those of the kinetic method and there is no significant difference between them.
REFERENCES
Alqaradawi, S.Y. and E.M. Nour, 2004. Synthesis and spectroscopic studies of the charge‐transfer complexes of 2,3‐diaminopyridine and π‐electron acceptors. Spectr. Lett.: Int. J. Rapid, 37: 337-345. DOI:10.1081/SL-120039468
Benesi, H.A. and J.H. Hidelbrand, 1949. A spectrophotometric investigation of the interaction of iodine with aromatic hydrocarbons. J. Am. Chem. Soc., 71: 2703-2707. DOI: 10.1021/ja01176a030
Cielecka-Piontek, J., K. Michalska, P. Zalewski and A. Jelinska, 2011. Recent advances in stability studies of carbapenems. Curr. Pharm. Anal., 7: 213-227. DOI: 10.2174/157341211797457989
Dozal, A., H. Keyzer, H.K. Kim and W.W. Way, 2000. Charge transfer complexes of K vitamins with several classes of antimicrobials. Int. J. Antimicrob. Agent, 14: 261-265. DOI: 10.1016/S0924-8579(99)00163-6
El-Din, A.M.N., 1985. Charge-transfer complexes of nitrones-IV. Molecular complexes of N-alkyl nitrones with π-acceptors. Spectrochim. Acta Part A: Mol. Spectr., 41: 721-724. DOI :10.1016/0584-8539(85)80180-X
Elragely, N.A., E.M. Abdel-Moety, N.Y. Hassan and M.R. Rezk, 2008. Stability-indicating determination of meropenem in presence of its degradation product. Talanta, 77: 28-36. DOI: 10.1016/j.talanta.2008.06.045
Foster, R., 1969. Organic Charge-Transfer Complexes. 1st Edn., Academic Press, London, ISBN-10: 0122626508, pp: 470.
Gorog, S., 1995. Ultraviolet-Visible Spectrophotometry in Pharmaceutical Analysis. 1st Edn., CRC Press, Boca Raton, ISBN-10: 0849386918, pp: 391. Hamed, M.M.A., M.I. Abdel-Hamid and M.R.
Mahmoud, 1998. Molecular Complexes of some N-Aryldithiocarbamates with π-Electron Acceptors. Monatshefte Fur Chemie/Chemical
Monthly, 129: 121-127. DOI:
10.1007/PL00010148
Hassan, N.Y., E.M. Adbel-Moety, N.A. Elragery and M.R. Rezk, 2009. Selective determination of ertapenem in the presence of its degradation product. Spectrochim. Acta A: Mol. Biomol. Spectrosc, 72: 915-921. PMID: 19167266
Horiuchi, M., M. Kimura, M. Tokumura, N. Hasebe and T. Arai et al., 2006. Absence of convulsive liability of doripenem, a new carbapenem antibiotic, in comparison with β-lactam antibiotics. Toxicology, 222: 114-124. DOI: 10.1016/j.tox.2006.02.004
Livermore, D.M., 2009. Doripenem: antimicrobial profile and clinical potential. Diagnostic Microbiol. Infect. Dis., 63: 455-458. DOI: 10.1016/j.diagmicrobio.2009.02.012
Martin, A.N. and P. Bustamante, 1993. Physical Pharmacy: Physical Chemical Principles in the Pharmaceutical Sciences. 4th Edn., Lea and Febiger, Baltimore, ISBN-10: 0812114388, pp: 622.
Mendez, A.S.L., M. Steppe and E.E.S. Schapoval, 2003. Validation of HPLC and UV spectrophotometric methods for the determination of meropenem in pharmaceutical dosage form. J. Pharm. Biomed. Anal., 33: 947-954. DOI: 10.1016/S0731-7085(03)00366-2
Mori, M., M. Hikida, T. Nishihara, T. Nasu and S. Mitsuhashi, 1996. Comparative stability of carbapenem and penem antibiotics to human recombinant dehydropeptidase-I. J. Antimicrob. Chemother., 37: 1034-1036. PMID: 8737157 Mulliken, R.S., 1950. Structures of complexes formed
by halogen molecules with aromatic and with oxygenated solvents. J. Am. Chem. Soc., 72: 600-608. DOI: 10.1021/ja01157a151
Piontek, J.C. and A. Jelinska, 2010. The UV-derivative spectrophotometry for the determination of doripenem in the presence of its degradation products, Spectrochimica Acta Part A: Mol. Biomolecular Spectroscopy, 77: 554-557. DOI: 10.1016/j.saa.2010.06.019
Psathas, P.A., A. Kuzmission, K. Ikeda and S. Yasuo, 2008. Stability of doripenem in vitro in representative infusion solutions and infusion bags. Clin. Ther., 30: 2075-2087. DOI: 10.1016/j.clinthera.2008.11.013
Sutherland, C. and D.P. Nicolau, 2007. Development of an HPLC method for the determination of doripenem in human and mouse serum. J. Chromatogr, B, 853: 123-126. DOI: 10.1016/j.jchromb.2007.03.004
Tsuji, M., Y. Ishii, A. Ohno, S. Miyazaki and K. Yamaguchi, 1998. In vitro and in vivo antibacterial activities of s-4661, a new carbapenem. Antimicrob. Agents Chemother, 42: 94-99. Zajac, M., J. Cielecka-Piontek and A. Jelinska, 2006.
Development and Validation of UV Spectrophotometric and RP-HPLC Methods for Determination of Ertapenem During Stability Studies. Chem. Anal., 51: 761-761.