.ufc.br
ISSN: 1984-2201
Copyright © 2002, Universidade Federal do Ceará
FIRE EFFECTS ON SOIL AND VEGETATION
IN A DEGRADED BRAZILIAN SAVANNA
(*) CORRESPONDING AUTHOR
Address: Av. João Naves de Ávila, 2121. Bloco H Sala 1H16, CEP: 38400-000, Uberlândia (MG), Brazil. Phone: (+55 )34-3291-6390 E-mail: silgel@ufu.br
Article history:
Received 28 May
, 2018
Accepted 20 June, 2018 Publisher 15 July
, 2018
(a) Phd Student in Geography. State University of Center West (UNICENTRO), Guarapuava (PR), Brazil. ORCID ID: https://orcid.org/0000-0002-7050-7339. CURRICULUM LATTES: http://lattes.cnpq.br/4069992796148459
(b) Msc in Geography. Federal University of Uberlândia (UFU), Uberlândia (MG), Brazil. ORCID ID: https://orcid.org/0000-0001-5461-4508. CURRICULUM LATTES: http://lattes.cnpq.br/9360376324743490
(c) Phd in Geography. Professor of the Federal University of Uberlândia (UFU), Uberlândia (MG), Brazil. ORCID ID: https://orcid.org/0000-0002-5376-1773. CURRICULUM LATTES: http://lattes.cnpq.br/0563872406702918
COSTA, Yasmmin Tadeu a * BARCELOS, Anna Carolina b RODRIGUES, Silvio Carlos c
ABSTRACT
This research consists of a comparative study through the controlled application of fire under different
conditions of natural and exotic phytophysiognomy of the Cerrado vegetation area. The area of study is
located in Cerrado recovery vegetation and degraded pasture areas. On this area, five experimental plots were established from the specific characteristic of its vegetation cover, slope and soil type (treatments) and connected to a Gerlach trough that accumulates the runoff and were weekly measured. Two artificial fires were applied to plots in an interval of 8 months in attempt to understand the effects of fire on runoff, sediment yield and regrowth of vegetation. The results show that runoff do not present differences between
treatments through the period of study. Medium values of sediment yield for all plots vary from 6.70 g L-1 to 57.24 g L-1 showing that the plots which present high protection by vegetation create conditions to
diminish the impact of precipitation on the surface.
Keywords: Soil Erosion; Experimental Plots; Fire.
RESUMO / RÉSUMÉ
EFEITOS DO FOGO NO SOLO E VEGETAÇÃO NA SAVANA BRASILEIRA DEGRADADA
Esta pesquisa consiste em estudo comparativo sobre a aplicação controlada de fogo em diferentes condições de vegetação exótica e natural de Cerrado. A área de estudo está localizada em áreas de Cerrado sobre uso de pastagem degradada e áreas em recuperação. O delineamento da pesquisa contou com cinco parcelas
experimentais abrangendo características específicas de vegetação, declividade e tipo de solo, conectadas
à uma calha coletora do escoamento resultante na área, e mensurados semanalmente. Duas queimadas
artificiais foram aplicadas em um intervalo de 8 meses de modo a compreender o efeito do fogo sobre o escoamento superficial, perda de solo e rebrota da vegetação. Os resultados mostraram que não houve diferença de escoamento superficial entre os tratamentos durante o período de análise. Valores médios de
produção de sedimento para todas as parcelas variaram entre 6.70 g L-1 e 57.24 g L-1, mostrando que as
parcelas que obtiveram intensa cobertura vegetal criaram condições para reduzir o efeito da precipitação sobre a superfície.
Palabras claves: Erosão do Solo; Parcelas Experimentais; Fogo.
EFECTOS DEL FUEGO SOBRE EL SUELO Y LA VEGETACIÓN EN UNA SAVANA BRA-SILEÑA DEGRADADA
Esta investigación consiste en un estudio comparativo sobre la aplicación de quemada controlada en distintas condiciones natural y exótica de la vegetación del Cerrado. El área de estudio se encuentra con vegetación del Cerrado en recuperación y extensiones en pasturas degradadas. En esta área, se han establecido cinco parcelas experimentales que abarcan diferentes tipologías vegetal, declividad y tipo de suelo, conectadas a una canaleta regoredora de escurrimiento que se midió semanalmente. Se han aplicado en las parcelas
dos quemadas artificiales en una gama de 8 meses con lo objetivo de entender los efectos del fuego en el
escurrimiento, producción de sedimentos y reestablecimiento de la vegetación. Los resultados no
presen-taron diferencias en los escorrimientos superficiales entre los tratamientos durante el período de análisis.
Los valores medios de la producción de sedimentos fueram de 6,70 g L-1 57.24 g L-1 en todas las parcelas,
mostrando así que en las areas con mayor cobertura vegetal hay creado condiciones que minimizan el
impacto de la lluvia sobre la superficie.
www
.mercator
INTRODUCTION
The increase of soil erosion on Cerrado Biome is a real problem to the maintenance of surface equilibrium. Fire on Cerrado is a natural phenomenon, but the repetition of fire has been triggered by an anthropic action. Repeated fires intensify this problem with the removal of soil protection provide by vegetation, because is supposed that after the repetition of fires in a small time interval, the regrowth of vegetation is not sufficient to protect the soil to erosion process. A higher amount of studies of fire effects on soil erosion in the Cerrado Biome was carried out after natural fires and a few experimental research use controlled fire to comprehend this process. Trying to understand it, a set of plots was construct to study the ecosystem responses as changes in parameters linked to soil erosion after repeated fires.
Ryan (2002) describes fire as disturbance process, which is defined by its aspect of frequency, extent, seasonality, magnitude, and synergy that will affect the environment in different ways. The dynamic and severity of this process vary in time and space depending on the biophysical environ-ment and location of the fire perimeter.
Ecosystem responses to fire depends of some functional processes that are altered by fire and include recolonization, regeneration and watershed hydrology processes, such as soil erosion or natural revegetation; Fire intensity, fire severity and burn severity are operationally manageable measures used for prediction of their dynamics after fires (KEELEY, 2009).
Soil physical properties, which are important in the soil erosion process, are affected by fire. According to Bento-Gonçalves and Vieira (2013), color, ash content, water repellency, changes in the structure, texture and porosity are the main factor of soil affected by fire.
Brazilian Cerrado species are much more tolerant to fire than forest species. Researches on natural fire on Cerrado shows low rates of mortality in tree and shrub, with rapid resprout of herba-ceous layer after fire (ROBERTS, 2015; PIVELLO ET AL., 2010; DE ANDRADE; MIRANDA 2014). Environmental characteristics as mean annual precipitation, duration of dry season, soil fertility and disturbance are the key factors that determine the density of grasses, trees and shrubs in each Cerrado phytophysiognomy (HOFFMANN ET AL., 2003; HOFFMANN ET AL., 2012; RODRIGUES; BEZERRA, 2009). Multiple factors contribute to this difference in flammability, including microclimate, fuel amount and fuel type. Savannas are highly flammable and therefore typically subjected to frequent fire.
The previous revision of literature provides some dilemma about the real relationship be-tween soil erosion effects and action of fires, due to the presentation by authors about results with relationship of soil erosion with fire occurrence and other studies with indications that ecological
responses are not predictable from fire intensity and severity. We can add to this the almost inexis
-tence of studies about this theme on Cerrado Biome, and understand that further research is needed to comprehend how to translate burn severity or fire severity measures and research into useful predictions about soil erosion.
From this information, the present study aims to understand and quantify the effects of fire on
the increase or decrease of the erosive processes with reference to five characteristics of vegeta
-tion existing on degraded Cerrado area, based on the assump-tion that the burning and removal of vegetation that cover of topsoil favors the flow of soil sediment entrainment.
STUDY AREA
.ufc.br
(cretaceous). Some plots were built over degraded sites on exposures of subsoil material or BW soil. Table 1 presents the main information of the soil and other surface materials. The local climatic conditions are characterized by two well-defined seasons with rain concentration from November to March and a dry period from April to October both controlled by the Atlantic air mass or Conti-nental air mass. Natural vegetation was replaced by pasture and agricultural practices, some areas were abandoned, and a regrowth of natural species creates a mosaic of land uses.
Figure 1- Location of study site and plots A, B, C, D and E. Being PA = Plot A, PB = Plot B, PC = Plot C, PD = Plot D, PE = Plot E.
Table 1- Physic-chemical characteristics of the studied plots subjected to different treatments of land.
Plots Landscape Condition Vegetation Characteristics
Soil Physical Properties Soil Chemical Properties Moisture Content Sand Silt Clay pH1 CEC2 Wet3 Dry3
g Kg -1 Water mmolc dm-3 %
A Degraded Pasture Grass 896 3 101 5,1 20,3 8,04 2,78
B Degraded Pasture Grass and Shrub 891 13 96 5 28,5 9,59 3,81
C Flood Area Grass 817 39 144 5,4 21,4 16,89 10,42
D Degraded Area Native Grass 836 3 161 5,1 20,2 8,51 3,47 E Recovery Area Grass and Tree 535 77 388 5,1 32,4 6,74 2,77
¹Soil Reaction. ²Cation Exchange Capacities. ³Season (Wet – November to April; Dry – March to October).
MATERIALS AND METHODS
EXPERIMENTAL SETUP
www
.mercator
were also installed a Gerlach trough runoff sampler. In the plot base a gallon with 30 l of capacity collection of sediment and runoff were used. Each plot was delimited by galvanized sheets, with 10 cm deep into the ground and a height of 50 cm above the soil surface to avoid material from splash (Figure 2). Each treatment plot has differences on land cover, soil texture and chemical properties.
A superficial sample of soil was collected for a fertility index, particles density, bulk density and total porosity analysis. The main information about soil characteristics of each plot is presented in Table 2. The parameters analyzed were runoff, sediment yield, vegetation cover, soil moisture and precipitation. The data collection period was held from 12 March 2014 to 05 June 2015, and the application of controlled fire occurred on April 16 and November 11 of 2014. The two controlled fires in all the plots were considered of low severity because it is possible to observe the restoration and maintenance of a variety of ecological attributes that are generally viewed before the fires as stated by Neary et al. (2005).
Figure 2 - Plot structure.
Table 2 - Physico-chemical parameters for the study area.
Parameters Unit of measurament Methodology used Frequency of collection
Soil
Chemistry
pH pH on Water –EMBRAPA
Moisture % Apparent dielectric constant of moist soil
Macronutrients mmolc dm-3 EMBRAPA methods (1997) Once
CEC mmolc dm-3 ∑(K + Ca + Mg + (H+Al))
Physics Texture g kg-1 Pipette method
Runoff Liters Measurement at field plots
Erosion Soil Loss g/L Filtering and weight of samples Weekly Precipitation mm Pluviometric Station
Vegetation Surface Cover % Photo Comparasion
FIELD DATA COLLECTION AND LABORATORY ANALYSES
Field work was carried out once a week, with records of runoff, sediment yield collected at the Gerlach trough and at the gallons. Runoff was measured at field, and 1 l of homogenized water and sediment was collected for laboratory procedures of filtering and sediment weight. Superficial moisture determination at each plot was accomplished with the aid of a field moisture measurer. Determination of sediment weight eroded from the plots was obtained by filtering method. The weight of sediments retained in the filters were measured at a precision balance. Sediments collected at the Gerlach trough were also measured.
.ufc.br
measured using pipette method (EMBRAPA, 1997). Soil pH was measured on water. Chemical parameters of P (meh-1), K, Ca, Mg and Al were measured and fertility conditions were calculated.
Rainfall parameters were monitored by a station positioned at the same site of the experiments. The rainfall parameters recorded were rainfall intensity, total volume and total duration of each rainfall event. A set of vertical photography was performed each week after the data collection, which permits to identify and measure the land cover at each plot using the method adapted by Pinese Júnior et al. (2008).
RESULTS
For the definition of the severity of burns was used the qualitative description of Keleey (2009), that takes into account the observation in the field and the resulting characteristics of fire in the environment.
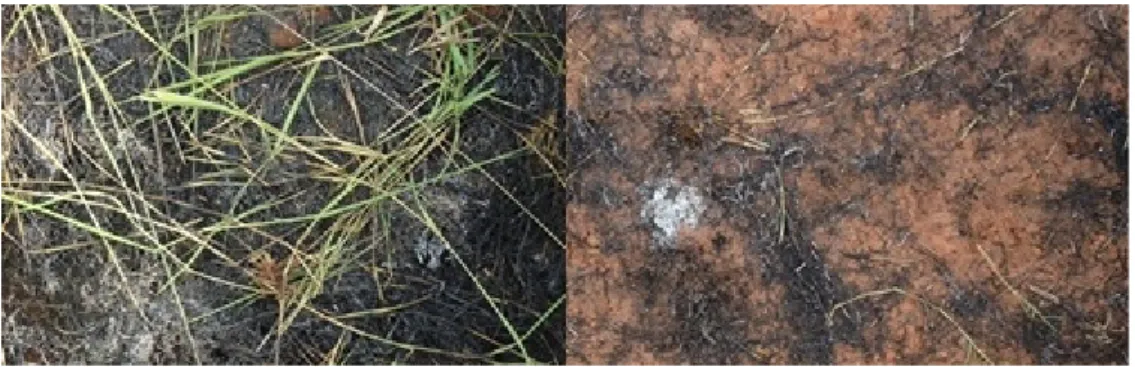
Thus, the plot A in the first burning has some green leaves unburned, however is possible to see part of the organic matter consumed, classified as low severity fire. In the second firing, all the herbaceous layer was consumed in plot A, presenting a large amount of ash in the topsoil. It was possible to find small instances of white ash on the ground, but the overall characteristics of fire were not considered for classification. Accordingly, the second burning on plot A was moderate or severe burn (Figure 3).
Figure 3 - Effects of first (left) and of second burns (right) on plot A.
The first fire in plot B had not fully affected shrub species, with intact leaves and scorched part of the stem, but the grass species were hit and carbonized, being classified the burning as low severity. The second fire in the plot B also reached the vegetation more intensely, carbonizing nearly all the leaves of the shrub species and totally the herbaceous layer. These characteristics qualify as a fire of severe burning on moderate surface (Figure 4).
www
.mercator
In plot C, the first burning carbonized most of vegetation cover, but still remained vegetation, which defines the fire as low severity. The second burn, in turn, eliminated all herbaceous, remai-ning on the soil an ash of the structure of dead grass. Thus, the second burremai-ning at plot C was also classified as moderate or severe over the surface. It is possible to realize the removal of a significant portion of the volume of ash comparing the two burning of vegetation. (Figure 5).
Figure 5 - Effects of first (left) and second burns (right) on plot C.
The first burning in the plot D was the same pattern as in plot A, reaching most of the herba
-ceous layer, but that there remains a considerable amount of green grasses, classifying the fire in this situation as a low severity. The second burning also occurred similarly seen in the plots already mentioned, however, small green leaves remained. This second fire was classified as moderate or severe burning over the soil surface. The small amount of ash present in the soil after firing was due to the slight quantity of biomass produced in the interval between fires during the dry period (S2) and also the effects of runoff and wind which removed previous ash from first fire. (Figure 6).
Figure 6 - Effects of first (left) and second burns (right) on plot D.
The fire in plot E also occurred with the same pattern of the four previous explanations. The first burning was classified as low severity by the vegetation permanence and the second as moderate or severe surface burning (Figure 7).
.ufc.br
Rainfall pattern in the Cerrado Biome shows two distinct seasons, one from April to October and another from November to March. In both seasons, the medium temperatures are almost the same. The huge difference occurs in the rain distribution, with almost 90% of the rainfall concen-trated in the summer, with peaks of precipitation in the period of December to March. Figure 8 demonstrates the pattern for the last 30 years and for 2014 total precipitation at Universidade Fe-deral de Uberlândia Meteorological Station. In the year of 2014 some changes in this pattern have occurred, mostly for precipitation, which was 30% less than the historical medium pattern. For the rain station situated in the study area the values of 14 months were recorded for this study, with the amount being 18% less in comparison with the normal pattern of the area. This data show that a dry year occurred when compared to the local pattern, on the time interval of our study.
Figure 8 - Pattern of precipitation in the last 30 years at Uberlândia Station at UFU and recorded value in 2014.
For this study three stages were used to exam the results. The first stage (S1) was the pre-fire treatment that involved from February 2014 to 16 April 2014 that was marked as the end of the rainy season, in which the total record of precipitation was 231.4 mm. The second stage (S2) com-prises the period after the first fire treatment and runs from 16 April 2014 to 11 November 2014, which was considered the dry season with 67.4 mm. The third stage (S3) started after the second fire treatment at 11 November with the new rain season, in which 871.1 mm of precipitation was recorded and comprises the entire 2014/15 rainy season. In the first stage 76 rainy events on 49 days were recorded with a peak of 63.11 mm and lowest value of 1.2 mm. In the S2 stage, 55 rainy events on 17 days were measured, with a peak of 50.10 mm, which represents 75% of the total rain in this stage, and the longest drought period of 6 weeks without precipitation. The S3 stage presented 275 rainy events distributed on 93 days and a high value of 176,5 mm and 0.3 mm to the lowest measure. In this stage some weeks presented no rain events. These data show a great difference between rain during the three stages, and points that the amount of rain is one of the key information to understand the evolution of land cover and the rates of regrowth of vegetation after fire, the runoff and the sediment yield behavior during the studied time.
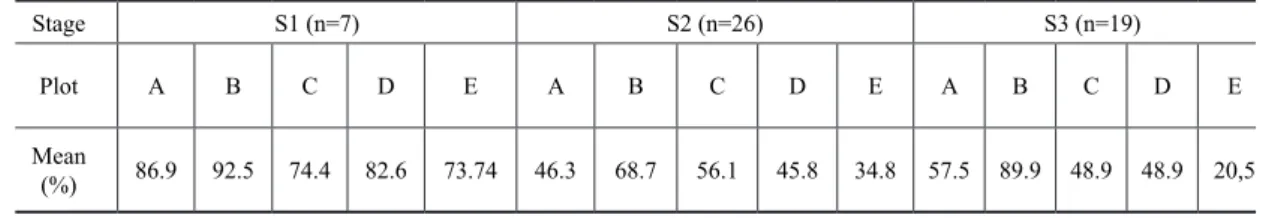
Results about the percentage of land cover and regrowth of vegetation after fire treatments show two groups of behavior (Figure 9). The first group is compound by plots A, C and D with grass cover of the surface. The second group comprises plots B and E in which shrub and tree are the main vegetation. Before the first fire treatment the same trend was observed, in which the plot B registered highest mean value with 92.53% of cover while plot E shows the lowest value with 73.74% of surface cover. After the first fire treatment, no changes on the trend were observed because again the highest mean value was obtained in plot B with 68.71% and the lowest value was found on plot E with 34.82% of surface cover (Table 3). This values are compatible with the assumptions
of Pivello et al. (2010) which indicate that fires on the beginning of the dry season and after indi
www
.mercator
.ufc.br
fire and drought on the land cover percentage and regrowth of vegetation because they are inferior when we compared with the S1 and S3 in rainy seasons. In this way the trend was maintained after the second fire treatment when the highest and lowest values were obtained at the same plots as previously done, with highest value at plot B with 89.96% and the lower at plot E, with 20.54% of surface cover. Similar results were found by González-Pelayo et al. (2010) in studies carried out in a Mediterranean-shrub ecosystem.
Table 3 - Mean values of surface cover of three stages on the five plots treatments. N means the number of weeks.
Stage S1 (n=7) S2 (n=26) S3 (n=19)
Plot A B C D E A B C D E A B C D E
Mean
(%) 86.9 92.5 74.4 82.6 73.74 46.3 68.7 56.1 45.8 34.8 57.5 89.9 48.9 48.9 20,5
The highest mean values of runoff were measured at plot E in the third stage with 10.63 l and a peak of 14.45 l immediately after the second fire, while the lowest mean value was obtained at plot D, with 0.55 l. Plot E showed the highest value of runoff before the first fire treatment, with
2.03 l, while plot D showed the lowest values with 0.55 l. After the two fire treatments the respon
-ses were the same, where plot E continued with the highest values (Stage 2 = 4.90 l and Stage 3 = 10.63 l) and B with the lowest (Stage 2 = 0.96 l and Stage 3 = 3.06 l). Plot E presents an isolated tree with poor herbaceous strata, showing an almost sealed surface after the occurrence of the two fire treatments and the intense rains. Boix-Fayos et al. (2006) indicated that sealing of the surface together with stoniness and outcrop rock functioned as controlling mechanisms of soil erosion with high importance on runoff production. This situation was also noted by Campo et al. (2006) that observed increases of runoff and sediment transport by surface sealing. In addition, the coarse texture of surface material and the presence of gravels affects the runoff generation. This condition could explain the wash of the plot surface and contribute with the high index of runoff and the decrease of values of sediment yield.
Table 4 - Mean values of runoff of the three stages on the five plots treatments. n means the number of weeks.
Stage S1 (n=8) S2 (n=8) S3 (n=20)
Plot A B C D E A B C D E A B C D E
Mean
(%) 1.4 1.6 1.3 0.5 2.0 1.3 1.4 1.7 0.9 4.9 6.0 5.5 4.8 3.0 10.6
www
.mercator
.ufc.br
The result about sediment yield shows no noticeable differences occurring between plots A to E. When analyzed all periods of measurement, with 59 records, the highest value is on plot D with a mean value of 60.26 g/l, as the lowest is on plot B with a mean value of 5.08 g/l. For the measu-ring done before the first fire treatment, values ranging from 15.98 g/l on plot D while 5.08 g/l was found on plot E (Table 5). After the first fire all plots presented increases in mean values, with 19.58 g/l for plot D and 6.70 g/l for plot C, which indicates an increase on transport of sediment in dry conditions and low protection of the surface after rain showers. After the second fire an increment of the mean value occurs, as showed the highest value with 60.26 g/l in plot D and lowest value at plot C with 11.42 g/l. These results show that plot C located in seasonally flooded area show the lowest values of sediment yield and the highest values are achieved at plot D, where native grass is the main vegetation type and apparently is more affected by fire.
Table 5 shows the distribution of the sediment yield during the entire period of study. Visible differences between plots can be observed such as the constant lower values recorded at plot B (Shrub) while higher values found on plot D (native grass).This high protection to soil surface was observed in the study of Howes and Abrahams 2003 that indicate a great infiltration on low intensity rainfalls in a shrubland ecosystem. Also the maintenance of the shrub structure, which dies after the fire treatments but has a quickly resprouting and creates a group of new leafs as observed by (Fidelis et al. 2010) in field experiments with natural fires in grassland landscape with high shrub population in the south Brazil.
Table 5 - Mean values of sediment yield of 3 stages on the five plots treatments. n means the number of weeks.
Stage S1 (n=7) S2 (n=13) S3 (n=23)
Plot A B C D E A B C D E A B C D E
Mean (%) 10.5 8.4 10.4 15.9 5.0 9.9 7.9 6.7 19.5 13.2 57.2 8.8 11.4 60.2 49.7
SOIL CHEMICAL PROPERTIES
The effects of two simulations of fire on the chemical properties of the soil were made with comparison of parameter based on their initial conditions, i.e. before Stage 1 (S1) and then after the second firing (S2) (Table 6). It was possible observe no changes in the evaluated parameters. Small variations were observed in the pH values and m (saturation aluminum). The pH values have as standard an increase in all the plots, while values of m spite of its high percentage changes, did not show a consistent pattern. These parameters could be affected by the occurrence of heavy rain which washing the surface without a real possibility of incorporate the elements in the ash that covered surfaces, as well as due to the low amount of organic matter in the second fire.
Table 6 - Changes of values of soil chemical properties. AF* means after second fire.
Plot
Ph P meh-¹ K Ca Mg Al CEC V m
(water) mg dm-³ mmolc dm-³ %
A 5.1 0.9 15 3 0 6 25.4 21.20 44.90
A -AF* 5.3 2.7 11 4 0 4 20.3 13.40 61.80
B 5 0.9 19 3 0 4 23.5 12.30 58.80
B – AF* 5 1.1 18 3 0 5 28.5 14.90 53.30
C 5.1 1.1 15 5 1 4 21.4 20.60 57.70
C – AF* 5.4 1.1 16 3 1 6 21.4 29.90 38.50
D 4.9 1 11 3 1 6 26.3 20.80 45.50
D – AF* 5.1 0.8 9 3 1 4 20.2 16.30 56.10
E 5 0.9 12 3 1 7 30.3 13.60 47.60
www
.mercator
FINAL CONSIDERATIONS
Starting in a natural condition of surface protection five plots with 1m2 were built in a degraded landscape in the Cerrado Biome, each one with different land cover. Two fires, one in the beginning of the dry season and another in the transition to the rainy season were used to understand the va-riations caused by this treatment. One consideration should be done about the precipitation values, which reach lower values in the research period in comparison to the local annual medium values.
The severity of the two fires applied in this study was similar. In the first simulation, all plots showed low severity, low consumption of organic matter, a fact that was attributed to the vegetative state of the plants, the high moisture content in the atmosphere and the soil humidity at the burn time, which was held at the end of the rainy season. The second burn was carried out at the end of the dry season, before the start of more concentrated rainfall. At this time the vegetation was poorly developed, with low soil and relative humidity.
The results about the pattern of land surface protection shows that shrub vegetation presents the highest protection to the surface during the entire study, and a plot with isolated tree and sparse grass cover shows the lowest values for surface cover. Plots with grass cover presents lower values than for shrub and higher than for isolated tree.
The evaluation on the runoff generation shows that seasonal conditions haves a high influence on the responses of this parameter. Runoff presents an increase of values, with lower values in the first stage before the treatments and with higher values just after the second fire treatment, which means that the vegetation resprout does not reaches the same protection to the surface after repeated fires in a small interval of time.
Sediment yield does not show noticeable differences between plots and treatments during the study. The general trend was that of increase of values during the experimental stages, with higher values after the second treatment in the rainy season.
Despite these results, it is not possible to establish a direct relationship between the occurrence of the simulated fires and the variation of the runoff, because it is already naturally seasonally. Also changes on soil chemical parameters do not show visible changes or patterns of behavior on the results. Therefore, some further experiments must be done to try to evaluate the possibility of the occurrence of fire compared with the ecological responses like the case of the runoff and sediment yield, in view of the complexity of the phenomenon.
ACKNOWLEDGE
The authors thank Fundação de Amparo a Pesquisa do Estado de Minas Gerais, project APQ-00231-16 and Conselho Nacional de Desenvolvimento Cientifico e Tecnológico for providing access to resources and financial support to accomplish the research (Project 302654/2015-1)..
BIBLIOGRAPHIC REFERENCE
DE ANDRADE, L.A.Z.; MIRANDA, H.S. The dynamics of the soil seed bank after a fire event in a woody
savanna in central Brazil. Plant Ecology, 215(10), pp.1199–1209, 2014. Available at: http://link.springer.
com/10.1007/s11258-014-0378-z.
BENTO-GONÇALVES, A.; VIEIRA, A. Grandes incêndios florestais, erosão, degradação e medidas
de recuperação dos solos, Braga: Núcleo de Investigação em Geografia e Planejamento (NIGP), 2013.
BOIX-FAYOS, C. et al. Measuring soil erosion by field plots: Understanding the sources of variation.
.ufc.br
CAMPO, J. et al. Occurrence of soil erosion after repeated experimental fires in a Mediterranean environ
-ment. Geomorphology, 82(3–4), pp.376–387, 2006.
EMBRAPA. MANUAL DE MÉTODOS DE ANÁLISE DE SOLO. CENTRO NACIONAL DE
PESQUISA DE SOLO. 2.ED. RIO DE JANEIRO: EMBRAPA-CNPS, 1997.
FIDELIS, A. et al. Population biology and regeneration of forbs and shrubs after fire in Brazilian Campos
grasslands. Plant Ecology, 211(1), pp.107–117, 2010.
GONZÁLEZ-PELAYO, O. et al. Rainfall influence on plot-scale runoff and soil loss from repeated bur
-ning in a Mediterranean-shrub ecosystem, Valencia, Spain. Geomorphology, 118(3–4), pp.444–452, 2010.
Available at: http://dx.doi.org/10.1016/j.geomorph.2010.02.014.
HOFFMANN, W. a. et al. Fuels or microclimate? Understanding the drivers of fire feedbacks at savanna
--forest boundaries. Austral Ecology, 37(6), pp.634–643, 2012.
HOFFMANN, W. A.; ORTHEN, B.; DO NASCIMENTO, P. K.V. Comparative fire ecology of tropical
savanna and forest trees. Functional Ecology, 17(6), pp.720–726, 2003. Available at: isi:000187184900002.
HOWES, D. A; ABRAHAMS, A.D. Modeling runoff and runon in a desert shrubland ecosystem, Jornada
Basin, New Mexico. Geomorphology, 53(1–2), pp.45–73, 2003.
KEELEY, J.E. Fire intensity, fire severity and burn severity: A brief review and suggested usage.
Interna-tional Journal of Wildland Fire, 18(1), pp.116–126, 2009.
NEARY, D.G.; RYAN, K.C.; DE BANO, L.F. Wildland Fire in Ecosystems: effects of fire on soils and
water. Fort Collins, CO: Gen. Tech. Rep., Rocky Mountain Research Sation General Technical Report. Vol. 4. Ogden, UT: U.S. Department of Agriculture, Forest Service, Rocky Mountain Research Station, 2005.
PINESE JÚNIOR, J.; CRUZ, L.; RODRIGUES, S. Monitoramento de erosão laminar em diferentes usos da terra, Uberlândia–MG. Revista Sociedade & Natureza, 20(2), pp.157–175, 2008. Available at: http:// www.seer.ufu.br/index.php/sociedadenatureza/article/viewFile/9532/5772 [Accessed August 18, 2014].
PIVELLO, V.R. et al. Effect of fires on soil nutrient availability in an open savanna in Central Brazil. Plant and Soil, 337(1), pp.111–123, 2010.
ROBERTS, S.J. Tropical fire ecology. 2(2001), pp.286–291, 2015.
RODRIGUES, S.C.; BEZERRA, J.F.R. Study of matric potential and geotextiles applied to degraded soil recovery, Uberlândia (MG), Brazil. Environmental Earth Sciences, 60(6), pp.1281–1289, 2009. Available
at: http://link.springer.com/10.1007/s12665-009-0268-1 [Accessed August 20, 2014].
RYAN, K.C. Dynamic interactions between forest structure and fire behavior in boreal ecosystems. Silva