Boletim Mensal de Economia Portuguesa
N.º 5| Maio 2010
G PE AR I
Ga bin e t e de Est r a t é gia e Est u dos
M in ist é r io da Econ om ia , da I n ova çã o e do D e se n volv im e n t o
Ga bin e t e de Pla n e a m e n t o, Est r a t é gia , Ava lia çã o_ e Re la çõe s I n t e r n a cion a is
Ficha Técnica
Título:Boletim Mensal de Economia Portuguesa
Data:Maio de 2010
Elaborado com informação disponível até ao dia 21 de Maio.
Editores
Gabinete de Estratégia e Estudos
Ministério da Economia, da Inovação e do Desenvolvimento Avenida da República, 79
1050-243 Lisboa
Telefone: +351 21 7998158 Fax: +351 21 7998154
URL: http://www.gee.min-economia.pt
E-Mail: gee@gee.min-economia.pt
Gabinete de Planeamento, Estratégia, Avaliação e Relações Internacionais
Ministério das Finanças e da Administração Pública Avª Infante D. Henrique nº. 1 – 1º.
1100 – 278 Lisboa Telefone: +351 21 8823396 Fax: +351 21 8823399
URL: http://www.gpeari.min-financas.pt
E-Mail: bmep@gpeari.min-financas.pt
An a lysis of t h e Act ive Em ploye r En t e r pr ise Popu la t ion in
Por t u ga l
28Elsa de Morais Sarmento29 Alcina Nunes 30
This study provides a description of the population of active employer enterprises dynamics in Portugal, using an entrepreneurship dataset conceived from Quadros de Pessoal based on the Eurostat/OECD methodology “Manual on Business Demography Statistics”, for the period 1987 to 2007. The main contribution of this analysis is to provide detailed disaggregated evidence of the employer enterprise population by firm dimension, region and main economic sectors, over a period of more than 20 years.
1 . I n t r oduct ion
1 .1 . Eu r ost a t / OECD ’s M e t h odology
As entrepreneurship is a multifaceted and interdisciplinary concept, various definitions do co-exist and no single one has been generally agreed upon31. To achieve the goal proposed by the Entrepreneurship Indicators Programme (EIP), it was necessary to define a unique entrepreneurship concept that could capture all its essence and which could be applied empirically in a variety of international settings. Building on various theoretical contributions, the OECD (Ahmad and Seymour, 2008; Ahmad and Hoffman, 2008; Ahmad, 2006) adopted a single definition, which gathers three main components: (i) Entrepreneurs, those who seek to generate value, through the creation or expansion of economic activity by identifying and exploiting new products, processes or markets; (ii) Entrepreneurial Activity, which is the enterprising human action in pursuit of the generation of value through the creation or expansion of economic activity, and; (iii) Entrepreneurship, defined as the phenomenon associated with entrepreneurial activity.
The standard unit of measurement considered for entrepreneurial activities has the form of a “business”. Our work follows this methodology and focuses on the analysis of entrepreneurial performance indicators of employer enterprises, applied to the Quadros de Pessoal dataset (Employment Administrative Records) of the Portuguese Ministry of Labour and Social Security, which is the main data source in Portugal, for the universe of employer enterprises. This is composed of all active enterprises with at least one paid employee during the period 1985 to 2007, which constitutes the so-called employer enterprise population.
2 . Pe r for m a n ce I n dica t or s for Act ive Em ploye r En t e r pr ise s
2 .1 . Act ive Em ploye r En t e r pr ise s
The population of employer enterprises in Portugal has been growing steadily from 198532 to 2007 (Figure 1). The number of active employer enterprises went over the 300.000 threshold after 2003.
Based on the cycles of enterprise growth and birth, we can observe four main distinct periods, before 1989, 1990 to 1994, 1995 to 1999 and the period following the year 2000. In 2006, the rate of growth of employer enterprises has shown a sharp decrease, to 1,0% after a peak of 8,9% in 2005, the highest since 2001.
28 This work reflects the opinions of the authors and not of the Ministry of Economics, Innovation and Development.
Other usual disclaimers apply. The authors would like to thank Gabinete de Estratégia e Planeamento of the Portuguese Ministry of Labour and Social Security for the provision of the data.
29 Departamento de Economia e Gestão, Universidade de Aveiro, Portugal. Ministério da Economia, da Inovação e do
Desenvolvimento.
30
Escola Superior de Tecnologia e Gestão do Instituto Politécnico de Bragança.
31 Ahmad and Seymour (2008) provide a superficial review of extant definitions in Table 1. Consider also the concepts
included in Audretsch´s review of entrepreneurship literature (2003).
32
Figure 1. Population of active employer enterprises, 1987–2007 110,8122,8 148,6159,2 184,3 213,6 228,8 244,2 268,7 284,0 299,8 340,8 306,6 354,9 344,0 312,9 192,2 197,5 165,9 140,3 137,1 102,0106,7 4,6 5,9 7,1 11,1 8,1 7,1 6,7 10,0 5,7 5,6 2,3 2,1 8,9 3,2 4,3 2,8 4,2 2,3 3,8 1,0 10,7 11,7 0 50 100 150 200 250 300 350 400
1985 1986 1987 1988 1989 1990 1991 1992 1993 1994 1995 1996 1997 1998 1999 2000 2001 2002 2003 2004 2005 2006 2007
N u mber of empl oyer enterpri ses 0 5 10 15 20 25 30 35 40 %
Active Employer Enterprises (thousands) Active Employer Enterprises, annual growth rate (%)
Source: Own calculations based on Quadros de Pessoal, GEP, Ministério do Trabalho e da Solidariedade Social. Note: Employer Enteprises are enterprises which have at least one paid worker.
3 . Pe r for m a n ce I n dica t or s for Act ive Em ploye r En t e r pr ise s by Size Cla ss
Entrepreneurship is a multidimensional phenomenon, spanning different units of observation, ranging from the individual to the firm, the nation to the region and the total economy versus micro-economic sectors. We hereby start by characterising three of these dimensions, by region, economic sector and enterprise size class.
3 .1 . Pe r for m a n ce I n dica t or s for Act ive Em ploye r En t e r pr ise s by Size Cla ss
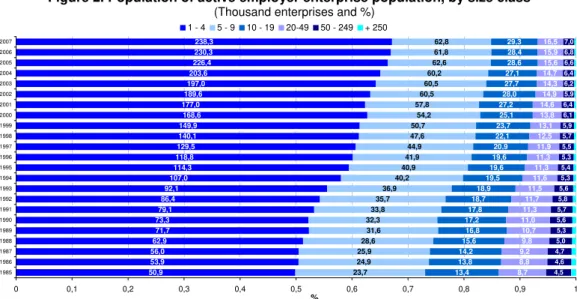
The vast majority of enterprises in OECD countries (OECD, 2000) and in the European Union (Storey, 1994; Eurostat, 2009) are small and medium enterprises (SMEs). SMEs are considered a key source of dynamism and innovation both in developed and emerging economies, thus making important contributions to job creation, economic growth and productivity (OECD, 2005). A look at the number of active enterprises by size class over time, highlights the increasing importance of small and medium (SME) sized enterprises in Portugal (Figure 2).
Figure 2. Population of active employer enterprise population, by size class
(Thousand enterprises and %)
50,9 53,9 56,0 62,9 71,7 73,3 79,1 86,4 92,1 107,0 114,3 118,8 129,5 140,1 149,9 168,6 177,0 189,6 197,0 203,6 226,4 230,3 238,3 23,7 24,9 25,9 28,6 31,6 32,3 33,8 35,7 36,9 40,2 40,9 41,9 44,9 47,6 50,7 54,2 57,8 60,5 60,5 60,2 62,6 61,8 62,8 13,4 13,8 14,2 15,6 16,8 17,2 17,8 18,7 18,9 19,5 19,6 19,6 20,9 22,1 23,7 25,1 27,2 28,0 27,7 27,1 28,6 28,4 29,3 8,7 8,8 9,2 9,8 10,7 11,0 11,3 11,7 11,5 11,6 11,3 11,3 11,9 12,5 13,1 13,8 14,6 14,9 14,3 14,7 15,6 15,9 16,5 4,5 4,6 4,7 5,0 5,3 5,6 5,7 5,8 5,6 5,3 5,4 5,3 5,5 5,7 5,9 6,1 6,4 5,9 6,2 6,4 6,6 6,8 7,0
0 0,1 0,2 0,3 0,4 0,5 0,6 0,7 0,8 0,9 1
1985 1986 1987 1988 1989 1990 1991 1992 1993 1994 1995 1996 1997 1998 1999 2000 2001 2002 2003 2004 2005 2006 2007 %
1 - 4 5 - 9 10 - 19 20-49 50 - 249 + 250
In most countries, the population of firms is dominated by small and micro units (Bartelsman et al., 2005; Bartelsman et al., 2004; Eurostat, 2009) where firms with less than ten employees represent around three quarters of the employer enterprise total population. Portugal does not seem to be an outlier. Since 1996, more than 60% of all employer enterprise firms in Portugal are micro firms33, and more than 81% have fewer than 10 employees (Figure 3). There has been a clear tendency for small firms, with less than 10 employees, to increase its share in total population, throughout all the observed period (74% in 1986, 82% in 1997 and 85% in 2007). In 2007, 97,8% of the Portuguese enterprises employed less than 50 workers, compared to 95% in 1985.
Figure 3. Active employer enterprises, with less than 5 and less than 10 employees and share on total enterprise population (%)
74.557 78.71281.914
91.500103.376 105.559 112.875122.109
129.062
147.111155.156 160.700 174.390
187.741200.666 222.805234.857
250.142257.470 263.868
288.952 292.094301.150
73,1 73,7 73,9 74,5 75,4 75,2 76,0 76,7 77,8
79,8 80,7 81,3 81,7 82,0 82,2
82,9 82,7 83,4 84,0 84,3 84,8 84,9 84,9
49,9 50,5 50,5 51,3 52,3 52,2 53,2 54,3 55,5
58,0 59,4 60,1 60,6
61,2 61,4 62,7 62,3 63,3 64,3 65,1
66,4 66,9 67,1
0 50.000 100.000 150.000 200.000 250.000 300.000 350.000 400.000 450.000
1985 1986 1987 1988 1989 1990 1991 1992 1993 1994 1995 1996 1997 1998 1999 2000 2001 2002 2003 2004 2005 2006 2007
N
u
mber
of enterpr
is
e
s
0 10 20 30 40 50 60 70 80 90
%
Employer enterprises with fewer than 10 employees Employer Enterprises with fewer than 5 employees
Share in total population of employer enterprises with less than 10 employees Share in total population of employer enterprises with less than 4 employees
Source: Own calculations based on Quadros de Pessoal GEP, MTSS
3 .2 . Pe r for m a n ce in dica t or s for a ct ive e m ploye r e n t e r pr ise s by r e gion
In what concerns regional enterprise growth, the region of the Algarve shows the highest growth in active enterprises throughout the period (Table 1), reaching a peak of 20.711 active enterprises in 2007 (more 1.131 than in 2006). Although not being the region with the highest volatility, it shows considerable fluctuations in active employer enterprise growth over time (e.g. from 27.7% of growth in 1989 to a low of 2.6% in 1990).
Table 1. Annual average growth rate of active employer enterprises by NUT II
NUT II 1985 to 2007 1995 to 2000 2000 to 2007
Norte 6,2 7,1 4,4
Algarve 9,0 7,9 6,7
Centro 6,6 8,6 4,0
Lisboa 4,5 5,1 3,4
Alentejo 5,8 8,3 3,1
Açores 3,7 3,9 3,1
Madeira 6,4 7,1 4,4
Portugal 5,8 6,9 4,1
Source: Own calculations based on Quadros de Pessoal, GEP, MTSS.
Norte and Madeira display the second greatest annual average growth in the total number of active employer enterprises from 2000 to 2007 (4,4%). However, Norte is characterised by the greatest regional volatility34, particularly from 1993 to 1998. Despite having the greatest share of active enterprises (Figure 4) and the greatest amount of small enterprises in the country, the weight of small and medium firms is the
33
Micro firms are enterprises with fewer than 5 employees.
34
highest in Algarve (mainly due to services and construction sectors, especially from 2000 onwards) and Alentejo (mainly in services and agriculture and fishing sectors) (Table 2 and 4).
Figure 4. Share of active employer enterprises by NUT II, 2000 and 2007
Algarve 6% Centro
22%
35% 8%
5%
22% 26%
2% 2% Açores
2% Madeira
2%
Alentejo 7%
Lisboa e Vale do Tejo
25%
Norte 36%
Norte Algarve Centro Lisboa e Vale do Tejo Alentejo Açores Madeira
2000 2007
Source: Own calculations based on Quadros de Pessoal , GEP, MTSS.
Centro has maintained a steady rhythm of enterprise growth, consequently its share in total number of enterprises in the country has been kept stable over time. Lisboa e Vale do Tejo has seen its share of enterprises slightly reduced in the total economy (-1 p.p.), from 2000 to 2007 (Figure 4). In the Açores and Madeira there is also an increasing number of active enterprises, although the Açores have lost their prominence in the total number of enterprises in the two archipelagos (60% of total archipelago’s enterprises were located in Açores in 1985 and only 45,7% in 2007). The enterprise growth rate has been greater in Madeira than in Açores, throughout the period, except for the years 1996, 2001 and 2006. This evidence points to an overall tendency to a decreasing rhythm of growth of the population of active employer enterprises in all NUT II regions, from 2001 onwards (Table 1).
The regional density of firms offers a contrast between the dynamics of firm and population growth. Density is thus calculated by the ratio of active enterprises over the region’s active population, the former data is based on Statistics Portugal.
We observe that Alentejo has the highest enterprise density, followed by the Algarve (Figure 5). In the case of Alentejo, this startling fact is due to this region having the lowest active population growth at the NUTII level35, below the country’s average rate36. Its enterprise growth (despite being also below the country’s average) manages to grow at a faster rate than its active population, thus accounting for the higher density portrayed in Figure 5.
Algarve, on the other hand, has had the highest active population growth in most of the years considered, and also some of the highest regional enterprise growth. Density in the Algarve has been steadily growing since 1998, as the enterprise growth rate is higher than active population’s.
In Lisbon, active population grows above the economy’s average but enterprise growth is below the country´s average for most years, which accounts for this region’s record of the lowest average enterprise density. The two Archipelagos show an enterprise density below the country’s average throughout the period. Madeira has managed to outpace Acores’s enterprise density from 2003.
35
Alentejo has had a negative active population growth rate since 2005 (Statistics Portugal).
36
Figure 5. Density of active employer enterprises, by NUT II region
44
62
52
37
76
45
39
45 51
77
63
42
91
50 50 53
56
85
69
44
90
51,5 55,5
57 64
95
75
48
103
53,8 57,3
63
0 20 40 60 80 100 120
Norte Algarve Centro Lisboa Alentejo Açores Madeira Portugal
en
ter
p
ri
se
s b
y
ac
tiv
e
p
o
p
u
la
tio
n
1998 1999 2000 2001 2002 2003 2004 2005 2006 2007
Source: Own calculations based on Quadros de Pessoal, GEP, MTSS and Statistics Portugal for average population. Note: Density is the ratio of the number of enterprises over active population
By combining the regional with the size class dimension, we may also observe the predominance of small firms in most regions at the NUT II level (Table 2) in particular in the Algarve (in 2007, 67,7% of enterprises had fewer than 20 employees, which corresponds to 58,4% of the region’s employment), the Açores (69,2% share of firms and 42% of employment), and the Alentejo (66,7% share of firms and 54,9% of employment). Even when firms with fewer with less than 50 employees are considered, the Algarve and the Alentejo are still the regions with the highest share of small enterprises in 2007.
Table 2. Share of active employer enterprises with fewer than 20 employees in total number of enterprises by NUT II region (%)
Regions 1995 1996 1997 1998 1999 2000 2001 2002 2003 2004 2005 2006 2007
Norte 46,9 47,4 47,4 48,3 49,4 49,4 49,9 51,3 52,8 55,1 56,4 57,1 57,6
Algarve 52,8 53,4 53,9 54,7 58,2 58,4 60,6 62,0 63,8 65,7 67,0 67,0 67,7
Centro 49,3 50,4 50,5 51,2 52,4 52,2 53,7 54,9 56,2 59,1 60,6 61,4 61,8
Lisboa 51,0 51,2 51,3 51,6 52,3 52,1 53,1 53,8 54,8 57,7 59,1 59,9 60,2
Alentejo 52,9 54,8 54,7 57,1 58,6 58,5 59,7 60,2 61,9 63,6 65,3 65,1 66,7
Açores 66,6 66,2 66,4 66,4 65,2 64,5 64,9 64,8 63,8 65,1 67,6 68,4 68,2
Madeira 47,4 48,4 47,8 49,4 50,3 52,2 53,9 55,3 55,1 57,6 57,6 57,8 57,7
Portugal 49,9 50,5 50,5 51,3 52,3 52,2 53,2 54,3 55,5 58,0 59,4 60,1 60,6
Enterprise share of size Class of fewer than 20 employees
Source: Own calculations based on Quadros de Pessoal, GEP, MTSS.
Table 3. Share of employment in active employer enterprises with fewer than 20 employees in total regional employment by NUT II region (%)
Regions 1995 1996 1997 1998 1999 2000 2001 2002 2003 2004 2005 2006 2007
Norte 34,7 35,2 36,2 37,5 38,6 40,4 41,0 43,2 43,3 43,0 43,5 42,8 42,4
Algarve 58,2 59,4 60,3 59,9 59,7 60,0 59,6 62,2 61,1 60,8 60,5 59,5 58,4
Centro 41,4 42,4 43,3 44,1 45,4 46,6 47,3 50,5 50,7 49,5 49,8 49,4 49,1
Lisboa 27,9 28,7 28,9 28,6 28,8 29,2 29,1 30,9 30,5 29,6 28,9 28,6 28,4
Alentejo 55,5 54,7 54,5 55,2 55,4 57,0 56,4 58,2 57,5 54,6 55,5 54,2 54,9
Açores 47,8 46,8 47,4 44,7 45,3 44,2 43,4 43,5 44,5 42,9 43,3 44,3 42,0
Madeira 39,2 37,7 38,4 39,5 41,0 42,9 42,5 42,0 42,1 42,0 42,5 43,2 43,2
Portugal 35,1 35,9 36,6 37,1 37,9 39,0 39,3 41,6 41,5 40,7 40,8 40,2 39,9
Employment share of size class 1 to 19 employees
Source: Own calculations based on Quadros de Pessoal, GEP, MTSS.
3 .3 . Pe r for m a n ce I n dica t or s for Act ive Em ploye r En t e r pr ise s by Se ct or
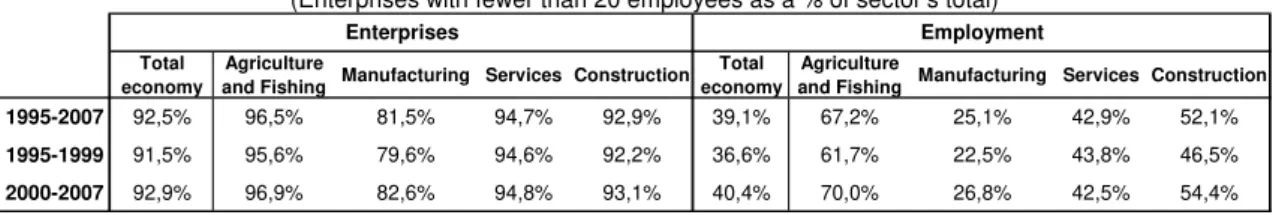
Table 4. Share of enterprises with fewer than 20 employees, in the total population of firms and in
total employment37
(Enterprises with fewer than 20 employees as a % of sector’s total)
Total economy
Agriculture
and Fishing Manufacturing Services Construction Total economy
Agriculture
and Fishing Manufacturing Services Construction
1995-2007 92,5% 96,5% 81,5% 94,7% 92,9% 39,1% 67,2% 25,1% 42,9% 52,1%
1995-1999 91,5% 95,6% 79,6% 94,6% 92,2% 36,6% 61,7% 22,5% 43,8% 46,5%
2000-2007 92,9% 96,9% 82,6% 94,8% 93,1% 40,4% 70,0% 26,8% 42,5% 54,4%
Enterprises Employment
Source: Own calculations based on Quadros de Pessoal, GEP, MTSS.
From the first (1995-1999) to second sub-period (2000-2007), the number of small enterprises rises in all sectors. Manufacturing displays the highest increase in this size class, above the total economy’s, indicating a faster reduction in enterprise size (Table 6).
In line with the literature, the employment share of small firms is lower than its share in the total number of firms (Table 4). In parallel to enterprise behaviour, the share of employment in enterprises with fewer than 20 employees also rises in all sectors of activity, except in services.
From 1995 to 2007, small firms with fewer than 20 workers employed 39,1% of the total workforce in the dataset (Table 4). It is in the “Agriculture and Fishing” and in the “Construction” sector that small firms account for the largest share of employment.
This is not only influenced by the level of economic activity38, but also by the dynamics of entry and exit in the market and by the industry structure, where an economy with a growing service sector and a declining influence of the manufacturing sector, such as Portugal, is more likely to display a growing share of both SMEs and of SME´s in total employment.
The growing importance of the service39 sector and the decline of the manufacturing sector are clearly observable from Figure 8. The service sector leads in the number and share of active employer enterprises, especially after 2001 and particularly in terms of its share of employment40 (60,3% in 2006), but holds the lowest average firm size of the three main sectors (8,4 average employees per firm during 1995 to 2007, Table 6). It displays a tendency to reinforce its importance in the Portuguese economy, as indicated by the figure below.
Figure 6. Share of enterprises and employees in total economy in the service and manufacturing sector, 1995-2006 2006 2005 2004 2003 2002 2001 2000 1999 1998 1997 1996 1995 47 49 51 53 55 57 59 61
64 65 65 66 66 67 67 68
Share of enterprises, %
S h ar e of e m pl oy ee s, % Services 1995 1996 1997 1998 1999 2000 2001 2002 2003 2004 2005 2006 24 26 28 30 32 34 36 38 40
13 14 15 16 17 18 19 20 21
Share of enterprises, %
Share of em pl oye e s , % Manufacturing
Source: Own calculations based on Quadros de Pessoal , GEP, MTSS.
37 Sections A to P of ISIC Revision 3 were considered for the total economy. Data is only considered after 1995 due to
the start of European System of Accounts of 1995, and up to 2006 due to the problems of compatibility with Classification of Economic Activities Revision 3, introduced in 2007.
38 The economic cycle highly correlates with enterprise births and deaths cycles. In different regression models we have
found that GDP is consistently a statistically significant variable.
39
In most OECD countries, the service sector accounts for more than 60% of value added and employment (Ahn, 2001).
40
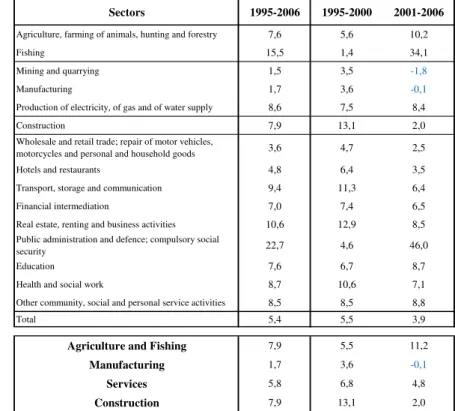
Turning to annual average growth rates, at a more disaggregated level, we observe clear disparities among the Portuguese main sectors (Table 5). All broad sectors, except Agriculture and Fishing, show a decrease in their annual average growth rates from the first to the second sub-period (2001-2006).
The service sector shows more dynamism in most sectors at one letter level of the CEA41, when compared to manufacturing.
During the first sub period42 (1995-2000), one of the most dynamic sectors has been “Construction”, which displays after 2001, a slowdown in enterprise annual average growth (2,0%). On the other hand, the broad manufacturing sector displays decreasing annual average growth rates from 1995 to 2006 (1,7%), mainly in the sub-sectors “Mining and quarrying” and “Manufacturing”, a tendency enhanced after 2001 (1,8% and -0,1%, respectively).
Table 5. Annual average growth of active employer enterprises by sector at one letter level of the Classification of Economic Activities, Rev. 2.1 and by broad sectors (%)
Sectors 1995-2006 1995-2000 2001-2006
Agriculture, farming of animals, hunting and forestry 7,6 5,6 10,2
Fishing 15,5 1,4 34,1
Mining and quarrying 1,5 3,5 -1,8
Manufacturing 1,7 3,6 -0,1
Production of electricity, of gas and of water supply 8,6 7,5 8,4
Construction 7,9 13,1 2,0
Wholesale and retail trade; repair of motor vehicles,
motorcycles and personal and household goods 3,6 4,7 2,5
Hotels and restaurants 4,8 6,4 3,5
Transport, storage and communication 9,4 11,3 6,4
Financial intermediation 7,0 7,4 6,5
Real estate, renting and business activities 10,6 12,9 8,5
Public administration and defence; compulsory social
security 22,7 4,6 46,0
Education 7,6 6,7 8,7
Health and social work 8,7 10,6 7,1
Other community, social and personal service activities 8,5 8,5 8,8
Total 5,4 5,5 3,9
Agriculture and Fishing 7,9 5,5 11,2
Manufacturing 1,7 3,6 -0,1
Services 5,8 6,8 4,8
Construction 7,9 13,1 2,0
Source: Own calculations based on Quadros de Pessoal , GEP, MTSS.
3 .3 .1 . Fir m Siz e
Firm size, summarised by average size and dispersion have an important sectoral component.
The increase of small firms in Portugal is also related to the declining average firm size, which is extended to all broad sectors of the economy, particularly to the manufacturing sector. While average size of manufacturing firms still is at least twice as large than services (Table 6), it tends to decrease faster between the two sub-periods than in the remaining sectors (from 20,8 average employees during 1995-2000 to 17,4 after 1995-2000).
The construction sector, which lived through an expansion period, both in terms of share of enterprises and employment between 1995 and 2000, shows a marked decline after 2003 in terms of enterprises, employment share, and average size.
41
Classification of Economic Activities (CEA).
42
Table 6. Average firm size by broad sectors and periods
(Number of employees)
Total economy
Agriculture
and Fishing Manufacturing Services Construction
1995-2007 10,0 4,9 18,9 8,4 8,9
1995-2000 10,9 5,5 20,8 8,6 9,5
2000-2007 9,4 4,5 17,4 8,3 8,3
Source: Own calculations based on Quadros de Pessoal, GEP, MTSS.
According to Table 7, the sectors with the largest standard deviation of size are “Electricity, gas and water supply” because of its heavily regulation and legal monopolies (although it is highly reduced during 2000-2007), “Financial activities”, “Public Administration, Defence and Social Security”, “Fishing” and “Education”. The less dispersed sectors are “Gross and retail commerce” and “Hotels and restaurants”. Manufacturing standard deviation is twice as large as total deviation, in line with other countries (Bartelsman et al., 2005). The standard deviation of firm size increases in the Service and in the “Agriculture and Fishing” sectors during 2000 to 2007 when compared to the whole period from 1995 to 2007.
To account for effects of size in dispersion rates, we have also computed the coefficient of variation. The dispersion is now highly reduced, with most sectors presenting a higher coefficient of variation than the country’s average. Overall dispersion, given by the standard deviation and coefficient of variation is reduced for the last 7 years, except for the Service and “Agriculture and Fishing” sector.
Table 7. Within industry standard deviation and coefficient of variation of firm size
Country average
1995-2007
Ratio to country sectoral averages
Country average 2000-2007
Ratio to country sectoral averages
Country average
1995-2007
Ratio to country sectoral averages
Country average 2000-2007
Ratio to country sectoral averages
Agriculture, farming of animals, hunting
and forestry 0,64 0,68 0,59 1,37 0,14 1,50 0,14 3,05
Fishing 6,20 6,60 3,84 8,91 0,40 4,24 0,33 7,25
Mining and quarrying 0,97 1,03 0,71 1,65 0,06 0,69 0,05 1,07
Manufacturing 2,03 2,16 0,86 1,99 0,11 1,16 0,05 1,08
Production of electricity, of gas and of
water supply 66,02 70,30 26,09 60,59 0,45 4,84 0,26 5,73
Construction 0,91 0,97 0,36 0,85 0,10 1,10 0,04 0,96
Wholesale and retail trade; repair of motor vehicles, motorcycles and personal and household goods
0,21 0,23 0,24 0,55 0,03 0,35 0,04 0,79
Hotels and restaurants 0,24 0,25 0,28 0,65 0,04 0,42 0,05 1,03
Transport, storage and communication 4,92 5,24 2,02 4,68 0,30 3,22 0,16 3,41
Financial intermediation 14,81 15,78 6,13 14,24 0,28 2,97 0,14 3,10
Real estate, renting and business activities 0,58 0,61 0,63 1,47 0,06 0,60 0,06 1,34
Public administration and defence;
compulsory social security 7,90 8,41 8,18 19,00 0,37 4,00 0,33 7,21
Education 1,71 1,82 1,44 3,34 0,10 1,09 0,09 1,99
Health and social work 0,81 0,86 0,86 1,99 0,07 0,75 0,07 1,57
Other community, social and personal
service activities 0,24 0,25 0,23 0,54 0,04 0,40 0,04 0,79
Agriculture and Fishing 0,71 0,76 0,60 1,39 0,15 1,56 0,13 2,90
Manufacturing 2,09 2,22 0,87 2,03 0,11 1,18 0,05 1,09
Services 0,35 0,37 0,37 0,86 0,04 0,44 0,04 0,97
Construction 0,91 0,97 0,36 0,85 0,10 1,10 0,04 0,96
TOTAL 0,94 0,43 0,09 0,05
Within industry coefficient of variation of firm size (as a ratio to country sectoral average) Within industry standard deviation of firm size
(as a ratio to country sectoral average)
Source: Own calculations based on Quadros de Pessoal , GEP, MTSS.
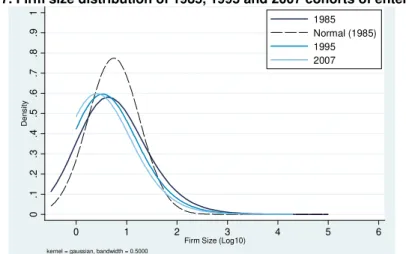
4 . Fir m Size D ist r ibu t ion
In order to assess if the increasing presence of smaller firms is indeed affecting the composition of the population of firms, an analysis of the size distribution of employer enterprises was considered. Following Cabral and Mata (2003), we analysed the firm size distribution for our subset of firms based on Quadros de Pessoal43. On the one hand, we have found a firm size distribution skewed44 to the right, with a distinct shape from the Normal distribution, in line with Cabral and Mata’s (2003) results. On the other, we observe that this distribution is not stable over time (Figure 7), showing an increasing prevalence of smaller firms in the population of employer enterprises. The whole firm size distribution has indeed been shifting to the smallest size classes, where smaller units are increasingly prevalent in the population.
Figure 7. Firm size distribution of 1985, 1995 and 2007 cohorts of enterprises
0
.1
.2
.3
.4
.5
.6
.7
.8
.9
1
De
n
s
it
y
0 1 2 3 4 5 6
Firm Size (Log10)
1985 Normal (1985) 1995 2007
kernel = gaussian, bandwidth = 0.5000
Source: Own calculations based on Quadros de Pessoal, GEP, MTSS.
5 . M a in Con clu sion s
The population of active employer enterprises has been growing steadily in Portugal over more than 20 years, especially due to the contribution of smaller sized firms. We can identify four distinct periods, based on the growth rates and on the cycles of enterprise births, before 1989, from 1990 to 1994, 1995 to 1999 and after 2000. A decreasing rhythm of enterprise growth emerges after 2001, visible throughout all broad sectors and regions.
The increasing predominance of small and medium sized firms is clearly observable, in line with what seems to be a general tendency in other developed countries. In 2007, 98% of the Portuguese enterprises present in Quadros de Pessoal, employed less than 50 workers. This is due to both structural effects, such as the increasing dominance of the service sector in the economy, in terms of the number of enterprises and employees, and the gradual decrease of average firm size in all broad sectors.
Norte is the region with the highest number of births and share of enterprises in the country, while Algarve is the region with the highest growth in active enterprises and rate of birth in Portugal, where firms are created with the smallest average size.
Portugal is increasingly a service-based economy, where the service sector has occupied the pole position in enterprise creation since 2003. Overall dispersion of firm size has decreased for the total economy,
43 We applied a nonparametric estimation method, a gaussian kernel density smoother with a bandwidth of 0,5 to the
logartithm of firm size to test if firm size (expressed as the log of the employment of the firm) distribution is stable and approximately lognormal for the population of active enterprises. It is important to keep in mind that the type of distribution depends heavily on the data source considered (Cabral, 2007).
44
during 2000 to 2007 compared to the period 1995-2007, but has risen in the Service and “Agriculture and Fishing” sectors.
BI BLI OGRAPH Y
Ahmad, N. (2006) "A Proposed Framework for Business Demography Statistics." OECD Statistics Working Papers 2006/3.
Ahmad, N. and A. Hoffman (2008). “A Framework for Addressing and Measuring Entrepreneurship”, OECD Statistics Working Paper 2008/2.
Ahmad, N. and R. G. Seymour (2008). "Defining Entrepreneurial Activity: Definitions Supporting Frameworks for Data Collection." OECD Statistics Working Paper.
Ahn, S. (2001), “Firm dynamics and Productivity Growth: a review of micro evidence from OECD countries”, OECD Economics Department Working Paper n. 297, Paris.
Axtell, R.L. (2001), "Zipf Distribution of U.S. Firm Sizes", Science 293:5536, pp. 1818-1820.
Bartelsman, E.J., S. Scarpetta, and F. Schivardi, (2005), "Comparative Analysis of Firm Demographics and Survival: Evidence from Micro-level Sources in OECD Countries", Industrial and Corporate Change, 14(3): 365–391.
Bartelsman, E.J., J. Haltiwanger, and S. Scarpetta, (2004), "Microeconomic Evidence of Creative Destruction in Industrial and Developing Countries", The World Bank Policy Research Working Paper Series 3464.
Cabral, L. (2007), “Small firms in Portugal: A selective Survey of Stylized Facts, Economic Analysis and Policy Implementation”. Portuguese Economic Journal, 6(1): 65-88.
Cabral, L. and J. Mata (2003), “On the evolution of the firm size distribution: facts and theory”, The American Economic Review, 93(4): 1075 - 1090.
Eurostat (2009), "Business Demography: employment and survival", Statistics in focus, 70/2009. Eurostat/OECD (2007), "Eurostat/OECD Manual on Business Demography Statistics".
Gaffeo E., Gallegati M. and A. Palestrini (2003), On the Size Distribution of Firms. Additional Evidence from the G7 Countries, Physica A, 324:117-123.
Ijiri, Y. and H. A. Simon (1977), "Skew Distributions ans the Sizes of Business Firms", North-Holland. OECD (2000), "OECD Small and medium enterprise outlook", Paris.
OECD (2005), "The 2005 OECD SME and Entrepreneurship Outlook", Paris.
OECD/Eurostat (2009), "Measuring Entrepreneurship A Collection of Indicators, 2009 Edition", OECD/Eurostat Entrepreneurship Indicators Programme.
Ribeiro, E. P. (2007) “The Dynamics of Firm Size Distribution”, Brazilian Review of Econometrics, Vol. 27, nº 2.
Sarmento, E. de Morais e A. Nunes (2010), “Entrepreneurship performance indicators for active employer enterprises in Portugal”, Temas Económicos nº 9, Gabinete de Estratégia e Estudos, Ministério da Economia, da Inovação e do Desenvolvimento.
Scarpetta, S., P. Hemmings, T. Tressel and J. Woo (2002), “The role of policy and institutions for productivity and firm dynamics”, OECD Economics Department Working Papers, n. 329.
Schaper, M. Dana. L. P., R. Anderson, P. W. Moroz (2008), “Distribution of firms by size: observations and evidence from selected countries”, International Journal of Entrepreneurship and Innovation Management, Vol. 8, n. 6, 2008.