Received 27/11/2009 Accepted 14/2/2010 (004544)
1 Department of Chemistry, State University of Maringá, Av. Colombo, 5790, CEP 87020-900, Maringá, PR, Brazil, E-mail: [email protected] *Corresponding author
Proximate composition and quantification of fatty acids in five major
Brazilian chocolate brands
Composição centesimal e quantificação de ácidos graxos nas cinco maiores marcas de chocolates do Brasil
Rúbia Michele SUZUKI1, Paula Fernandes MONTANHER1,
Jesuí Vergilio VISENTAINER1, Nilson Evelázio de SOUZA1*
1 Introduction
Chocolate is a product obtained by the proper processing of one or more ingredients: cocoa nibs, cocoa paste or liquor, cocoa butter, with or without optional ingredients allowed by the Food and Agricultural Organization (MININ; CECCHI; MININ, 1998).
The consumption of chocolates has been recently associated with a larger ingestion of saturated fats and the consequent rise of cholesterol and risk of chronic diseases. However, chocolate is currently valued due to studies that demonstrate its benefits to health, which has stimulated its daily consumption. (DING et al., 2006).
Sugar substitutes have gained importance due to the increasing demand for diet and light products resulting from the growing effort to reduce the ingestion of calories and/or of specific diets because of a growing concern about health in the last years. Every year, over 180 new diet and light products are
launched in the market, and at present they account for 12% of supermarket sales. In the last decade, the Brazilian market for diet and light products grew 80%; however, it is estimated that it represents only 5% of the food market in the country thus having a potential for growth (FANDINI, 2005).
The advancement of the chemical study of foods is greatly indebted to the development of gas chromatography (GC). The impacts of the advancements in gas liquid chromatography on the study of fatty acids has contributed to, among other things, the detailed investigation of positional and geometric isomers with distinct biological functions that could not be separated or identified until then (JOSEPH; ACKMAN, 1992; MARTIN et al., 2007; MARTIN et al., 2008).
The objective of this work was to determine the chemical composition and quantify fatty acids in five major Brazilian Resumo
O objetivo do presente trabalho foi caracterizar a composição centesimal e quantificar os ácidos graxos com ênfase em ácidos graxos trans em chocolates normal e dietéticos de cinco grandes marcas. As amostras foram adquiridas em diferentes supermercados na região de Maringá. As marcas foram nomeadas por letras, sendo que para cada marca, foram analisados cinco lotes, com três unidades de chocolate por lote e as análises foram realizadas em triplicatas. Observou-se que os chocolates diets apresentaram maiores teores de lipídios que os chocolates normais das mesmas marcas. Os principais ácidos graxos observados foram os ácidos graxos saturados (SFA), ácido mirístico (14:0), ácido palmítico (16:0) e ácido esteárico (18:0). Entre os ácidos graxos monoinsaturados (AGMI), ácidos graxos poli-insaturados (AGPI) e ácidos graxos trans, o ácido oleico (18:1 n-9), ácido linoleico (18:2 n-6), ácido e elaídico (18:1-9t) predominaram. O conteúdo de ácidos graxos trans encontrado nas amostras analisadas foram inferiores e/ou iguais aos limites estabelecidos pela regulamentação brasileira.
Palavras-chave: ácidos graxos; chocolates; dietéticos.
Abstract
The objective of the present study was to characterize the centesimal composition and quantify fatty acids in regular and diet chocolate brands with emphasis on trans fatty acids. Regular and diet dark chocolate samples from the major brands analyzed were purchased from different local supermarkets in the city of Maringá. The brands were labeled with letters and five lots of each brand with three chocolate units per lot were analyzed in triplicate. We observed that the diet chocolates from the same brands presented larger lipid contents. The main fatty acids observed were saturated fatty acids (SFA), myristic acid (14:0), palmitic acid (16:0), and estearic acid (18:0). Among the monounsaturated fatty acids (MUFA), polyunsaturated fatty acids (PUFA) and trans fatty acids, oleic acid (18:1n-9), linoleic acid (18:2n-6), and elaidic acid (18:1-9t) predominated. The trans fatty acid contents found in the analyzed samples were lower than and/or in accordance with the limits proposed by the Brazilian regulation.
Keywords: fatty acids; chocolate; diet.
acid geometric isomers c9t11 and t10c12 (189-19 and O-5626, Sigma, USA) and equivalent chain length (ECL).
The ECL of fatty acid esters were determined according to Ackman (1972) based on the ECL values determined for standard 189-9 (Sigma, USA).
The limits of detection and quantification were estimated from successive dilutions of a standard solution of methyl arachidate according to the ACS(AMERICAN..., 1980) recommendations and considering the signal noise ratios equal to three and ten, respectively.
The fatty acids in mg.g-1 total lipids were quantified in
relation to the internal standard, methyl tricosanoate (23:0) from Sigma. Before transesterification, 1.00 mL of internal standard solution (1 mg.mL-1) was added to all samples, and the solvent
was evaporated under N2 flow.
The sample fatty acids were quantified after the verification of the agreement between the theoretical and experimental response factors.
The sample fatty acid concentrations were calculated according to Joseph and Ackman (1992), using the Equation 1:
C (mg.g–1) = 23:0 23:0
X RF
A CT
A M T
A M F
⋅ ⋅
⋅ ⋅
(1)
where:
AX: area of FAMEs;
A23:0: internal standard area;
M23:0: internal standard mass added to the sample (mg);
Sample mass (g);
TRF: theoretical response factor of FAMEs; and
FCT: conversion factor to express the results in mg of fatty acids.g–1 of total lipids (TL).
2.4 Equipment response validation
To assess the response of the flame ionization detector, the theoretical response factors were calculated for methyl tricosanoate as proposed by Ackman (1972). Next, the experimental response factors for the methyl esters were determined by analyzing a 189-19 (Sigma, USA) standard mixture in n-heptane containing these esters and 0.25 mg.mL-1
methyl tricosanoate.
The solution was injected in five repetitions, and the experimental correction factors of the different esters were determined from the methyl ester areas and masses. The Equation 2 can be written as:
ECF = Mx × AS/MS × Ax (2)
where:
Mx: Methyl ester mass X;
Mx: Methyl ester area X;
MS: Standard mass; and
regular and diet chocolate brands with emphasis on trans fatty acids.
2 Materials and methods
2.1 Sampling
Five major regular and diet brands of chocolate sold in different supermarkets in the City region of the city of Maringá were analyzed. The brands were labeled with letters and five lots of each brand with three chocolates units per lot were analyzed. Each lot was analyzed separately and in triplicate (n = 15).
2.2 Chemical Analysis
The moisture and ash contents of the chocolates were determined using the method described by AOAC, and the crude protein content was determined by the Kjeldahl method (CUNNIFF, 1998). The total lipid (TL) of the chocolates was extracted with a chloroform and methanol mixture (2:1 v/v), according to Folch, Less and Stanley (1957). The carbohydrates were calculated by subtraction: 100 – (% moisture + % ashes + % crude protein + % TL). The energy value (Cal) of the samples was calculated by adding crude protein and total carbohydrates multiplied by 4 (Cal.g–1) added to the TL content multiplied
by factor 9 (Cal/g), i.e., energy value, Cal = [(4 × proteins) + (4 × carbohydrates) + (9 × total fat)] (HOLANDS, et al., 1994).
2.3 Fatty acids analysis
The lipids were converted into FAMEs as described by Hartman and Lago (1993) with modifications.
In a screw-cap tube, 30 ± 1 mg lipids were weighed, to which 50.00 mL of 0.5 mg.mL–1 methyl tricosanoate in n-heptane were
added. After solvent evaporation under nitrogen flow, the lipids were saponified in 0.5 mol.L–1 sodium hydroxide in methanol
and esterified with a mixture of ammonium chloride, methanol, and sulfuric acid in the proportion of 1:30:1.5 (m/v/v). After adding 4 mL of saturated sodium chloride, the esters were extracted with 1 mL of n-heptane and stored in freezer at -18 °C for later chromatographic analysis.
one of its ingredients, is rich in several essential minerals such as magnesium, copper, potassium, and manganese (HAMMRSTONE et al., 2000).
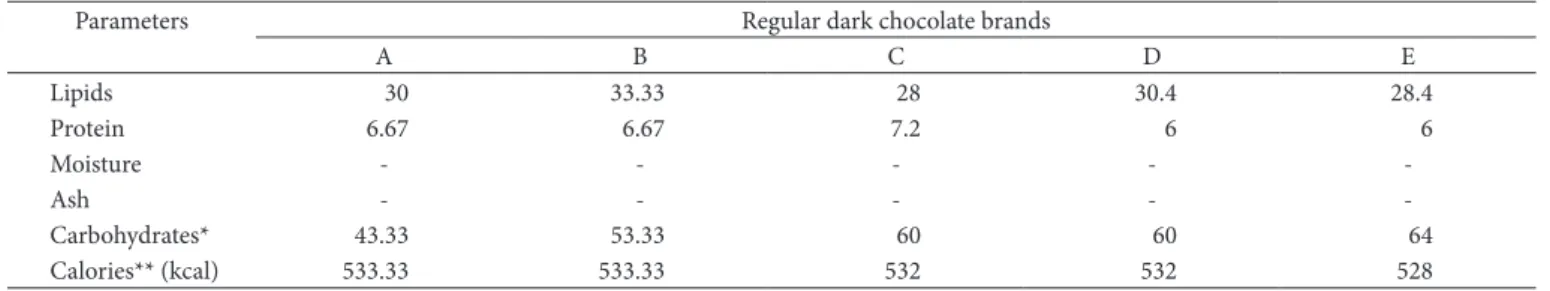
The crude protein content (6.63%) found for regular dark chocolate of brand E (Table 1) is the only one that was close to the label value (6%) (Table 2). All the other chocolate brands had protein amounts lower than those reported on their food labels. Comparing normal and diet chocolate of brands A and B (Table 3), we observe that brand B regular chocolate had the lowest crude protein content (4.69%).
The moisture and ash contents of all chocolate brands analyzed were within the regulation values, maximum values of 3% moisture and 2.4% ashes.However, these values were not informed on any of the food labels of the brands analyzed.
The TL contents found for all chocolate brands and types analyzed (Tables 1 and 3) were lower than the label values (Tables 2 and 4). The differences between the experimental and food label values can be explained by either non-uniform raw material composition or processing variations. Nevertheless, all brands presented lipid contents within the limits set by the Brazilian regulations, a minimum of 20% lipids (BRASIL, 1978).
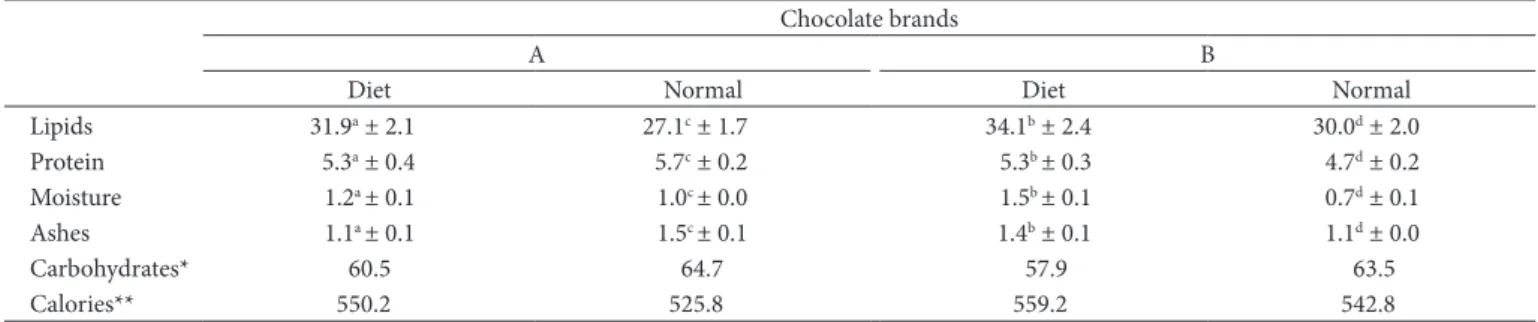
We observed that the diet chocolates of the same brands presented larger lipid contents. This fact may be related to the absence of sugar and the need to increase the amount of fat to maintain the consistency of the chocolate (BOCHICCHIO et al., 2005).
The data presented in Table 5 show the concentration of fatty acids in regular chocolate from brands A, B, C, D, and E. Among the saturated fatty acids, palmitic acid (16:0) and estearic AS: Standard area.
The theoretical correction factors (TCF) were calculated based on the internal standard methyl tricosanoate from values published by Bannon et al. (1986).
2.5 Method Validation
A certified reference powder milk (RM-8435) obtained from the National Institute of Standards and Technology from Canada, NIST, was used to confirm the accuracy of the method. The reference material was submitted to the same procedures used for the experimental samples.
2.6 Statistical Analysis
The results were submitted to variance analysis (ANOVA) at 5% probability, and the means were compared using the Tukey Test at 5% probability using the software Statistica version 7 (STATSOFT, 2004).
3 Results and discussion
Tables 1 and 3 show the chemical composition of the different chocolate brands, and Tables 2 and 4 show the product nutritional label data.
The carbohydrate contents were obtained by subtraction (Tables 1 and 3), which explains the values higher than those given on food labels. The data in Tables 2 and 4 were probably obtained by some other method. The amount of calories of the chocolates are high due to their large amount of carbohydrates and lipids (VISSOTTO et al.,1999). In addition to the carbohydrates and fat found in the chocolate, cocoa,
Table 1. Chemical composition of different brands of regular dark chocolate (g.100 g–1).
Regular dark chocolate brands
A B C D E
Lipids 27.2ade ± 1.7 30.0bd ± 2.0 23.4ce ± 1.6 28.2adb ± 1.1 25.3aec ± 1.5
Protein 5.7ac ± 0.2 4.7bd ± 0.2 5.5ac ± 0.2 4.9bd ± 0.1 6.6e ± 0.4
Moisture 1.0ade ± 0.1 0.7b ± 0.1 1.2cde ± 0.1 1.1cd ± 0.1 1.1acd ± 0.1
Ashes 1.5ae ± 0.1 1.1b ± 0.1 1.8 cd ± 0.1 1.7cd ± 0.1 1.5ae ± 0.0
Carbohydrates* 60.5 64.7 68.1 64.1 65.4
Calories** (kcal) 550.2 542.8 505.7 529.9 516.3
Results given as mean ± standard deviation of triplicate analyses of five different lots (n = 45). Different letters in the same line indicate a significant dfference by Tukey test at 5% confidence. *The total carbohydrates were calculated by subtraction: 100-(% moisture +% ashes + % crude protein + % TL) **The amount of calories of the samples was calculated by
adding the percent crude protein and total carbohydrates multiplied by factor 4 (Cal.g–1) added to the total lipid content multiplied by factor 9 (Cal.g–1) (Holands et al., 1994).
Table 2. Chemical composition of dark chocolate as informed on the product nutritional labels (g.100 g–1).
Parameters Regular dark chocolate brands
A B C D E
Lipids 30 33.33 28 30.4 28.4
Protein 6.67 6.67 7.2 6 6
Moisture - - - -
-Ash - - - -
-Carbohydrates* 43.33 53.33 60 60 64
Calories** (kcal) 533.33 533.33 532 532 528
Table 4. Chemical composition of regular and diet dark chocolate as informed on product nutritional labels (g.100 g–1).
Parameters Chocolate brands
A B
diet normal diet normal
Lipids 33.33 30 36.67 33.33
Protein 6.67 6.67 6.67 6.67
Moisture - - -
-Ashes - - -
-Carbohydrates* 53.33 43.33 50 53.33
Calories (kcal)** 466.67 533.33 500 533.33
*,**The labels do not inform the determination methods that were used.
Table 5. Fatty acid profile of regular dark chocolate (g.100 g–1 chocolate).
Fatty Acids Regular dark chocolate brands (g.100 g–1 chocolate)
A B C D E
C4:0 0.18 a ± 0.022 0.11 bde ± 0.010 0.04 c ± 0.003 0.12 bde ± 0.013 0.11 bde ± 0.006
C6:0 0.06 a ± 0.006 0.10 b ± 0.009 0.09 c ± 0.007 0.03 d ± 0.003 0.09 c ± 0.006
C8:0 0.04 a ± 0.004 - 0.06 c ± 0.005 0.04 d ± 0.003 0.02 e ± 0.001
C10:0 0.09 a ± 0.008 0.03 bce ± 0.003 0.04 bce ± 0.003 0.08 d ± 0.006 0.03 bce ± 0.003
C12:0 0.10 ade ± 0.009 0.06 bc ± 0.005 0.05 bc ± 0.004 0.09 ade ± 0.008 0.10 ade ± 0.007
C14:0 0.34 a ± 0.023 0.23 bce ± 0.017 0.24 bce ± 0.014 0.39 d ± 0.029 0.24 bce ± 0.017
C14:1n-7 0.05 ad ± 0.004 0.02 be ± 0.002 0.04 c ± 0.003 0.05 ad ± 0.003 0.03 be ± 0.002
C15:0 0.04 ad ± 0.002 0.04 be ± 0.003 0.05 cd ± 0.004 0.05 acd ± 0.004 0.04 be ± 0.002
C16:0 6.93 ab ± 0.553 6.46 ab ± 0.286 4.86 c ± 0.397 5.69 de ± 0.434 5.48 de ± 0.245
C16:1n-7 0.09 a ± 0.007 0.06 be ± 0.005 0.08 cd ± 0.007 0.08 cd ± 0.006 0.07 be ± 0.004
C17:0 0.06 ae ± 0.004 0.07 bcde ± 0.005 0.07 bcd ± 0.005 0.07 bcd ± 0.005 0.07 abe ± 0.005
C18:0 7.56 abde ± 0.348 8.05 abd ± 0.255 5.63 c ± 0.386 7.77 abd ± 0.587 7.07 ae ± 0.464
C18:1n-9t 0.07 abde ± 0.005 0.08 ab ± 0.004 0.11 c ± 0.010 0.06 ade ± 0.004 0.07 ae ± 0.006
C18:1n-9 8.06 ab ± 0.602 8.42 ab ± 0.349 5.81 c ± 0.470 7.41 d ± 0.364 6.82 e ± 0.549
C18:2n-6 0.67 a ± 0.057 0.76 b ± 0.034 0.42 c ± 0.016 0.57 de ± 0.051 0.60 de ± 0.046
C20:0 0.23 ade ± 0.019 0.27 b ± 0.016 0.17 c ± 0.010 0.23 ade ± 0.020 0.22 ade ± 0.015
C18:3n-3 0.06 ad ± 0.004 0.04 be ± 0.003 0.03 c ± 0.003 0.05 ad ± 0.004 0.04 be ± 0.003
C20:1n-9 0.06 a ± 0.001 0.02 b ± 0.001 0.02 ce ± 0.003 - 0.02 ce ± 0.001
C22:0 0.05 ace ± 0.004 0.05 bd ± 0.003 0.05 ace ± 0.004 0.05 bd ± 0.005 0.05 ace ± 0.003
C24:0 0.02 ae ± 0.001 0.03 b ± 0.001 0.02 c ± 0.002 0.03 d ± 0.002 0.03 ae ± 0.002
SFA 15.48 abd ± 0.910 15.41 abd ± 0.698 11.04 c ± 0.740 14.76 ad ± 0.653 13.28 e ± 0.920
MUFA 8.25 abd ± 0.625 8.59 ab ± 0.542 5.79 c ± 0.453 7.64 ad ± 0.555 6.85 e ± 0.502
PUFA 0.70 ae ± 0.061 0.82 b ± 0.054 0.45 c ± 0.022 0.58 d ± 0.050 0.66 ae ± 0.049
Trans 0.07 ade ± 0.005 0.08 b ± 0.007 0.10 c ± 0.010 0.06 ade ± 0.004 0.07 ade ± 0.006
n-6 0.68 a ± 0.054 0.75 b ± 0.036 0.42 c ± 0.016 0.58 de ± 0.048 0.60 de ± 0.046
n-3 0.06 ad ± 0.006 0.04 be ± 0.002 0.03 c ± 0.003 0.06 ad ± 0.005 0.04 be ± 0.004
Results given as mean ± standard deviation of triplicate analyses of five lots (n = 15). Different letters in the same line indicate a significant difference by Tukey test at 5% confidence.
Table 3. Chemical composition of regular and diet dark chocolate (g.100 g–1).
Chocolate brands
A B
Diet Normal Diet Normal
Lipids 31.9a ± 2.1 27.1c ± 1.7 34.1b ± 2.4 30.0d ± 2.0
Protein 5.3a ± 0.4 5.7c ± 0.2 5.3b ± 0.3 4.7d ± 0.2
Moisture 1.2a ± 0.1 1.0c ± 0.0 1.5b ± 0.1 0.7d ± 0.1
Ashes 1.1a ± 0.1 1.5c ± 0.1 1.4b ± 0.1 1.1d ± 0.0
Carbohydrates* 60.5 64.7 57.9 63.5
Calories** 550.2 525.8 559.2 542.8
Results given as mean ± standard deviation of triplicate analyses of 5 different lots (n = 15). Different letters in the same line indicate a significant difference by Tukey test at 5% confidence. *The total carbohydrates were calculated by subtraction: 100 – (% moisture + % ashes + % crude protein + % TL). ** The amount of calories (kCal) of the samples was calculated by
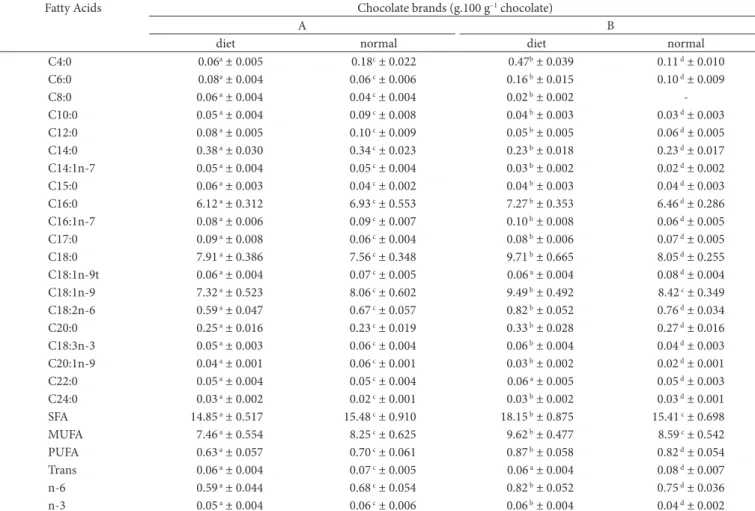
Table 6. Fatty acid profile of regular and diet chocolates (g.100 g–1 de chocolate).
Fatty Acids Chocolate brands (g.100 g–1 chocolate)
A B
diet normal diet normal
C4:0 0.06a ± 0.005 0.18c ± 0.022 0.47b ± 0.039 0.11 d ± 0.010
C6:0 0.08a ± 0.004 0.06 c ± 0.006 0.16 b ± 0.015 0.10 d ± 0.009
C8:0 0.06 a ± 0.004 0.04 c ± 0.004 0.02 b ± 0.002
-C10:0 0.05 a ± 0.004 0.09 c ± 0.008 0.04 b ± 0.003 0.03 d ± 0.003
C12:0 0.08 a ± 0.005 0.10 c ± 0.009 0.05 b ± 0.005 0.06 d ± 0.005
C14:0 0.38 a ± 0.030 0.34 c ± 0.023 0.23 b ± 0.018 0.23 d ± 0.017
C14:1n-7 0.05 a ± 0.004 0.05 c ± 0.004 0.03 b ± 0.002 0.02 d ± 0.002
C15:0 0.06 a ± 0.003 0.04 c ± 0.002 0.04 b ± 0.003 0.04 d ± 0.003
C16:0 6.12 a ± 0.312 6.93 c ± 0.553 7.27 b ± 0.353 6.46 d ± 0.286
C16:1n-7 0.08 a ± 0.006 0.09 c ± 0.007 0.10 b ± 0.008 0.06 d ± 0.005
C17:0 0.09 a ± 0.008 0.06 c ± 0.004 0.08 b ± 0.006 0.07 d ± 0.005
C18:0 7.91 a ± 0.386 7.56 c ± 0.348 9.71 b ± 0.665 8.05 d ± 0.255
C18:1n-9t 0.06 a ± 0.004 0.07 c ± 0.005 0.06 a ± 0.004 0.08 d ± 0.004
C18:1n-9 7.32 a ± 0.523 8.06 c ± 0.602 9.49 b ± 0.492 8.42 c ± 0.349
C18:2n-6 0.59 a ± 0.047 0.67 c ± 0.057 0.82 b ± 0.052 0.76 d ± 0.034
C20:0 0.25 a ± 0.016 0.23 c ± 0.019 0.33 b ± 0.028 0.27 d ± 0.016
C18:3n-3 0.05 a ± 0.003 0.06 c ± 0.004 0.06 b ± 0.004 0.04 d ± 0.003
C20:1n-9 0.04 a ± 0.001 0.06 c ± 0.001 0.03 b ± 0.002 0.02 d ± 0.001
C22:0 0.05 a ± 0.004 0.05 c ± 0.004 0.06 a ± 0.005 0.05 d ± 0.003
C24:0 0.03 a ± 0.002 0.02 c ± 0.001 0.03 b ± 0.002 0.03 d ± 0.001
SFA 14.85 a ± 0.517 15.48 c ± 0.910 18.15 b ± 0.875 15.41 c ± 0.698
MUFA 7.46 a ± 0.554 8.25 c ± 0.625 9.62 b ± 0.477 8.59 c ± 0.542
PUFA 0.63 a ± 0.057 0.70 c ± 0.061 0.87 b ± 0.058 0.82 d ± 0.054
Trans 0.06 a ± 0.004 0.07 c ± 0.005 0.06 a ± 0.004 0.08 d ± 0.007
n-6 0.59 a ± 0.044 0.68 c ± 0.054 0.82 b ± 0.052 0.75 d ± 0.036
n-3 0.05 a ± 0.004 0.06 c ± 0.006 0.06 b ± 0.004 0.04 d ± 0.002
Results given as mean ± standard deviation of triplicate analyses of five sample lots. (n = 15). Different letters in the same line indicate a significant difference by Tukey test at 5% confidence.
acid (18:0) predominated, ranging from 4.86 (brand C) to 6.93 (g brand A) and 5.63 (brand C) to 7.77 g (brand D).100 g–1 of
chocolate, respectively.
Among the MUFA, oleic acid (18:1n-9) stood out, ranging from 5.81 (brand C) to 8.42 g (brand B).100 g–1 of chocolate.
The amounts of PUFA ranged from 0.45 g (brand C) to 0.82 g (brand B); linoleic acid predominated (18:2n-6).
Trans fatty acid elaidic acid was identified and quantified, ranging from 60 mg to 110 mg in brands D and C, respectively, per 100 g of chocolate.
Regular chocolates brands A and B presented larger amounts of fatty acids per 100 g of chocolate, 15.48 g and 15.41 g SFA, 8.06 g and 8.42 g MUFA, and 0.70 g and 0.82 g PUFA. Brand C presented the lowest amount of fatty acids, and it was recommended as the healthiest regular chocolate, followed by brands D and E.
Table 6 presents the fatty acid concentration results for regular and diet dark chocolate samples from brands A and B. The major SFA were palmitic acid (16:0) and estearic acid (18:0), ranging from 6.12 (diet brand A) to 7.27 g (diet brand B) and from 7.56 (regular brand A) to 9.71 (diet brand B) g.100 g–1 chocolate.
MUFA oleic acid (18:1n-9) stood out with amounts ranging from 7.32 (diet brand A) to 9.49 (diet brand B) g.100 g–1 of
chocolate. The amounts of PUFA ranged from 0.63 g (diet brand A) to 0.87 g (diet brand B), and the linoleic acid (18:2n-6) was the highest.
Trans fatty acid elaidic acid (18:1n-9t) was identified and quantified, ranging from 60 to 80 mg in diet and regular brand B, respectively, per 100 g of chocolate.
Brand B diet chocolates presented larger amounts of fatty acids: 18.15 g of SFA, 9.49 g of MUFA, and 0.87 g of PUFA per 100 g of chocolate. Brand A diet chocolates had the lowest amounts of fatty acids, being recommendable as the healthiest among the diet and regular dark chocolate, followed by regular A, regular B, and diet B. Therefore, brand B diet chocolate is the least recommendable in terms of SFA and TL contents when compared to the regular chocolate brands C, D, and E.
Like the regulations of most countries, the Brazilian regulations prohibits the addition of fats (coconut, cotton, palm, and soybeans) to chocolate. In some countries, such as England, Ireland, Denmark, and Japan, the substitution of cocoa butter is allowed up to 5% of the total chocolate mass or 15% of the total fat mass of chocolate (MININ; CECCHI; MININ, 1999).
As a result of the high prices of cocoa and its derivatives, cocoa butter has been totally or partially substituted for similar products. The use of similar products depends on the similarity of their physical, chemical, and functional properties to those of cocoa butter, they do not form an eutetic mixture and reduce the product fusion point. All these fats (coconut, cotton, palm, and soybeans) are constituted of triacylglycerols, which structurally are glycerol-alcohol triesterified with fatty acids.
4 Conclusions
Concerning the lipid and saturated fatty acid contents, among the seven dark chocolate brands analyzed, five regular brands (A, B, C, D, E) and two diet brands (A and B) were the healthiest.
Trans fatty acid elaidic acid (18:1n-9t) was identified and quantified in all chocolate brands analyzed; however, its concentration was below the Brazilian regulation values.
References
ACKMAN, R. G. The analysis of fatty acids and related materials by gas-liquid chromatography. Progress in the Chemistry of Fats & Other
Lipids, v. 12, p. 165-284, 1972.
http://dx.doi.org/10.1016/0079-6832(72)90003-1
AMERICAN CHEMICAL SOCIETY - ACS. Guidelines for data acquisition and data quality evaluation in Environmental Chemistry.
Analytical Chemistry, v. 52, p. 2242-2249, 1980. http://dx.doi.
org/10.1021/ac50064a004
BANNON, C. D. et al. Analysis of fatty acid methyl esters with high accuracy and reliability. III. U.K., Literature review of and investigations into the development of rapid procedures for the methoxide-catalysed methanol of fats and oils”. Journal of
Chromatography, v. 247, p. 71-89, 1982. http://dx.doi.org/10.1016/
S0021-9673(00)84857-8
BOCHICCHIO, D. et al. Effect of Feeding Partially Hidrogenated Lardo n Trans-fatty Acid Contento f Muscle and Backfast of Heavy Pigs.
Meat Science, v. 71, p. 651-656, 2005. http://dx.doi.org/10.1016/j.
meatsci.2005.05.010
BRASIL. Ministério da Saúde. Resolução número 12/78 da Comissão Nacional de Normas e Padrões para Alimentos. Aprova Normas Técnicas Especiais do Estado de São Paulo, Relativas a Alimentos
(e Bebidas). Diário Oficial da República Federativa do Brasil, Brasília, DF, 24 jul. 1978. Seção I, parte 1, p. 11499-11527. Corrigida pelo Comunicado número 37/80 da Divisão Nacional de Normas e Vigilância Sanitária de Alimentos.
CUNNIFF, P. A. Official Methods of Analysis of AOAC International. 6th ed. Arlington: Association of Official Analytical Chemist, 1998. v. 2
DING, E. L. et al. Chocolate and Prevention of Cardiovascular Disease: a Systematic Review. Nutrition Metabolism, v. 3, p. 1743-7075, 2006.
FANDINI, A. N. et al. Características sensoriais e de textura de chilces drageados die produzidos com diferentes tipos de polióis. Brazilian
Journal of Food Techonol, v. 8, p. 113-119, 2005.
FOLCH, J.; LESS, M.; STANLEY, G. H. S. A simple method for the isolation and purification of total lipids from animal tissues. The
Journal of Biological Chemistry, v. 226, p. 497-509, 1957.
GRIMALD, R.; GOLÇALVES, G. A. L.; ESTEVES, W. Características de Gorduras Comerciais Brasileiras. Brazilian Journal of Food
Techonology, v. 3, p. 159-164, 2000.
HAMMRSTONE, J. F. et al. Identification of Procyanidins in Cocoa (Theobroma Cacao) ad chocolate using high-performance liquid chromatography/mass spectrometry. Journal of Agricultural and
Food Chemistry, v. 47, p. 490-496, 1999. PMid:10563922. http://
dx.doi.org/10.1021/jf980760h
HARTMAN, L.; LAGO, R. C. A. Rapid preparation of fatty acid methyl esters from lipids. Laboratory Practice, v. 22, p. 475-477, 1973. HOLANDS, B. et al. MacCance and Winddowson’s: The Composition
of Foods. 5th ed. Cambridge: The Royal Society of Chemistry and Ministry of Agriculture, Fisheries and Food, 1994.
JOSEPH, J. D.; ACKMAN, R. G. Capillary column gas chromatography method for analysis of encapsulated fish oil and fish oil ethyl esters: collaborative study. Journal of Association of Official Analytical
Chemical International, v. 75, p. 488-506, 1992.
MARTIN, C. A. et al. Trans fatty acid-forming processes in foods: a review. Anais da Academia Brasileira de Ciências, v. 79, p. 343-350, 2007. http://dx.doi.org/10.1590/S0001-37652007000200015 MARTIN, C. A. et al. Optimization of the selectivity of a cyanopropyl
stationary phase for the gas chromatographic analysis of trans fatty acids. Journal of Chromatography A, v. 1191, p. 111-117, 2008. PMid:18468609. http://dx.doi.org/10.1016/j.chroma.2008.04.033 MININ, V. P. R.; CECCHI, H. M.; MININ, L. A. Determinação de
Substitutos da Manteiga de Cacau em Coberturas de Chocolate Através da Análise de Triacilgliceróis. Ciência e Tecnologia de
Alimentos, v. 19, p. 277-281, 1999.
STATSOFT. Statística 7.0 software. Tucksa: StatSoft, Inc., 2004. VISSOTTO, F. V. et al. Caracterização Fisico-Química e Relógica de