ABSTRACT
RESUMO
Submetido em 16/10/2014 e aprovado em 08/05/2017.
1 This study is part of the first author’s Master Degree dissertation.
2 Universidade Federal do Paraná, Departamento de Engenharia Florestal, Curitiba, Paraná, Brazil. [email protected]; [email protected]; [email protected];
[email protected]; [email protected]
3 Embrapa Florestas, Colombo, Paraná, Brazil. [email protected]
*Corresponding author: [email protected]
Economic analysis and revenue optimization
in management regimes of
Pinus taeda
1The objective of this work was to select, using operational research techniques, management regimes of Pinus taeda L. that maximize the revenue generated by the wood, considering different attractiveness rates. The OpTimber-LP® software, which performs the simulations using SisPinus® software, was used for forest optimization. The regimes consisted of different combinations of forest sites, planting densities, thinning regimes and clearcutting ages, totaling 17,760 regimes per site. Wood production was quantified and evaluated by assortment classes. Planting, thinning and harvesting costs were considered. The Annualized Net Present Value (ANPV) and the Internal Rate of Return (IRR) of each management regime were calculated. As a result, the density of 1,600 plants per ha optimized ANPV for most cases. Optimized regimes included no or only one thinning and provided ANPV of 2,753 and 158 BRL per ha and IRR of 22.9% and 2.9% for sites I and IV, respectively. It was concluded that the optimal number of thinning is reduced in lower quality sites, and the less productive the site, the later the optimal year for clear cutting. The attractiveness rate is a parameter that contributes to the selection of thinning regimes, because the larger the rate, the larger the number of thinning and the earlier they should be carried out.
Keywords: operational research; annualized net present value; attractiveness rate; forest site; log assortment. Hassan Camil David2*, Julio Eduardo Arce2, Edilson Batista de Oliveira3, Sylvio Péllico Netto2,
Rodrigo Otávio Veiga de Miranda2, Ângelo Augusto Ebling2
10.1590/0034-737X201764030002
Análise econômica e otimização da receita em regimes de manejo de
Pinus taeda
L.
Este trabalho teve por objetivo selecionar, por meio de técnicas da pesquisa operacional, regimes de manejo de Pinus taeda L. que maximizem a receita com a madeira produzida, considerando diferentes taxas de atratividade. Foi utilizado o software OpTimber–LP® para a otimização florestal, o qual realiza as simulações por meio do software SisPinus®. Os regimes foram compostos por diferentes combinações de sítios florestais, densidades de plantio, regimes de desbaste e idades para corte raso, totalizando 17.760 regimes por sítio. A produção de madeira foi quantificada e valorada mediante classes de sortimento. Custos de plantio, desbaste e colheita foram considerados. O Valor Presente Líquido Anualizado (VPLA) e a Taxa Interna de Retorno (TIR) de cada regime de manejo foram calculados. Como resultado, a densidade de 1.600 plantas por ha otimizou o VPLA para a maioria dos casos. Os regimes otimizados incluíram nenhum ou apenas um desbaste e forneceram VPLA de 2.753 e 158 reais por ha e TIR de 22,9% e 2,9%, para os sítios I e IV, respectivamente. Concluiu-se que o número ideal de desbastes é reduzido em sítios com qualidade inferior, e quanto menos produtivo for o sítio, mais tardio será o ano ideal para o corte raso. A taxa de atratividade é um parâmetro que contribui para a determinação de regimes de desbaste, pois quanto maior for essa taxa, maior deve ser o número de desbastes, bem como mais precoces devem ser suas aplicações.INTRODUCTION
The quest for excellence in strategic and operational planning of forest-based enterprises often makes forest management a challenging art. One of the challenges is to optimize productivity without increasing the expenditure of the resources involved in the production chain.
In addition to technical issues, forest production variables include market factors such as attractiveness rate, supply, demand, and price of wood, which participate in management decisions, especially when forests are planted for maximum profitability such as Pinus spp. plantations to produce logs (Gomes et al., 2002, Jones et al., 2010).
Inadequate decisions can make a forestry project economically unfeasible (David, 2014), taking as example the thinning carried out during the period of stand growth stagnation. The thinning regime is defined by the form, quantity and time of tree removal from the stand. The time of clearcutting should also be a technical or economically viable decision, depending on its growth and stock (Silva et al., 2005).
The combinations of these and other variables represent the possible forest management regimes, which are different in growth and production when subjected to different management practices (Soalleiro et al., 2000, Palahí & Pukkala, 2003, Pukkala & Miina, 2013). The interaction of these variables converges to a complex problem, especially when economic variables are included such as minimal attractiveness rate, production cost and wood price.
It is often possible to obtain optimal solutions mathematically solved via computational systems. In this scope, algorithms are powerful tools in the process of objective function optimization such as those presented by Soares et al. (2003), Palahí & Pukkala (2003), Arce et al. (2004), Mello et al. (2005), Gomide et al. (2010), among others. The objectives of this study were to make an economic analysis of management regimes and to find, through operational research techniques, the best practices of forest management in order to maximize the revenue obtained from the harvesting of wood in Pinus taeda stands in southern Brazil.
MATERIAL AND METHODS
This study was conducted using the OpTimber-LP® software from OpTimber Otimização e Informática Ltda. This software has linked the SisPinus® software - a simulator of prognosis of Pinus spp. in southern Brazil, developed by Embrapa Florestas (Oliveira, 1995) - to its system and, LINGO® software which is used to optimize linear and non-linear programming problems, developed by LINDO Systems INC. Management regimes were simulated for Pinus taeda L., which are different in relation to initial planting densities, thinning regimes, and clearcutting ages.
Management practices
The planting densities used in the study were as follows: 2500 plants/ha (2,0 x 2,0 m); 2000 plants/ha (2.5 x 2.0 m); 1600 plants/ha (2.5 x 2.5 m); 1111 plants/ha (3.0 x 3.0 m).
Management regimes were simulated with or without thinning. Thinning varied in number, and the regimes could be subjected to one, two or three thinning, which could be carried out between 7 and 9 years, 13 and 15 years and 18 an 20 years of age.
In management regimes with more than one thinning, the first one was mixed, systematic and from below (German thinning). In the systematic thinning, one in five of the planting lines was removed and the thinning from below was simulated by removing 30%, 45% or 60% of the lower canopy trees, corresponding to 70%, 55% and 40% of remaining trees, respectively. The other thinning carried out also were from below.
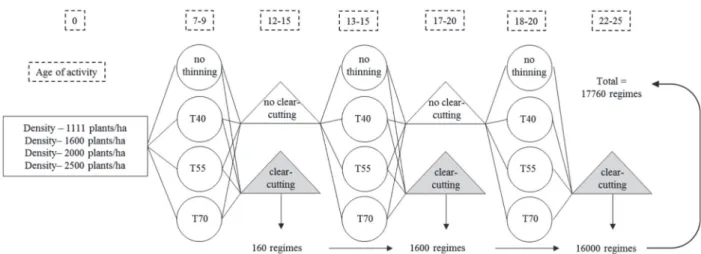
The times established for clearcutting were 12 to 15 years, 17 to 20 years and 22 to 25 years of age. The management regimes subject to thinning at ages that would occur after the clearcutting are infeasible and therefore have been erased from the system. Figure 1 shows the organization chart of the simulations of management regi-mes including all variables considered.
The number of simulations is the result of an arrangement of possible combinations. For example, the number of clearcutting simulations in the time 12 to 15 years corresponds to 160 regimes (Figure 1), since there is a combination of 3 thinning intensities in 3 different years, in addition to 1 regime without thinning, which results in 10 regimes (3 x 3 + 1). These 10 regimes also vary in 4 planting densities, resulting in 40 simulations. Finally, these 40 regimes could be clearcut in 4 different years, that is, from 12 to 15 years, totaling 160 regimes. The reasoning is the same for the other clearcutting times.
The regimes simulated between 17 and 20 years totaled 1600 possibilities, because in this case the simulations involved up to two thinning and not only up to one, as in the previous case. However, the clearcutting regimes between 22 and 25 years had up to three thinnings, therefore the total was 16,000 regimes. Thus, the arrangement involved 17,760 management regimes for each site, i.e., 71,040 regimes in total.
The forest sites were defined by the equation:
error of the estimate equal to 13.8% and coefficient of determination adjusted of 0.79.
The four site indices (SI), with reference age at year 15, corresponded to the dominant heights of: 27.8 m (SI I); 23.3 m (SI II); 18.8 m (SI III); and 14.3 m (SI IV).
Log Assortment and Valuation
One of the variables provided by the software SisPinus® is volume per assortment, which allows us to include in the calculation the log volume produced by the clearcutting and thinning. Thus, the logs corresponding to the 71,040 management regimes were classified and valuated according to the assortments in Table 1.
The dimensions and prices of the assortments S1, S2, S3 and S4 were adopted according to the Secretariat of Agriculture and Supply (SEAB) for the third quarter of 2013 and for S5, a market research was carried out by the company Brasil Florestal Engenharia de Projetos, also in the year 2013. The prices correspond to the products placed in the industry.
Economic analysis
The methods of economic evaluation used consider the variation in capital with time, since the management regimes vary with time and the decapitalization is elementary when one wants to compare them (Silva et al., 2005). Thus, the
Net Present Value (NPV), the Annualized Net Present Value (ANPV), and the Internal Rate of Return (IRR) were used.
According to Dossa et al. (2000), the Annualized Net Present Value is used in medium and long term projects such as the cultivation of perennial crops. The ANPV (2) transforms the NPV (1) of a cash flow into a uniform annual series.
The Internal Rate of Return (IRR) (3) was also calculated, which reflects the discount rate obtained when the present value of the revenues is equal to the present value of the costs, hence, when the NPV equals zero (Silva et al., 2005).
(1)
(2)
(3)
Where: ANPV = annualized net present value; NPV = net present value; Rj = present value of revenues; Cj = present value of costs; I = annual attractiveness rate; j = year in which revenues or costs occur; and n = number of project periods in years.
A sensitivity analysis for the simulated regimes was also performed. In order to calculate NPV and ANPV, five
Table 1: Dimensions and price of logs by assortment
Diameter (cm) Minor Major
S1* Veneer 141.4 2.5 35.1
-S2* Sawmill 3 129.6 2.5 25.1 35.0
S3* Sawmill 2 100.9 2.5 18.1 25.0
S4* Sawmill 1 70.4 2.4 8.1 18.0
S5** Residue 8.0 1.0 5.0 8.0
Source: *SEAB (2013) and **Brasil Florestal Engenharia de Projetos (2013).
Assortment Use Price (R$/m³) Lenght (m)
attractiveness rates commonly used in forestry projects were chosen: 8%, 9%, 10%, 11% and 12% per year (Lima Jr et al., 1997). This sensitivity analysis was performed to obtain the behavior of the best management regimes, when variation in interest occurs.
Production costs
This study used average costs of pine production used in southern Brazil. The research was carried out by the company Brasil Florestal, in 2013, surveying forest companies that produce Pinus spp in Paraná and Santa Catarina. The costs per activity can be seen in Table 2.
Planting costs were calculated by adding the expenditures of manual pre- and post-planting herbicide applications, pre- and post-planting ant control, planting itself, and replanting. The costs of mechanized harvesting and loading were considered for the thinning and clearcutting costs.
RESULTS AND DISCUSSION
Economic analysis and behavior of regimes
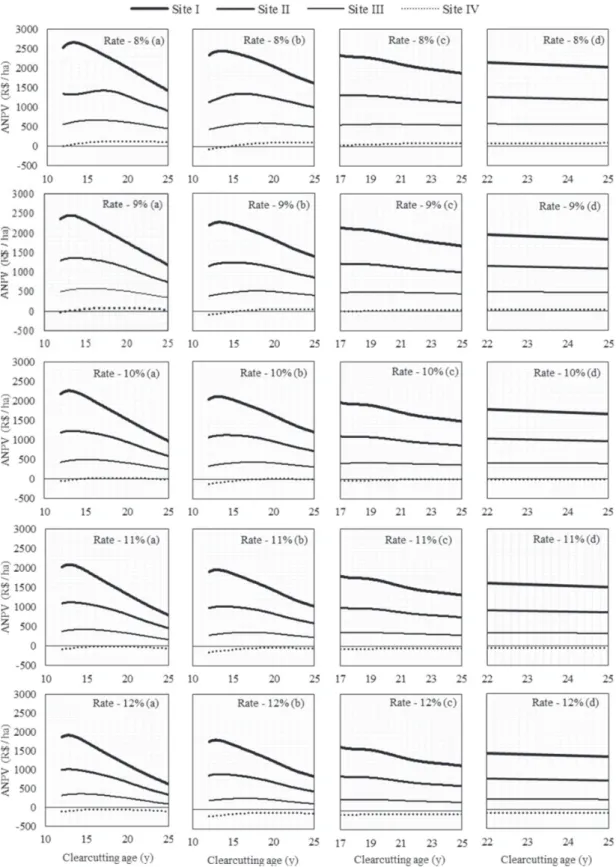
Figure 2 shows the ANPV average behavior of all regi-mes. The charts were separated by number of thinnings, which could vary from zero to three (variation from (a) to (d) in the charts), as well as by attractiveness rates (verti-cal variation), which was 8% to 12% per year.
Figure 2 shows that ANPV varied according to site quality and clearcutting age. The highest ANPV values were achieved earlier in more productive sites compared to those less productive, which showed delayed optimal age for clearcutting.
The increase in the attractiveness rate led to a reduction in the baseline of the mean ANPV lines. This condition was also reported by Cotta et al. (2006), in an economic analysis of a mixed forest stand.
The most productive sites were more sensitive to the number of thinnings compared to the less productive ones. This shows that the lack of thinnings in more productive sites considerably reduces ANPV with the advancement of the stand age, which was also reported by Scolforo et al. (2001) in simulations of management regimes of Pinus taeda in the state of Paraná.
The regimes without thinning and one thinning, at sites I and II, had the highest ANPV between years 12 and 15, being this period indicated for clearcutting in managements not aiming at the production of thick logs.
Regimes in these two sites with two thinnings reached the highest ANPV values, with clearcutting age between 17 and 19 years. In regimes with three thinnings, the optimal age for clearcutting was 22 years for site index I and between 22 and 25 years for site index II.
For the sites with the lowest productive capacity, the average behavior of ANPV was relatively stable, including non-thinned regimes up to those with three thinnings, in which this ratio was proportional at all attractiveness rates. The highest values of ANPV in the regimes at site III were reached at ages between 15 and 17 years, in which thinning is not recommended, except when the regime is extended to 20 years, in which one thinning is recommended. The ANPV of the regimes with more than one thinning suggested no differences with clearcutting after 17 years.
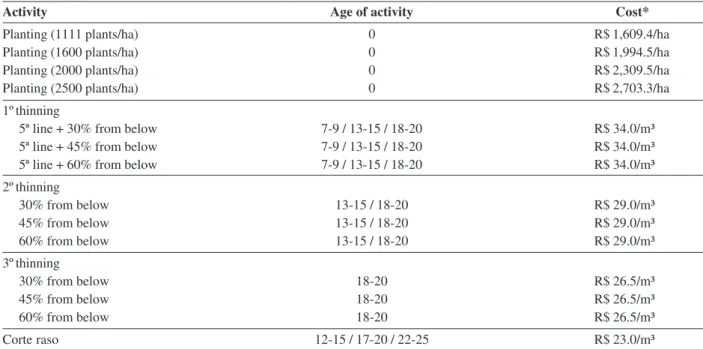
Table 2: Costs of silvicultural activities of Pinus taeda, for the year 2013
Activity Age of activity Cost*
Planting (1111 plants/ha) 0 R$ 1,609.4/ha
Planting (1600 plants/ha) 0 R$ 1,994.5/ha
Planting (2000 plants/ha) 0 R$ 2,309.5/ha
Planting (2500 plants/ha) 0 R$ 2,703.3/ha
1º thinning
5ª line + 30% from below 7-9 / 13-15 / 18-20 R$ 34.0/m³ 5ª line + 45% from below 7-9 / 13-15 / 18-20 R$ 34.0/m³ 5ª line + 60% from below 7-9 / 13-15 / 18-20 R$ 34.0/m³ 2º thinning
30% from below 13-15 / 18-20 R$ 29.0/m³
45% from below 13-15 / 18-20 R$ 29.0/m³
60% from below 13-15 / 18-20 R$ 29.0/m³
3º thinning
30% from below 18-20 R$ 26.5/m³
45% from below 18-20 R$ 26.5/m³
60% from below 18-20 R$ 26.5/m³
Corte raso 12-15 / 17-20 / 22-25 R$ 23.0/m³
Figure 2: Average behavior of the Annual Net Present Value (ANPV) with variation in attractiveness rate and site index for scenarios of Pinus taeda without thinning (a) and with one (b), two (c) and three (d) thinnings.
Regimes at site IV were economically unfeasible at attractiveness rates above 9%. This was also found by Acerbi Jr et al. (2002), in an economic analysis of Pinus taeda stands in the state of Paraná. In all simulations for site IV, optimal ANPV values were reached between 22
and 25 years, confirming the delay of less productive sites in achieving higher profitability.
or near those regimes with more thinnings, allowing the non-recommendation of more than one thinning, even for old stands.
Revenue Optimization and Sensitivity Analysis
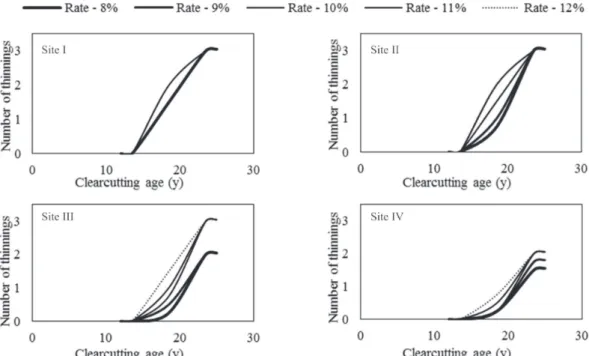
Figure 3 shows the thinning requirements considering the variation in the site and in the attractiveness rate. The charts correspond to the optimal regimes, whose mean number of thinning was related to the clearcutting age.
In order to maximize ANPV, Figure 3 indicates that, in addition to site quality, the attractiveness rate is also closely related to the determination of thinning regimes. Although this relationship has been variable per site, overall, the higher the attractiveness rate, the greater the need for thinning.
This fact occurred due to the increase in the attractiveness rate, causing a greater depreciation of the wood value over time (Lima Jr et al., 1997; Liao & Zhang, 2008), leading optimum regimes to require more thinnings and to be carried out as soon as possible.
Specifically for site I, the relationship between the number of thinning was the most similar, indicating that in superior sites the need for thinning is high enough to make the attractiveness rate unimportant in the analysis. In this site, only the conditions with indices of 11% and 12% a year differed from the others.
In site II, this relationship was significantly different in relation to the optimal number of thinnings, which is greater with the increase in the attractiveness rate. However, the amount of three thinnings was the same for regimes with clearcutting at 25 years.
Sites III and IV had the greatest variation in the mean number of thinnings, mainly for regimes up to 25 years, showing that the attractiveness rate is much more relevant to the worst sites, when determining thinning regimes. Scolforo et al. (2001) analyzed the number of thinnings in relation to the site productive potential and recommended regimes with less thinnings for inferior sites.
As discussed above, regimes at site IV managed after
20 years showed no significant differences for ANPV when one or more thinnings were carried out. This justifies the need for up to two thinnings, considering attractiveness rates lower than 9% per year (Figure 3), which makes this choice dependent on other factors, such as cash flow and market demand for wood (David, 2014).
It is evident that these results correspond to mixed thinning (systematic and from below) and thinning from below, as proposed in the methodology. However, when evaluating strategies for thinning pine, Pelkki (1997) reported that thinning from below is a good option for stocked stands, except that it provides a reduction in forest rotation age.
Figure 4 shows the optimal clearcutting ages in the regimes that provided the highest ANPV, considering the variation in the attractiveness rate and site index. These ages have been shown as optimal.
In Figure 4, a previously found behavior is shown, in which the optimal ages for the clearcutting tend to be postponed as site quality is reduced, a fact also observed by Broderick et al. (1992) in an economic analysis of Pinus taeda plantations in the United States.
There was little variation in the clearcutting age between the different attractiveness rates. For site I, the optimal age was between 12 and 13 years; for site II, between 13 and 15 years; for site III, between 15 and 16 years; and finally for site IV, the ages ranged from 22 years (attractiveness rate of 8%) to 25 years (other indices).
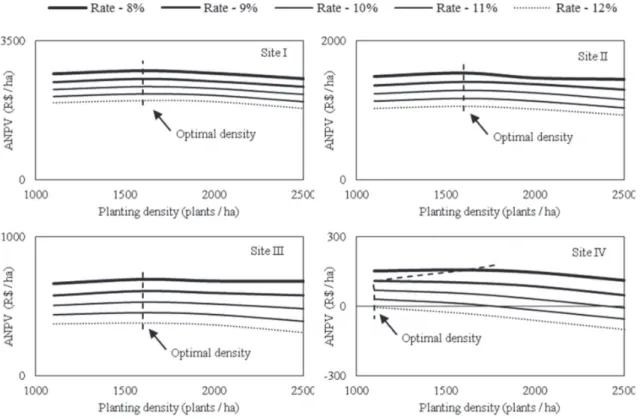
Figure 5 shows the optimum planting densities and respective ANPV values. The density of 1600 plants per ha was the best option, except for regimes in site IV and indices higher than 8%, in which the optimum density of 1111 plants per ha stood out, being also recommended by Pelkki (1997) and Broderick et al . (1992) for pinus stands in the United States with productive capacities close to those of site IV, as well as by Scolforo et al. (2001) in simulations of Pinus taeda.
In all cases, the ANPV shows a decrease from a maximum point, as observed by Broderick et al. (1992), however, these authors pointed to the maximum revenues in regi-mes with approximately 1100 plants per ha, whereas in this study, the density was predominantly 1600 plants per ha. This optimum density obtained for most simulated scenarios differs from that recommended by Scolforo et al. (2001) and Acerbi Jr et al. (2002), in simulations of management regimes of Pinus taeda.
Based on economic analysis, Scolforo et al. (2001) concluded that the density of 833 plants per ha was optimal for maximizing profit. However, the effect of the inequality between the prices and costs of production used in both studies allows no reliable comparisons. The same was observed by Acerbi Jr et al. (2002), who obtained results
similar to those of Scolforo et al. (2001) by employing simi-lar prices and costs of production.
However, a denser planting was recommended by Go-mes et al. (2002), indicating 2000 plants per ha for the regi-mes subjected up to one thinning. Planting densities close to 1600 plants per ha were used by Floriano et al. (2009) and Folmann et al. (2014), who pointed out that such spacings are the most used currently.
Conrad III et al. (1992) explained that, in an economic analysis of stands that includes log valuation, the reduction in revenue from the planting densification is mainly due to the inhibition of radial growth of the trees, leading to the lower production of thick wood and of higher added value. Thus, the highest volume obtained in very dense stands does not exceed the high revenue obtained in less dense stands that produce thick wood.
Optimal and Alternative Regimes
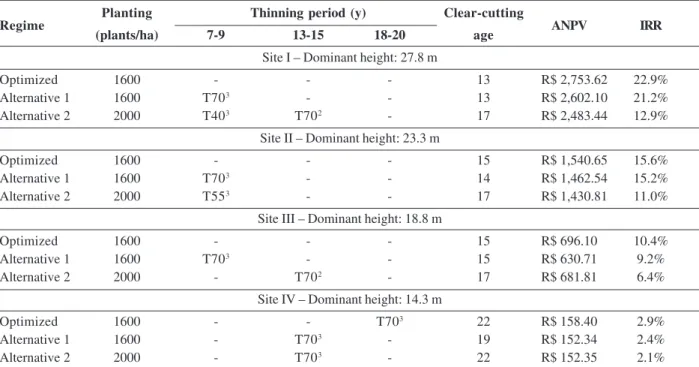
Table 3 shows the optimal and alternative regimes for each forest site that stood out in relation to attractiveness rates. It also shows the Annualized Net Present Value (ANPV) calculated with an attractiveness rate of 8% per annum, as well as the Internal Rate of Return (IRR) for each of the regimes assessed.
It was expected and it was found higher values of ANPV and IRR for the most productive sites. A similar result was obtained by Floriano et al. (2009) in economic analysis involving seven classes of pine sites, which
obtained a maximum IRR of 11.4%, considerably lower than that found in the present study, probably because the authors took into account more costs involved in the production. Although in the current study other costs pertinent to forest production were not considered, because ANPV is a method of evaluation that considers capital in time, in order to add annual costs, it is enough to subtract these from the total value of the ANPV.
The IRR values indicated that the regimes simulated in the site IV are economically viable, but did not exceed even the return provided by the savings rate, which is currently close to 6.5% per year.
The IRR ranged from 11 to 22.9% in the sites I and II. Similar results were reported by Malinovski et al. (2006), in economic analysis of pinus in small farms located in the state of Paraná, who found IRR values between 16 and 17% and by Berger et al. (2011), in an analysis of the economic profitability of Pinus spp production in the mesoregions of the state of Paraná. On the other hand, Vitale & Miranda (2010) found IRR values higher than the present study, reaching 27.2% for Pinus taeda stands in the state of Paraná.
Table 3 also shows the decrease in IRR with the increase in the rotation age. This behavior was also reported by Spathelf & Seling (2000). Because of this behavior, it is sensible to consider complementary methods of evaluation. Based on ANPV and IRR values, the best alternatives were the optimized scenarios, in all the sites, using only
one thinning for site IV, at the age 18 to 20 years. However, these regimes considered optimal may not represent the best management options, because these simulations were based on hypothetical situations, disregarding, for example, the occurrence of pests, diseases and fires.
Penteado et al. (2000) and Rocha (2000) discussed that this is important, because thinning Pinus spp. stands works as a control measure for pests such as the woodwasp (Sirex noctilio F.) and Cebus apella Linnaeus, as well as forest fires. For this reason, alternative regimes were proposed, in which all of them comprised at least one thinning. These alternative regimes presented one of the highest values of ANPV and IRR, considering all five attractiveness rates analyzed.
CONCLUSIONS
This study indicated that some management practices lead to maximization of the Annualized Net Present Value (ANPV), which are:
The initial density of 1600 plants per ha is optimal for all sites and attractiveness rates, except for regimes of site IV with indices of 9%, 10%, 11% and 12% per year, in which the best planting density is 1111 plants per ha.
The optimal number of thinnings decreases with the reduction in site quality.
The attractiveness rate has no influence on the determination of the clearcutting age. However, it is an
important parameter for determination of thinning regimes, in which the larger the rate, the larger the number of thinnings should be, and these should be applied as soon as possible.
The site also influences the optimal age for the clearcutting, because the less productive the site, the later the rotation, while very productive sites generate an early return of maximum ANPV.
REFERENCES
Acerbi Jr FW, Scolforo JRS, Oliveira AD & Maestri R (2002) Modelo para prognose do crescimento e da produção e análise econômica de regimes de manejo para Pinus taeda L. Revista Árvore, 26:699-713.
Arce JE, Macdonagh P & Friedl RA (2004) Geração de padrões ótimos de corte através de algoritmos de traçamento aplicados a fustes individuais. Revista Árvore, 28:207-217.
Berger R, Timofeiczyk Jr R, Santos AJ, Bittencourt AM, Souza VS, Eisfeld CL & Polz WB (2011) Rentabilidade econômica da produção de Pinus spp. por mesorregião homogênea no estado do Paraná. Revista Floresta, 41:161-168.
Broderick SH, Thurmes JF & Klemperer WD (1992) Southern Journal of Applied Forestry, 16:186-193.
Conrad III LW, Straka TJ & Watson WF (1992) Economic evaluation of initial spacing for a 30-year-old unthinned Loblolly Pine plantation. SJAF, 16:89-93.
Cotta MK, Jacovine LAG, Valverde SR, Paiva HN, Virgens Filho AC & Silva ML (2006) Análise econômica do consórcio serin-gueira-cacau para geração de certificados de emissões reduzidas. Revista Árvore, 30:969-979.
Table 3: Optimal and alternative management regimes aiming to maximize the Annualized Net Present Value of Pinus taeda in four forest sites, for the year 2013
Planting Thinning period (y) Clear-cutting (plants/ha) 7-9 13-15 18-20 age
Site I – Dominant height: 27.8 m
Optimized 1600 - - - 13 R$ 2,753.62 22.9%
Alternative 1 1600 T703 - - 13 R$ 2,602.10 21.2%
Alternative 2 2000 T403 T702 - 17 R$ 2,483.44 12.9%
Site II – Dominant height: 23.3 m
Optimized 1600 - - - 15 R$ 1,540.65 15.6%
Alternative 1 1600 T703 - - 14 R$ 1,462.54 15.2%
Alternative 2 2000 T553 - - 17 R$ 1,430.81 11.0%
Site III – Dominant height: 18.8 m
Optimized 1600 - - - 15 R$ 696.10 10.4%
Alternative 1 1600 T703 - - 15 R$ 630.71 9.2%
Alternative 2 2000 - T702 - 17 R$ 681.81 6.4%
Site IV – Dominant height: 14.3 m
Optimized 1600 - - T703 22 R$ 158.40 2.9%
Alternative 1 1600 - T703 - 19 R$ 152.34 2.4%
Alternative 2 2000 - T703 - 22 R$ 152.35 2.1%
ANPV: annualized net present value (R$/ha) calculated at a rate of 8% per year; IRR: internal rate of return; T40, T55 and T70: Thinning from below with 40%, 55% and 70% of remaining trees, respectively. Superscript 1, 2 and 3: first, second and third year of the period.
David HC (2014) Avaliação de sítio, relações dendrométricas e otimização de regimes de manejo de Pinus taeda L. nos estados do Paraná e de Santa Catarina. Dissertação de Mestrado. Uni-versidade Federal do Paraná, Curitiba. 152p.
Dossa D, Conto AJ, Rodigheri H & Hoeflich VA (2000) Aplicativo com análise de rentabilidade para sistemas de produção de flo-restas cultivadas e grãos. Colombo, Embrapa Floflo-restas. 56p.
Floriano EP, Schneider PR, Finger CAG & Fleig FD (2009) Análi-se econômica da produção de Pinus elliottii na serra do Sudeste, Rio Grande do Sul. Ciência Florestal, 19:393-406.
Folmann WT, Miranda GM, Dias AN, Moro FC & Fernandez MLQ (2014) Viabilidade de projetos florestais em três regimes de manejo na mesorregião Centro-Oriental do Paraná. Revista Floresta, 44:153-160.
Gomes FS, Sanquetta CR, Scolforo JRS, Graça LR & Maestri R (2002) Efeitos do sítio e de cenários de custos e preços na análise de regimes de manejo com e sem desbaste em Pinus taeda L. Revista Cerne, 8:13-31.
Gomide LR, Arce JE & Silva AL (2010) Efeito das restrições espaciais de adjacência no planejamento florestal otimizado. Revista Floresta, 40:573-584.
Jones PD, Grado SC & Demarais S (2010) Financial analysis of intensive pine plantation establishment. Journal of Forest Economics, 16:101-112.
Liao X & Zhang Y (2008) Economic impacts of shifting sloping farm lands to alternative uses. Agricultural Systems, 97:48-55. Lima Jr, Rezende JLP & Oliveira AD (1997) Determinação da taxa de desconto a ser usada na análise econômica de projetos florestais. Revista Cerne, 1:45-66.
Malinovski RA, Berger R, Silva IC, Malinovski RA & Barreiros RM (2006) Viabilidade econômica de reflorestamentos em áre-as limítrofes de pequenáre-as propriedades rurais no município de São José dos Pinhais – PR. Revista Floresta, 36:261-274.
Mello AA, Carnieri C, Arce JE & Sanquetta CR (2005) Planeja-mento florestal visando à maximização dos lucros e a manuten-ção do estoque de carbono. Revista Cerne, 11:205-217.
Oliveira EB (1995) Um sistema computadorizado de prognose do crescimento e produção de Pinus taeda L., com critérios quan-titativos para a avaliação técnica e econômica de regimes de manejo. Tese de Doutorado. Universidade Federal do Paraná, Curitiba. 134p.
Palahí M & Pukkala T (2003) Optimising the management of Scots pine (Pinus sylvestris L.) stands in Spain based on indivi-dual-tree models. Annals of Forest Science, 60:105-114.
Pelkki MH (1997) Optimal timber management for shortleaf pine in the Central United States. Northern Journal of Applied Forestry, 14:67-71.
Penteado SRC, Oliveira EB & Iede ET (2000) Distribuição da vespa-da-madeira e de seus inimigos naturais ao longo do tron-co de pinus. Boletim de Pesquisa Florestal, 40:23-34.
Pukkala T & Miina J (2013) Tree-selection algorithms for optimizing thinning using a distance-dependent growth model. Canadian Journal of Forest Research, 43:719-730.
Rocha VJ (2000) Macaco-prego, como controlar esta nova praga florestal? Revista Floresta, 30:95-99.
Scolforo JRS, Acerbi Jr FW, Oliveira AD & Maestri R (2001) Simulação e avaliação econômica de regimes de desbastes e desrama para obter madeira de Pinus taeda livre de nós. Ciência Florestal, 11:121-139.
Silva ML, Jacovine LAG & Valverde SR (2005) Economia flores-tal. 2ª ed. Viçosa, UFV. 178p.
Soalleiro RR, Álvarez Gonzalez JG & Schröder J (2000) Simulation and comparison of silvicultural alternatives for even-aged Pinus pinaster Ait stands in Galicia (Northwestern Spain). Annals of Forest Science, 57:747-754.
Soares TS, Vale AB, Leite HG & Machado CC (2003) Otimização de multiprodutos em povoamentos florestais. Revista Árvore, 27:811-820.
Spathelf P & Seling I (2000) Efeitos econômicos de diferentes programas de desbaste em povoamentos de Pinus elliottii. Ciên-cia Florestal, 10:21-44.
Vitale V & Miranda GM (2010) Análise comparativa da viabilida-de econômica viabilida-de plantios viabilida-de Pinus taeda E Eucalyptus dunnii