PRODUCTION COSTS AND FRUIT YIELD PROFITABILITY IN THE INITIAL
HARVESTS OF CUSTARD APPLE TREES
1FREDERICO SILVA THÉ PONTES 2, JÚLIO CÉSAR DO VALE SILVA3,
PAULO SÉRGIO LIMA E SILVA4, ANA KATARINA OLIVEIRA ARAGÃO5
ABSTRACT – The aim of this study was to estimate the production cost and economic indicators associated with the production and sales of fruits from 20 custard apple progenies during the initial five harvests, in order to identify the harvest season from which custard apple exploitation becomes profitable, as well as the most promising progenies from an economic point of view. The fruit yield data upon which the present work was based were obtained during the period from 2001 to 2005, in an experiment that evaluated 20 custard apple half-sibling progenies, under sprinkler irrigation. The progenies were evaluated in a random block design with five replicates and plots consisting of four plants each. The exploitation of custard apple progenies only showed to be a profitable agribusiness after the fourth year. Before that, only A3 and A4 progenies in the second year, and P3 and P11 in the third year provided profitable incomes. Considering the methodological assumptions imposed concerning the time period analysis and the prices as of July 2007, the most important profitability indicators (operating profit, return index and equilibrium price) evidenced that the A4 progeny is the most recommended, although other progenies are also highlighted, such as FJ1 and FJ2. As already discussed, the progenies showing the highest average yields of five harvests are not always the most economically recommendable ones. Index terms: Annona squamosa L., progenies, custard apple, sweetsop, bullock’s heart, cost-effectiveness.
CUSTO DE PRODUÇÃO E LUCRATIVIDADE DA PRODUÇÃO DE FRUTOS DE PINHEIRAS
NAS PRIMEIRAS SAFRAS
RESUMO - O presente trabalho tem como objetivo estimar o custo de produção e indicadores econômicos, relativos à produção e comercialização de frutos de 20 progênies de pinheiras, nas cinco primeiras safras, visando a identificar a safra a partir da qual a exploração da pinheira é lucrativa e as progênies mais promissoras, do ponto de vista econômico. Os dados de rendimentos de frutos em que se baseou o presente trabalho, foram obtidos no período de 2001 a 2005, em um experimento de avaliação de 20 progênies de meias-irmãs de pinheira, com irrigação por aspersão. As progênies foram avaliadas no delineamento de blocos aleatorizados, com cinco repetições e parcelas de quatro plantas. A exploração das progênies de pinheiras somente mostrou-se lucrativa a partir do quarto ano. Antes disso, somente as progênies A3 e A4, no segundo ano, e P3 e P11, no terceiro ano, geraram lucros satisfatórios. Nas pressuposições impostas na metodologia, com respeito ao período de análise temporal e aos preços tomados para julho de 2007, os mais importantes indicadores da lucratividade (lucro operacional, índice de rentabilidade e preço de equilíbrio) indicaram que a progênie A4 é a recomendada, embora outras progênies (FJ1 e FJ2) também tenham-se destacado. Nem sempre as progênies que apresentaram maior rendimento médio de frutos, nas cinco safras, são também as mais recomendáveis economicamente.
Termos para indexação: Annona squamosa L., progênies, ateira, fruta-do-conde, ata, economicidade.
1(Paper 277-07). Received: 21-11-2007. Accepted for publication: 12-09-2008.
2Associate Professor, Universidade Federal Rural do Semi-Árido (UFERSA), Dep. Agrotecnologia e Ciências Sociais, Br-110, km 47, Bairro Pres. Costa
e Silva, CEP 59625-900 Mossoró-RN, Brazil. E-mail: [email protected]
3Master’s student, Universidade Federal de Viçosa (UFV). E-mail: [email protected]
4Associate Professor, UFERSA, Dep. Ciências Vegetais, Br-110, km 47, Bairro Pres. Costa e Silva, CEP 59625-900 Mossoró-RN, Brazil. E-mail:
[email protected]. CNPq Fellow. (Corresponding author)
5Agronomy undergraduate student at UFERSA. E-mail: [email protected]
INTRODUCTION
Fruit crop irrigation is one of the most important agricultural activities in the Agricultural Center of Mossoró-Assu, Rio Grande do Norte, Brazil, where the melon plant (Cucumis melo L.) is the predominant crop. There has been an increasing interest by fruit growers in the cultivation of new species. Melon plants are generally grown in the second semester and it is desirable that farmers retain laborers who were hired to work on the crop; monoculture is causing serious disease and pest problems, and there is a demand by importing markets for a greater variety of tropical fruits. Furthermore, the exploitation of a small number of species leaves the farmer vulnerable to market
oscillations.
Among fruit trees that became interesting to fruit growers, the custard apple tree (Annona squamosa L.) should be highlighted since it is well adapted to the conditions of the Semi-Arid Region (Maia et al., 1986) and because it yields fruits with a very sweet and fragrant pulp, and a pleasant and exotic flavor, considered the most desirable characteristics of custard apple.
unanswered. For example, it is interesting to know the custard apple production season from which fruit sales become economic, since fruit yield tends to increase as plants grow older. Profitability analyses on the exploitation of fruit trees show that this is an advantageous enterprise with many species (Pires et al., 2004; Petinari & Tarsitano, 2002; Silva et al., 2004; Zonetti et al., 2002;) including custard apple (Pelinson et al., 2005). In most studies, economic assessment is done in relation to the economic viability of cultural practices (Ebert and Kreuz, 1988; Kreuz et al., 2002; Lima et al., 2005; Zonetti et al., 2002). Nevertheless, no references could be found in the consulted literature about genotypes. Other studies deal with the numbers of fruits sold (Fagundes & Yamanishi, 2001), price seasonality (Morgado et al., 2004), and losses observed during trade (Silva et al., 2003), including those verified for custard apple trees.
The aim of this study was to estimate the production cost and economic indicators associated with the production and sales of fruits from 20 custard apple progenies during the initial five harvests, in order to identify the harvest season from which custard apple exploitation becomes profitable, as well as the most promising progenies from an economic point of view.
MATERIAL AND METHODS
The fruit yield data upon which the present work was based were obtained during the period from 2001 to 2005, in an experiment that evaluated 20 custard apple half-sibling progenies, under sprinkler irrigation. The following progenies were evaluated: Mossoró/M, Aracati 2/A2, Aracati 3/A3, Aracati 4/ A4, Aracati 5/A5, Aracati 6/A6, Fazenda Experimental 1/FE1, Fazenda Experimental 3/FE3, Fazenda Experimental 4/FE4, Fazenda Experimental 5/FE5, Francisca Jales 1/FJ1, Francisca Jales 2/FJ2, João Gerônimo 1/JG1, João Gerônimo 2/JG2, João Gerônimo3/JG3, João Gerônimo 3/JG3, João Gerônimo 4/JG4, Serra do Mel 1/SM1, Serra do Mel 3/SM3, Serra do Mel 7/SM7 and Serra do Mel 8/SM8. The progenies were identified according to the initial letters of their native places, that is: M = Mossoró city, State of Rio-Grande-do-Norte (RN); A = Ema Brandl’s ranch, at Aracati town, State of Ceará (CE); FE = UFERSA Experimental Farm, Mossoró, RN; FJ = Francisca Jales’ ranch, Mossoró, RN; JJ= João Jerônimo’s ranch, Mossoró, RN; SM = town of Serra-do-Mel, RN. The planting pits were opened in October/00, measuring 60 cm × 60 cm × 60 cm, at a spacing of 5.0 m × 4.5 m. The progenies were evaluated in a random block design with five replicates and plots consisting of four plants each. More details on the agronomic evaluation of the progenies are presented in another study (Silva et al., 2007). Service prices were estimated based on the daily wage value paid to field workers as of July, 2007. Prices of materials represent average prices provided by stores that sell livestock and farming products. As to irrigation, the computed value represented the amount of energy spent per year (1,098.74 kW hour-1). Agrochemicals costs
were not considerated since these products were not applied
during the experimental period. Fruit prices were those that local supermarkets were willing to pay in the considered month.
Production costs were calculated based on the economic costs of fixed and variable production factors, as well as on operating costs (Reis, 2002). In other words, calculations included: effective operating cost (COpE), which is the sum of input and operations expenses; total variable operating cost (COpVT), which is the sum between COpE and other expenses incurred during the experiment, such as transport of the production (the orchard production transport to the property main entrance), food and lodging for workers, and so on (evaluated based on 5% of one half of COpE); total fixed operating cost (COpFT), which represents rural tax expenses (ITR), depreciation (of the irrigation system) and land leasehold; total operating cost (COpT), which is the sum between total fixed and variable operating costs; opportunity or alternative cost (CO), which corresponds to the best alternative use of the entrepreneur’s capital and time, and was calculated based on a 12% APR applied to one half of the financial resources value spent on fixed1 and variable costs. The interest rate selected to
calculate the alternative cost must be equal to the return rate of the best alternative application (Leite, 1988). Since this value cannot be determined, we decided to use the selic rate, which is considered the economy’s basic interest rate and reflects on the average profitability of the economy’s production activities. The interest rate for July 2007, applicable when charging, returning, or compensating federal taxes and contributions, starting in August 2007, is 0.97%, i.e., approximately 12% APR. (Receita Federal, 2007).
Total variable costs (CVT) correspond to COpVT plus the alternative costs for the variable factors; similarly, total fixed costs (CFT) correspond to COpFT plus the alternative costs derived from the fixed factors.
Costs were calculated by means of cross sections in time, in which fixed capital, such as machinery and equipment, participate in the form of flow (depreciation), not in the form of stock (purchase of capital goods) (Neves & Shirota, 1989). Unit costs were calculated, corresponding to total costs divided by productivity (kg ha-1) for each progeny, i.e., cost per unit product,
called average costs. The economic performance indicators calculated were total gross income, or production value obtained, considering the price paid to the producer; operating profit, the difference between total gross income and total operating cost, which represents the amount of money left to compensate the capital and the entrepreneur’s work; economic profit, the difference between total income and total cost; return index, the relation between total income and operating costs, a measure that represents the return of each currency unit (real) invested in the production, whose value should, therefore, be higher than one; equilibrium price, corresponding to the quotient between total operating cost and total physical production, i.e., the minimum price the product must reach for the income to cover all operating expenses. (Vale & Marciel, 1998); and profitability index, which is equal to the proportion of gross income that
1 Land leasehold was not computed as an opportunity cost, since in this research the land factor was included as an activity-related expense. It was
constitutes available resources (operating profit) (Martin, 1997). Another possible analysis is to consider the initial five years as the period of orchard formation, followed by an additional period of several years (with or without productivity alternation) to evaluate the total income obtained at the end of each period. However, there is no available information about the useful lifetime of custard apple trees (São José et al., 1997). Besides, such useful lifetime shall certainly vary among progenies, in like manner of other crop progenies.
RESULTS AND DISCUSSION
It must be mentioned that there is a considerable variation in fruit size and weight within each progeny production. And, apparently, the consumers’ preference is for larger fruits and they would tend to pay more for them. However, fruits were not classified according to their size and weight in order to differentiate progenies as these characteristics for commercial purposes.
In the first year, total operating cost was R$2,337.18 per hectare (Table 1); important items that made up this cost component were soil tillage, seedlings, and plastic containers used to harvest fruits. Expenses with materials in the initial year represented 69% of effective operating cost. These expenses were only incurred in the year when the experiment was implemented. For this reason, total cost in the first year was higher than in other years. There was a small yield in the first year, during which 12 harvests were required. In the second year, total operating cost was reduced by 33% in relation to the previous year. In spite of this reduction, there were expenses with operations performed during that period that were not incurred during the initial year, such as pruning. The number of harvests in the second year was increased by six-fold. From the third through the fifth year, expenses remained the same and therefore values for those years were consolidated into a single value. Costs for those years increased due to a higher number of harvests (three times per week, for three months), which represented 40% of effective operating cost.
Because yield values for the progenies were very low during the first year, no profit was obtained (Table 2). This caused all return index values to fall below one. The highest total gross income value obtained came from progeny A4. Equilibrium prices, which express the minimum prices producers must receive to cover all their costs, ranged from R$6.64 kg-1 for progeny A4 to
R$28.90 kg-1 for progeny M.
Higher productivities were observed in the second year relative to the previous year, thus generating small profits in most progenies investigated (Table 3). Progeny SM1 provided an operating profit of R$10.07, but no economic profit was generated. This means that the progeny’s yield in the second year was sufficient to offset operating costs (input and operations), but did not completely compensate the opportunity costs. Progenies A3 and A4 were the most productive. As a consequence, they generated higher profits; higher return indices, which express the return of each currency unit (real) disbursed
during production, i.e., for each R$1.00 invested in the second year, progenies A3 and A4 provided returns of R$2.31 and R$2.18; and had profitability indices of 57% and 54%, respectively. Only using these two progenies the producer can sell one kilogram of product for less than R$1.00 and pay for all expenses. Only three progenies (M, SM1, and SM3) failed to generate economic profit during the second year. Again, progeny M was the least productive.
In the third year, progeny M still provided the smallest profit, while progenies A3 and FJ1 ranked first and second as the most profitable, respectively (Table 4). During that year, all progenies had equilibrium prices higher than R$1.00, varying from R$1.55 (progeny A3) to R$4.70 (progeny M).
The highest yield values were observed in the fourth year of evaluation (Table 5). All progenies were profitable, including M. It should be pointed out that some progenies produced above 4,000 kg ha-1 (A4, A6, FJ1, and FJ2), with profits
higher than R$6,000.00. Progeny FJ1, for example, had an economic profit of over R$7,500.00 ha-1, with a return index of
5.13 and 79% profitability (relation between operating profit and total gross income).
Although all progenies generated profit in the fifth year (Table 6), a yield decrease can be observed in relation to the previous year, which resulted in a smaller total gross income. Again, progeny M was less productive, generating an economic profit of just R$159.46, while progeny FJ2 had a profit 19 times higher and was the most profitable during the last year of analysis. It is possible that the intercropping of custard apple trees with other annual crops, especially in the initial years, will contribute to reduce losses resulting from the exploitation of this fruit tree during those years. A profitability evaluation of annual crops intercropped with banana plants demonstrated that, depending on the annual crop and technologies adopted, profitability indices may reach values ranging from 3.36 to 6.68 (Lima et al., 2005).
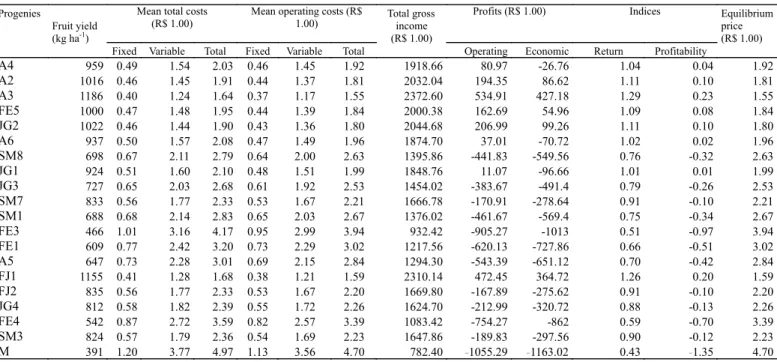
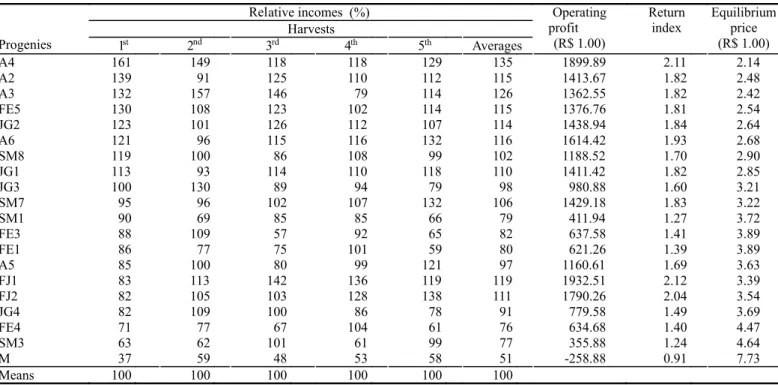
to overcome such difficulty, we chose to analyze the average values of economic performance indicators along the five years of study. Eleven progenies presented the yielding means of five harvests above the average yield of each harvest. Following, progenies were ranked in decreasing order of yielding means: A4 > A3 > FJ1 > A6 > A2 > FE5 > JG2 > FJ2 > JG1 > SM7 > SM8 (Table 7). These progenies also presented the highest average operating profits, but in different decreasing sequence (Table 7): FJ1 > A4 > FJ2 > A6 > JG2, SM7 > A2 > JG1 > FE5 > A3 > SM8. The three progenies showing the highest yield means (Figure 1), and also, the highest operating profits (Figure 2) and the highest return indices (Table 7) were: FJ1, A4 and FJ2. With these progenies, the respective equilibrium prices were (Table 7): R$ 3.39, R$ 2.14 and R$ 3.54. It was observed that the FJ1-operating profit (R$ 1932.51) was superior to the A4-operating profit (R$ 1899.89) by only 1.72 percent, meanwhile the FJ1-equilibrium price was 58.41
percent higher when compared to A4 progeny. However, progenies showing higher fruit yield means in the five harvests are not always the most recommended from the economic point of view. For example, the A3 progeny showed higher average yield than the FJ1, although the latter was observed to be more profitable, providing economical advantage.
It is important to point out that the technified system has proved to be the most profitable in custard apple trees, despite its higher cost when compared with the conventional system (Pelinson et al., 2005). It should also be emphasized that, apparently, the amount of water applied via irrigation to the experiment on which the present work was based was smaller than desirable, due to the great limitations to obtain such input in the region. A higher volume of water applied could probably mean increased yields.
FIGURE1- Fruit yielding of the three most productive custard apple progenies in relation to the average yield (= 100%) of 20 progenies, during the first five harvests.
Value of costs (R$ 1.00)
Description of costs Unit price
R$1.00)1 1 st Year 2nd Year 3rd to 5th
A – Mechanized operations - - -
-Soil tillage 2 5.0 0 mh 5 0.0 0 -
-Weeding 2 5.0 0 mh 2 5.0 0 2 5.0 0 2 5.0 0
Subtotal A - 7 5.0 0 2 5.0 0 2 5.0 0
B – Manual operations - - -
-B1. Management practices - - -
-fertilizations (2×) 1 5.2 0 md 6 0.8 0 6 0.8 0 6 0.8 0
Prunings (1×) 1 5.2 0 md - 3 0.4 0 3 0.4 0
Hoeings (crowning) (3×) 1 5.2 0 md 9 1.2 0 9 1.2 0 9 1.2 0
B2. Harvests - - -
-Labor 1 5.2 0 md 18 2.4 0 27 3.6 0 54 7.2 0
Subtotal B - 33 4.4 0 45 6.0 0 72 9.6 0
C – Material - - -
-Seedlings 1.0 0 un. 44 4.0 0 -
-Single superphosphate 0.7 8 kg 6 2.4 0 6 2.4 0 6 2.4 0
Ammonium sulfate 0.8 0 kg 6 4.0 0 6 4.0 0 6 4.0 0
Potassium chloride 1.1 3 kg 6 7.8 0 6 7.8 0 6 7.8 0
Cattle ma nure 0.3 5 kg 28 0.0 0 28 0.0 0 28 0.0 0
52 -liter capacity plastic containers 2 5.9 0 un. 38 8.5 0 -
-Subtotal C - 1 ,306 .7 0 47 4.2 0 47 4.2 0
D – Irrigation - - -
-Energy 0.1 192 Kw/h 13 0.9 7 13 0.9 7 13 0.9 7
Subtotal D - 13 0.9 7 13 0.9 7 13 0.9 7
Actual Operational Cost (COpE) =
A+B+C+D - 1, 84 7.0 7 1, 08 6.1 7 1, 35 9.7 7 E –Other expenses (5%) = (COE/2)*0.05 - 4 6.1 8 2 7.1 5 3 3.9 9
F – Total Variable Operational Cost
(COpVT) = A+B+C+D+E - 1, 89 3.2 5 1, 11 3.3 2 1, 39 3.7 6
G –ITR (rural tax) - 1 0.6 0 1 0.6 0 1 0.6 0
H – Land Leasehold 10 0. 0 0 /ha 10 0.0 0 10 0.0 0 10 0.0 0
I – Irrigation system depreciation - 33 3.3 3 33 3.3 3 33 3.3 3
J – Total Fixed Operational Cost
(COpFT) = G+H+I - 44 3.9 3 44 3.9 3 44 3.9 3 L – Total Operational Cost (COpT)
= J+F - 2, 33 7.1 8 1, 55 7.2 5 1, 83 7.6 9
Opportunity Costs (CO) - - -
-M – Variable Capital CO = (F/2)*0.12 - 11 3.6 0 6 6.8 0 8 1.5 9
N – Fixed Capital COp. = (J/2)*0.12 - 2 6.6 4 2 6.6 4 2 6.6 4
O – Total Opport. Cost = M+N - 14 0.2 4 9 3.4 4 10 8.2 3
P – Total Variable Cost (CVT) = F+M - 2, 00 6.8 5 1, 18 0.1 2 1, 47 5.3 5
Q – Total Fixed Cost (CFT) = J+N - 47 0.5 7 47 0.5 7 47 0.5 7
R – Total Cost = P+Q - 2, 47 7.4 2 1, 65 0.6 9 1, 94 5.9 2
TABLE 1 – Production cost of fruits from custard apple progenies in the first five harvests, in R$ as of July, 2007.
Mean total costs (R$ 1.00)
Mean operating costs (R$
1.00) Profits (R$ 1.00) Indices
Progenies
Fruit yield (kg ha-1)
Fixed Variable Total Fixed Variable Total
Total gross income(R$
1.00) Operating Economic Return Profitability
Equilibrium price (R$ 1.00)
A4 352 1.34 5.70 7.04 1.26 5.38 6.64 703.90 -1633.28 -1773.52 0.30 -2.32 6.64 A2 304 1.55 6.60 8.15 1.46 6.23 7.69 608.08 -1729.10 -1869.34 0.26 -2.84 7.69 A3 288 1.64 6.98 8.61 1.54 6.58 8.13 575.20 -1761.98 -1902.22 0.25 -3.06 8.13 FE5 285 1.65 7.03 8.68 1.56 6.63 8.19 570.74 -1766.44 -1906.68 0.24 -3.09 8.19 JG2 270 1.74 7.43 9.17 1.64 7.01 8.65 540.44 -1796.74 -1936.98 0.23 -3.32 8.65 A6 265 1.77 7.57 9.34 1.67 7.14 8.81 530.36 -1806.82 -1947.06 0.23 -3.41 8.81 SM8 260 1.81 7.72 9.53 1.71 7.29 8.99 519.72 -1817.46 -1957.70 0.22 -3.50 8.99 JG1 247 1.90 8.12 10.02 1.80 7.66 9.46 494.34 -1842.84 -1983.08 0.21 -3.73 9.46 JG3 219 2.15 9.15 11.30 2.03 8.64 10.66 438.44 -1898.74 -2038.98 0.19 -4.33 10.66 SM7 208 2.26 9.63 11.89 2.13 9.09 11.22 416.70 -1920.48 -2060.72 0.18 -4.61 11.22 SM1 198 2.37 10.12 12.49 2.24 9.54 11.78 396.72 -1940.46 -2080.70 0.17 -4.89 11.78 FE3 193 2.44 10.39 12.83 2.30 9.81 12.11 386.14 -1951.04 -2091.28 0.17 -5.05 12.11 FE1 189 2.50 10.65 13.14 2.36 10.04 12.40 376.98 -1960.20 -2100.44 0.16 -5.20 12.40 A5 186 2.53 10.81 13.35 2.39 10.20 12.59 371.26 -1965.92 -2106.16 0.16 -5.30 12.59 FJ1 181 2.60 11.08 13.68 2.45 10.45 12.90 362.24 -1974.94 -2115.18 0.15 -5.45 12.90 FJ2 179 2.63 11.20 13.83 2.48 10.57 13.05 358.22 -1978.96 -2119.20 0.15 -5.52 13.05 JG4 179 2.63 11.21 13.84 2.48 10.58 13.06 357.96 -1979.22 -2119.46 0.15 -5.53 13.06 FE4 156 3.02 12.86 15.87 2.84 12.13 14.98 312.14 -2025.04 -2165.28 0.13 -6.49 14.98 SM3 138 3.40 14.52 17.93 3.21 13.70 16.91 276.42 -2060.76 -2201.00 0.12 -7.46 16.91 M 81 5.82 24.81 30.63 5.49 23.41 28.90 161.76 -2175.42 -2315.66 0.07 -13.45 28.90
TABLE 2 – Fruit yield, mean operating and total costs, gross income, and fruit sales profitability indicators of custard apple progenies in the first harvest, in R$ as of July, 2007.
2 Source of progenies: M = city of Mossoró-RN; A = Ema Brandl’s ranch, town of Aracati-CE; FE = UFERSA Experimental Farm, Mossoró-RN; FJ =
Francisca Jales’ ranch, Mossoró-RN; João Jerônimo’s ranch, Mossoró-RN; SM = town of Serra do Mel-RN.
Mean total costs (R$ 1.00)
Mean operating costs (R$ 1.00)
Profits (R$ 1.00) Indices
Progenies
Fruit yield (kg ha-1)
Fixed Variable Total Fixed Variable Total
Total gross income (R$ 1.00)
Operating Economic Return Profitability
Equilibrium price (R$ 1.00)
A4 1696 0.28 0.70 0.97 0.26 0.66 0.92 3391.94 1834.69 1741.25 2.18 0.54 0.92 A2 1033 0.46 1.14 1.60 0.43 1.08 1.51 2065.50 508.25 414.81 1.33 0.25 1.51 A3 1795 0.26 0.66 0.92 0.25 0.62 0.87 3589.80 2032.55 1939.11 2.31 0.57 0.87 FE5 1236 0.38 0.96 1.34 0.36 0.90 1.26 2471.28 914.03 820.59 1.59 0.37 1.26 JG2 1152 0.41 1.02 1.43 0.39 0.97 1.35 2304.62 747.37 653.93 1.48 0.32 1.35 A6 1092 0.43 1.08 1.51 0.41 1.02 1.43 2183.00 625.75 532.31 1.40 0.29 1.43 SM8 1138 0.41 1.04 1.45 0.39 0.98 1.37 2275.88 718.63 625.19 1.46 0.32 1.37 JG1 1060 0.44 1.11 1.56 0.42 1.05 1.47 2120.60 563.35 469.91 1.36 0.27 1.47 JG3 1483 0.32 0.80 1.11 0.30 0.75 1.05 2965.20 1407.95 1314.51 1.90 0.47 1.05 SM7 1093 0.43 1.08 1.51 0.41 1.02 1.42 2186.80 629.55 536.11 1.40 0.29 1.42 SM1 784 0.60 1.51 2.11 0.57 1.42 1.99 1567.32 10.07 -83.37 1.01 0.01 1.99 FE3 1246 0.38 0.95 1.32 0.36 0.89 1.25 2492.86 935.61 842.17 1.60 0.38 1.25 FE1 879 0.54 1.34 1.88 0.51 1.27 1.77 1757.04 199.79 106.35 1.13 0.11 1.77 A5 1143 0.41 1.03 1.44 0.39 0.97 1.36 2286.24 728.99 635.55 1.47 0.32 1.36 FJ1 1284 0.37 0.92 1.29 0.35 0.87 1.21 2568.36 1011.11 917.67 1.65 0.39 1.21 FJ2 1198 0.39 0.99 1.38 0.37 0.93 1.30 2396.10 838.85 745.41 1.54 0.35 1.30 JG4 1247 0.38 0.95 1.32 0.36 0.89 1.25 2493.38 936.13 842.69 1.60 0.38 1.25 FE4 876 0.54 1.35 1.88 0.51 1.27 1.78 1752.86 195.61 102.17 1.13 0.11 1.78 SM3 708 0.66 1.67 2.33 0.63 1.57 2.20 1415.48 -141.77 -235.21 0.91 -0.10 2.20 M 671 0.70 1.76 2.46 0.66 1.66 2.32 1342.70 -214.55 -307.99 0.86 -0.16 2.32
TABLE 3 – Fruit yield, mean operating and total costs, gross income, and fruit sales profitability indicators of custard apple progenies in the second harvest, in R$ as of July, 2007.
2 Source of progenies: M = city of Mossoró-RN; A = Ema Brandl’s ranch, town of Aracati-CE; FE = UFERSA Experimental Farm, Mossoró-RN; FJ =
Mean total costs (R$ 1.00)
Mean operating costs (R$ 1.00)
Profits (R$ 1.00) Indices
Progenies
Fruit yield (kg ha-1)
Fixed Variable Total Fixed Variable Total
Total gross income (R$ 1.00)
Operating Economic Return Profitability
Equilibrium price (R$ 1.00)
A4 959 0.49 1.54 2.03 0.46 1.45 1.92 1918.66 80.97 -26.76 1.04 0.04 1.92
A2 1016 0.46 1.45 1.91 0.44 1.37 1.81 2032.04 194.35 86.62 1.11 0.10 1.81
A3 1186 0.40 1.24 1.64 0.37 1.17 1.55 2372.60 534.91 427.18 1.29 0.23 1.55
FE5 1000 0.47 1.48 1.95 0.44 1.39 1.84 2000.38 162.69 54.96 1.09 0.08 1.84
JG2 1022 0.46 1.44 1.90 0.43 1.36 1.80 2044.68 206.99 99.26 1.11 0.10 1.80
A6 937 0.50 1.57 2.08 0.47 1.49 1.96 1874.70 37.01 -70.72 1.02 0.02 1.96
SM8 698 0.67 2.11 2.79 0.64 2.00 2.63 1395.86 -441.83 -549.56 0.76 -0.32 2.63
JG1 924 0.51 1.60 2.10 0.48 1.51 1.99 1848.76 11.07 -96.66 1.01 0.01 1.99
JG3 727 0.65 2.03 2.68 0.61 1.92 2.53 1454.02 -383.67 -491.4 0.79 -0.26 2.53
SM7 833 0.56 1.77 2.33 0.53 1.67 2.21 1666.78 -170.91 -278.64 0.91 -0.10 2.21
SM1 688 0.68 2.14 2.83 0.65 2.03 2.67 1376.02 -461.67 -569.4 0.75 -0.34 2.67
FE3 466 1.01 3.16 4.17 0.95 2.99 3.94 932.42 -905.27 -1013 0.51 -0.97 3.94
FE1 609 0.77 2.42 3.20 0.73 2.29 3.02 1217.56 -620.13 -727.86 0.66 -0.51 3.02
A5 647 0.73 2.28 3.01 0.69 2.15 2.84 1294.30 -543.39 -651.12 0.70 -0.42 2.84
FJ1 1155 0.41 1.28 1.68 0.38 1.21 1.59 2310.14 472.45 364.72 1.26 0.20 1.59
FJ2 835 0.56 1.77 2.33 0.53 1.67 2.20 1669.80 -167.89 -275.62 0.91 -0.10 2.20
JG4 812 0.58 1.82 2.39 0.55 1.72 2.26 1624.70 -212.99 -320.72 0.88 -0.13 2.26
FE4 542 0.87 2.72 3.59 0.82 2.57 3.39 1083.42 -754.27 -862 0.59 -0.70 3.39
SM3 824 0.57 1.79 2.36 0.54 1.69 2.23 1647.86 -189.83 -297.56 0.90 -0.12 2.23
M 391 1.20 3.77 4.97 1.13 3.56 4.70 782.40 --1055.29 --1163.02 0.43 --1.35 4.70
TABLE 4 – Fruit yield, mean operating and total costs, gross income, and fruit sales profitability indicators of custard apple progenies in the third harvest, in R$ as of July, 2007.
2 Source of progenies: M = city of Mossoró-RN; A = Ema Brandl’s ranch, town of Aracati-CE; FE = UFERSA Experimental Farm, Mossoró-RN; FJ =
Francisca Jales’ ranch, Mossoró-RN; João Jerônimo’s ranch, Mossoró-RN; SM = town of Serra do Mel-RN.
Mean total costs (R$ 1.00)
Mean operating costs (R$ 1.00)
Profits (R$ 1.00) Indices
Progenies
Fruit yield (kg ha-1)
Fixed Variable Total Fixed Variable Total
Total gross income (R$ 1.00)
Operating Economic Return Profitability
Equilibrium price (R$ 1.00)
A4 4103 0.11 0.36 0.47 0.11 0.34 0.45 8205.80 6368.11 6260.38 4.44 0.76 0.45 A2 3842 0.12 0.38 0.51 0.12 0.36 0.48 7684.00 5846.31 5738.58 4.17 0.75 0.48 A3 2768 0.17 0.53 0.70 0.16 0.50 0.66 5536.88 3699.19 3591.46 3.03 0.65 0.66 FE5 3551 0.13 0.42 0.55 0.13 0.39 0.52 7102.22 5264.53 5156.80 3.85 0.73 0.52 JG2 3917 0.12 0.38 0.50 0.11 0.36 0.47 7834.22 5996.53 5888.80 4.26 0.75 0.47 A6 4037 0.12 0.37 0.48 0.11 0.35 0.46 8074.22 6236.53 6128.80 4.35 0.76 0.46 SM8 3779 0.12 0.39 0.51 0.12 0.37 0.49 7557.78 5720.09 5612.36 4.08 0.74 0.49 JG1 3847 0.12 0.38 0.51 0.12 0.36 0.48 7693.78 5856.09 5748.36 4.17 0.75 0.48 JG3 3283 0.14 0.45 0.59 0.14 0.42 0.56 6564.90 4727.21 4619.48 3.57 0.70 0.56 SM7 3732 0.13 0.40 0.52 0.12 0.37 0.49 7464.88 5627.19 5519.46 4.08 0.74 0.49 SM1 2865 0.16 0.51 0.68 0.15 0.49 0.64 5730.22 3892.53 3784.80 3.13 0.66 0.64 FE3 3215 0.15 0.46 0.61 0.14 0.43 0.57 6428.90 4591.21 4483.48 3.51 0.70 0.57 FE1 3511 0.13 0.42 0.55 0.13 0.40 0.52 7020.90 5183.21 5075.48 3.85 0.72 0.52 A5 3437 0.14 0.43 0.57 0.13 0.41 0.53 6873.38 5035.69 4927.96 3.77 0.72 0.53 FJ1 4743 0.10 0.31 0.41 0.09 0.29 0.39 9486.22 7648.53 7540.80 5.13 0.79 0.39 FJ2 4455 0.11 0.33 0.44 0.10 0.31 0.41 8910.66 7072.97 6965.24 4.88 0.78 0.41 JG4 2992 0.16 0.49 0.65 0.15 0.47 0.61 5983.56 4145.87 4038.14 3.28 0.67 0.61 FE4 3613 0.13 0.41 0.54 0.12 0.39 0.51 7225.34 5387.65 5279.92 3.92 0.73 0.51 SM3 2131 0.22 0.69 0.91 0.21 0.65 0.86 4260.90 2423.21 2315.48 2.32 0.54 0.86 M 1861 0.25 0.79 1.05 0.24 0.75 0.99 3721.34 1883.65 1775.92 2.02 0.48 0.99
TABLE 5 – Fruit yield, mean operating and total costs, gross income, and fruit sales profitability indicators of custard apple progenies in the fourth harvest, in R$ as of July, 2007.
2 Source of progenies: M = city of Mossoró-RN; A = Ema Brandl’s ranch. town of Aracati-CE; FE = UFERSA Experimental Farm. Mossoró-RN; FJ =
Mean total costs (R$ 1.00)
Mean operating costs (R$ 1.00)
Profits (R$ 1.00) Indices
Progenies
Fruit yield (kg ha-1)
Fixed Variable Total Fixed Variable Total
Total gross income (R$ 1.00)
Operating Economic Return Profitability
Equilibrium price (R$ 1.00)
A4 2343 0.20 0.63 0.83 0.19 0.59 0.78 4686.66 2848.97 2741.24 2.55 0.61 0.78 A2 2043 0.23 0.72 0.95 0.22 0.68 0.90 4086.22 2248.53 2140.80 2.22 0.55 0.90 A3 2073 0.23 0.71 0.94 0.21 0.67 0.89 4145.78 2308.09 2200.36 2.26 0.56 0.89 FE5 2073 0.23 0.71 0.94 0.21 0.67 0.89 4146.66 2308.97 2201.24 2.26 0.56 0.89 JG2 1939 0.24 0.76 1.00 0.23 0.72 0.95 3878.22 2040.53 1932.80 2.11 0.53 0.95 A6 2409 0.20 0.61 0.81 0.18 0.58 0.76 4817.34 2979.65 2871.92 2.62 0.62 0.76 SM8 1800 0.26 0.82 1.08 0.25 0.77 1.02 3600.88 1763.19 1655.46 1.96 0.49 1.02 JG1 2154 0.22 0.69 0.90 0.21 0.65 0.85 4307.10 2469.41 2361.68 2.34 0.57 0.85 JG3 1445 0.33 1.02 1.35 0.31 0.96 1.27 2889.34 1051.65 943.92 1.57 0.36 1.27 SM7 2409 0.20 0.61 0.81 0.18 0.58 0.76 4818.22 2980.53 2872.80 2.62 0.62 0.76 SM1 1199 0.39 1.23 1.62 0.37 1.16 1.53 2396.90 559.21 451.48 1.30 0.23 1.53 FE3 1178 0.40 1.25 1.65 0.38 1.18 1.56 2355.10 517.41 409.68 1.28 0.22 1.56 FE1 1071 0.44 1.38 1.82 0.41 1.30 1.72 2141.34 303.65 195.92 1.17 0.14 1.72 A5 2193 0.21 0.67 0.89 0.20 0.64 0.84 4385.38 2547.69 2439.96 2.39 0.58 0.84 FJ1 2172 0.22 0.68 0.90 0.20 0.64 0.85 4343.10 2505.41 2397.68 2.36 0.58 0.85 FJ2 2512 0.19 0.59 0.77 0.18 0.55 0.73 5024.00 3186.31 3078.58 2.73 0.63 0.73 JG4 1423 0.33 1.04 1.37 0.31 0.98 1.29 2845.78 1008.09 900.36 1.55 0.35 1.29 FE4 1104 0.43 1.34 1.76 0.40 1.26 1.67 2207.12 369.43 261.70 1.20 0.17 1.67 SM3 1793 0.26 0.82 1.08 0.25 0.78 1.02 3586.22 1748.53 1640.80 1.95 0.49 1.02 M 1052 0.45 1.40 1.85 0.42 1.32 1.75 2104.88 267.19 159.46 1.15 0.13 1.75
TABLE 6 – Fruit yield. mean operating and total costs. gross income. and fruit sales profitability indicators of custard apple progenies in the fifth harvest. in R$ as of July. 2007.
2 Source of progenies: M = city of Mossoró-RN; A = Ema Brandl’s ranch. town of Aracati-CE; FE = UFERSA Experimental Farm. Mossoró-RN; FJ =
Francisca Jales’ ranch. Mossoró-RN; João Jerônimo’s ranch. Mossoró-RN; SM = town of Serra do Mel-RN.
Relative incomes (%) Harvests
Progenies 1st 2nd 3rd 4th 5th Averages
Operating profit
(R$ 1.00)
Return index
Equilibrium price (R$ 1.00)
A4 161 149 118 118 129 135 1899.89 2.11 2.14
A2 139 91 125 110 112 115 1413.67 1.82 2.48
A3 132 157 146 79 114 126 1362.55 1.82 2.42
FE5 130 108 123 102 114 115 1376.76 1.81 2.54
JG2 123 101 126 112 107 114 1438.94 1.84 2.64
A6 121 96 115 116 132 116 1614.42 1.93 2.68
SM8 119 100 86 108 99 102 1188.52 1.70 2.90
JG1 113 93 114 110 118 110 1411.42 1.82 2.85
JG3 100 130 89 94 79 98 980.88 1.60 3.21
SM7 95 96 102 107 132 106 1429.18 1.83 3.22
SM1 90 69 85 85 66 79 411.94 1.27 3.72
FE3 88 109 57 92 65 82 637.58 1.41 3.89
FE1 86 77 75 101 59 80 621.26 1.39 3.89
A5 85 100 80 99 121 97 1160.61 1.69 3.63
FJ1 83 113 142 136 119 119 1932.51 2.12 3.39
FJ2 82 105 103 128 138 111 1790.26 2.04 3.54
JG4 82 109 100 86 78 91 779.58 1.49 3.69
FE4 71 77 67 104 61 76 634.68 1.40 4.47
SM3 63 62 101 61 99 77 355.88 1.24 4.64
M 37 59 48 53 58 51 -258.88 0.91 7.73
Means 100 100 100 100 100 100
TABLE 7 – Relative yielding means of five harvests of custard apple progenies: in relation to each of the five fruit yielding means (kg ha-1) (= 100%) of progenies; operating profits; return index and equilibrium prices, in (R$) as of July, 2007.
2 Source of progenies: M = city of Mossoró-RN; A = Ema Brandl’s ranch. town of Aracati-CE; FE = UFERSA Experimental Farm. Mossoró-RN; FJ =
CONCLUSIONS
The exploitation of custard apple progenies only showed to be a profitable agribusiness after the fourth year. Before that, only A3 and A4 progenies in the second year, and P3 and P11 in the third year provided profitable incomes. Considering the methodological assumptions imposed concerning the time period analysis and the prices as of July 2007, the most important profitability indicators (operating profit, return index and equilibrium price) evidenced that the A4 progeny is the most recommended, although other progenies are also highlighted, such as FJ1 and FJ2. As already discussed, the progenies showing the highest average yields of five harvests are not always the most economically recommendable ones.
REFERENCES
ALMEIDA, F.A.G.; MARTINS JÚNIOR, W.; ALMEIDA, F.C.G.; MENÊZES JUNIOR, J. Ecologia comparativa da produção de dois clones de cajueiro-anão quando em condições de irrigação. Revista de la Faculdad de Agronomia, Maracay v.26, n.1, p.91-105, 2000.
CARVALHO, P.S.; BEZERRA, J.E.F.; LEDERMAN, I.E.; ALVES, M.A.; MELO NETO, M.L. Avaliação de genótipos de pinheira (Annona squamosa L.) no Vale do Rio Moxotó III – Características de crescimento e produção – 1992 a 1997. Revista Brasileira de Fruticultura, Jaboticabal, v.22, n.1, p.27-30, 2000.
EBERT, A.; KREUZ, C.L. Chemical thinning of ´Fuji‘ apples in Southern Brazil with consideration of economic aspects. Scientia Horticulturae, Amsterdan, v.34, n.1-2, p.21-32, 1988.
FAGUNDES, G.R.; YAMANISHI, O.K. Quantidade e preços da banana-”prata” comercializada nas CEASAS do Distrito Federal, São Paulo, Belo Horizonte e Rio de Janeiro, no período de 1995 a 1999. Revista Brasileira de Fruticultura, Jaboticabal, v.27, n.2, p.226-229, 2005.
KREUZ, C.L.; PETRI, J.L.; SUZUKI, A. Viabilidade econômica do uso da tela antigranizo em pomares de pêra-japonesa. Revista Brasileira de Fruticultura, Jaboticabal, v.24, n.2, p.416-419, 2002.
LEITE, C. A. M. Planejamento da empresa rural. Brasília, 1998. v.4, 66p. Curso de Especialização por Tutoria a Distância.
LIMA, M.B.; ALVES, E.J.; BORGES, A.L.; NASCIMENTO, F.H.A. Efeitos das culturas de milho (Zea mays), feijão (Phaseolus vulgaris) e caupi (Vigna unguiculata) na agregação de valor ao cultivo da bananeira ‘Terra’, em Teolândia, Litoral Sul da Bahia. Revista Brasileira de Fruticultura, Jaboticabal, v.27, n.1, p.55-59, 2005.
MAIA, G. A.; MESQUITA FILHO, J. A. de; BARROSO, M.AT.; FIGUEREDO, R. W. de. Características físicas e químicas de Ata. Pesquisa Agropecuária Brasileira, Brasília, v.21, n.4, p.
1073-1076, 1986.
MARTIN, N.B.; SERRA, R.; OLIVEIRA., M.D.M.; ÂNGELO,J.A.; OKAWA, H. Sistema “CUSTAGRI”: sistema integrado de custo agropecuário. São Paulo: IEA, 1997. p. 4-7.
MORGADO, I.F.; AQUINO, C.N.P.; TERRA, D.C.T. Aspectos econômicos da cultura do abacaxi: sazonalidade de preços no Estado do Rio de Janeiro. Revista Brasileira de Fruticultura, Jaboticabal, v.26, n.1, p.44-47, 2004.
NEVES, E.M.; SHIROTA, R. Consideração sobre a importância, determinação e avaliação de custos. Piracicaba-SP: FEALQ/ DESR/ESALQ/USP, 1989. 14 p. mimeo
PELINSON, G.J.B.; BOLIANI, A.C.; TARSITANO, M.A.A.; CORREA, L.S. Análise do custo de produção e lucratividade na cultura de pinha (Annona squamosa L.) na região de Jales-SP, no ano agrícola 2001-2002. Revista Brasileira de Fruticultura, Jaboticabal, v.23, n.3, p.593-596, 2001.
PETINARI, R.A.; TARSITANO, M.A.A. Análise econômica da produção de acerola para mesa, em Jales-SP: um estudo de caso. Revista Brasileira de Fruticultura, Jaboticabal, v.24, n.2, p.411-415, 2002.
RECEITA FEDERAL. Taxa selic. Disponível em: <http:// w w w . r e c e i t a . g o v . b r / P a g a m e n t o s / jrselic.htm#Taxa_de_Juros_Selic>. Acesso em: 23 ago. 2007.
REIS, R. Pereira. Fundamentos de economia aplicada. Lavras: UFLA/FAEPE,2002. 95p. Textos Acadêmicos
SÃO JOSÉ, A.R.; SOUZA, I.V.B.; MORAIS, O.M.; REBOUÇAS, T.N.H. Anonáceas, produção e mercado (pinha, graviola, atemóia e cherimólia). Vitória da Conquista: Universidade Estadual do Sudoeste da Bahia, 1997. 312p.
SHIN, Y.S.; PARK, S.D.; KIM, J.H. Influence of pollination methods on fruit development and sugar contents of oriental melon (Cucumis melo L. cv. Sagyejeol-Ggul). Scientia Horticulturae, Amsterdan, v.112, n.4, p.388-392, 2007.
SILVA, P.S.L.; ANTONIO, R.P.; MARIGUELE, K.H.; SILVA, K.M.B.; SILVA, J.C.V. Estimates of genetic parameters for fruit yield and quality in custard apple progenies. Revista Brasileira de Fruticultura, Jaboticabal, v.29, n.3, p.550-558, 2007.
SILVA, C.S.; PEROSA, J.M.Y.; RUA, P.S.; ABREU, C.L.M.; PÂNTANO, S.C.; VIEIRA, C.R.Y.I.; BRIZOLA, R.M.O. Avaliação econômica das perdas de banana no mercado varejista: um estudo de caso. Revista Brasileira de Fruticultura, Jaboticabal, v.25, n.2, p.229-234, 2003.