_________________________
1 Engenheiro Agrícola, Doutor em Engenharia Agrícola, Programa de Pós-Graduação em Engenharia Agrícola, UNIOESTE,
Cascavel - PR, fone (45) 3038-7033, [email protected]
2 Engenheira Química, Profa. Dra., PGEAGRI/UNIOESTE, Cascavel - PR, fone (45)3220-3266, [email protected] 3 Engenheira Agrônoma, Profa. Dra., PGEAGRI/UNIOESTE, Cascavel - PR, fone (45)3220-7413, [email protected] 4 Matemática, Profa. Dra., PGEAGRI/UNIOESTE, Cascavel - PR, fone (45)3220-7320, [email protected] 5 Engenheiro Agrícola, CCET/UNIOESTE, Cascavel - PR, fone (45)3220-3266, [email protected]
OSVALDO KUCZMAN1, MARIA H. F. TAVARES2, SIMONE D. GOMES3,
LUCIANA P. C. GUEDES4, GEOVANE GRISOTTI5
ABSTRACT: The cassava starch industries generate a large volume of wastewater effluent that, stabilized in ponds, wastes its biogas energy and pollutes the atmosphere. To contribute with the reversion of this reality, this manipueira treatment research was developed in one phase anaerobic horizontal pilot reactor with support medium in bamboo pieces. The reactor was excavated into the ground and sealed with geomembrane in HDPE, having a volume equal to 33.6 m3 and continuous feeding by gravity. The stability indicators were pH, volatile acidity/total alkalinity ratio and biogas production. The statistical analyses were performed by a completely randomized design, with answers submitted to multivariate analysis. The organical loads in COD were 0.556; 0.670; 0.678 and 0.770 g L-1 and in volatile solids (VS) of 0.659; 0.608; 0.570 and 0.761 g L-1 for the hydraulic retention times (HRT) of 13.0; 11.5; 10.0 and 7.0 days, respectively. The reductions in COD were 88; 80; 88 and 67% and for VS of 76; 77; 65 and 61%. The biogas productions relatively to the consumed COD were 0.368; 0.795; 0.891 and 0.907 Lg-1, for the consumed VS of 0.524; 0.930; 1.757 and 0.952 Lg-1 and volumetric of 0.131; 0.330; 0.430 and 0.374 L L-1 d-1. The reactor remained stable and the bamboo pieces, in visual examination at the end of the experiment, showed to be in good physical conditions.
KEYWORDS: biodigester, biogas, anaerobic digestion, cassava, cassava wastewater.
TRATAMENTO DE EFLUENTE DE FECULARIA EM REATOR ANAERÓBIO TUBULAR HORIZONTAL PILOTO COM MEIO SUPORTE
RESUMO: As fecularias produzem grande volume de manipueira que, estabilizado em lagoas, provoca desperdício da energia do biogás e a poluição da atmosfera. Para contribuir com a reversão dessa realidade, desenvolveu-se esta pesquisa de tratamento de manipueira de fecularia em reator anaeróbio tubular horizontal piloto, com meio suporte, em peças de bambu. O reator foi escavado no solo e impermeabilizado com geomembrana, com volume de 33,6 m3 e alimentação contínua por gravidade. Os indicadores de estabilidade foram pH, relação acidez volátil/alcalinidade total e produção de biogás. O delineamento experimental foi o inteiramente casualizado, com respostas submetidas à análise multivariada. As cargas orgânicas em termos de demanda química de oxigênio (DQO) foram de 0,556; 0,670; 0,678 e 0,770 g L-1 e em sólidos voláteis (SV) de 0,659; 0,608; 0,570 e 0,761 g L-1 para os tempos de retenção hidráulica (TRH) de 13,0; 11,5; 10,0 e 7,0 dias, respectivamente. As reduções médias de DQO foram de 88; 80; 88 e 67% e de SV de 76; 77; 65 e 61%, respectivamente. As produções de biogás por DQO consumida foram de 0,368; 0,795; 0,891 e 0,907 L g-1, por SV consumidos de 0,524; 0,930; 1,757 e 0,952 L g-1 e volumétrica de 0,131; 0,330; 0,430 e 0,374 L L-1 d-1. O reator permaneceu estável, e as peças de bambu, em análise visual ao final do experimento, apresentaram-se fisicamente íntegras.
INTRODUCTION
Originally from South America, cassava is one of the most important food for about 500 million people, being produced by more than 80 countries. Brazil participates with more than 15% of world production, taking the 2nd place in the world ranking (FAO, 2011).
Among the products derived from cassava, there is the starch whose manufacturing process generates high volume of effluent (cassava) with high organic load resulted from the dissolution of organic compounds, unbalancing the natural resources (CHAVALPARIT & ONGWANDEE, 2009). The organic compounds present in the cassava are highly susceptible to anaerobic biological treatment (SUN et al., 2012). The effluent also carries the starch from the equipment washing, which typically follows for biological treatment in ponds. The ponds emit methane, resulting in wasted energy. On the other hand, the industry buys electricity to operate the productive process and fuel for drying the starch, reducing the profitability of the activity. Treated in anaerobic reactors the efluent produces biogas, which can be used for electricity production (MARTINS & OLIVEIRA, 2011) or hot air for drying the starch.
Considering the aspects noted above, this research was carried out to evaluate the treatment of effluent of cassava starch production in a pilot horizontal anaerobic reacto with support mean, using the hydraulic retention times (HRT) of 13.0; 11.5; 10.0 and 7.0 days.
MATERIAL AND METHODS
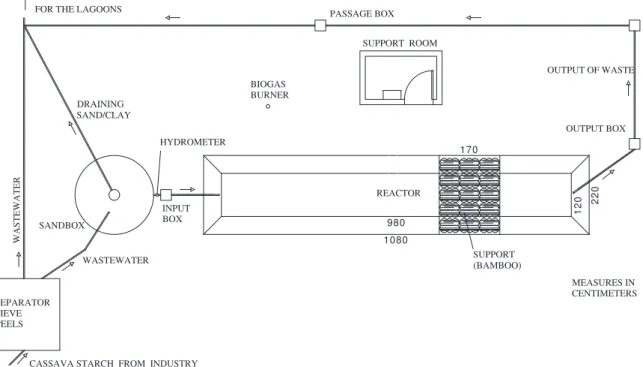
In a starch manufacturer, located in West Paraná, Brazil, it was constructed and operated a pilot anaerobic tubular horizontal flow reactor with continuous gravity feeding. The fermentation chamber, excavated in the soil, with trapezoidal section in both the transverse and longitudinal directions and the background without slope, had the following dimensions:upper length 10.80 m, lower length 9.80 m, upper width 2.30 m, bottom width 1.30 m and depth of 2.10 m, with a total volume of 33.6 m3. The sealing of the chamber and the gasometer were performed with high density polyethylene geomembrane (HDPG), with a thickness of 1.25 mm. Polypropylene bags (45 aerated bags with wide mesh) were stacked as support mean for microorganisms, containing 9,000 bamboo pieces with length of 15 cm and diameter of 4 cm, with specific surface of 11.42 m2 m-3 of reactor. The bamboo remained immersed in effluent's fermentation for 470 days, occupying a volume of 1.061 m3 in the chamber. Before the reactor, it was installed a container to hold sand and clay contained in the effluent, which also works to equalize the flow. The daily flow rate was controlled by a water meter, which was disassembled, cleaned and checked daily.
1080 980
2
2
0
1
2
0
SEPARATOR SIEVE PEELS
CASSAVA STARCH FROM INDUSTRY WASTEWATER
W
A
S
TE
WA
TE
R
SANDBOX
INPUT BOX DRAINING
SAND/CLAY
PASSAGE BOX
SUPPORT ROOM
OUTPUT BOX OUTPUT OF WASTE
HYDROMETER
SUPPORT (BAMBOO)
170
REACTOR
FOR THE LAGOONS
MEASURES IN CENTIMETERS BIOGAS
BURNER
FIGURE 1. Implementation of the anaerobic tubular horizontal pilot reactor with continuous feeding by gravity.
The treatments were the hydraulic retention times (HRT) of 13.0; 11.5; 10.0 and 7.0 days. The inoculation was performed with 10 m3 of sludge from anaerobic pond from cassava starch industry the volumetric ratio of 10.0: 22.6: 1.0 m3 (sludge: water: effluent). The stabilization load was achieved by gradually daily increasing feeding until getting the first HRT of 13.0 days, when an equivalent of HRT was waited to exit from the effect of increased load. The increases in load were monitored through measurements of pH, volatile acidity ratio/total alkalinity (VA/TA) and flammability of biogas with blue flame. The pH values should be above 6.5, whereas the values of VA/TA ratio should be less than 0.5.The Table 1 details temporal managing of the experiment.
TABLE 1. Temporal managing of the experiment.
Phase Date / Period(m/d/y) Operational detail
Inoculation 20/03/2010 Sludge introduction of the anaerobic lagoon
Start 21/03 to 16/06/2010 Daily increase in flow followed by maintenance
Treatment of HRT of 13 d 17/06 to 13/07/2010 Data collection
Gradual increase of load 14/07 to 30/07/2010 Daily increase in flow followed by maintenance
Treatment of HRT in 11.5 d 31/07 to 04/09/2010 Data collection
Gradual increase of load 05/09 to 03/11/2010 Daily increase in flow followed by maintenance
Treatment of TRH in 10 d 04/11 to 15/12/2010 Data collection
Gradual increase of load 16/12/2010 to 08/05/2011 Daily increase in flow followed by maintenance. Shutdown of the industry
Treatment of HRT in 7 d 09/05 to 07/06/2011 Data collection
The variables evaluated were temperature (T), organic load in terms of COD and VS, biogas production by consumed COD and VS and volumetric, pH and ratio VA/TA. The biogas production was corrected for STP (Standard Conditions of Temperature and Pressure) and totalized daily through a meter of LPG (Liquefied Petroleum Gas)/natural gas.
The data were submitted, with the program R 2.13.0 (R DEVELOPMENT CORE TEAM, 2011), to the multivariate analysis of variance (MANOVA), evaluating the effects of treatments on response variables and the tests of comparing hypotheses of the mean vectors of response variables, taking into account the correlations. To identify the proper techniques of multivariate statistical inference, related to MANOVA and to the mean comparison tests, it was performed an analysis of the assumptions: multivariate normal distribution, identified by univariate and multivariate normality tests; homogeneity of the covariance matrix, identified by the M Box test and equality of variance and covariance matrix, identified by the Bartlett test. The desirability chart was obtained with the program STATSOFT (STATSOFT, INC 2006).
RESULTS AND DISCUSSION
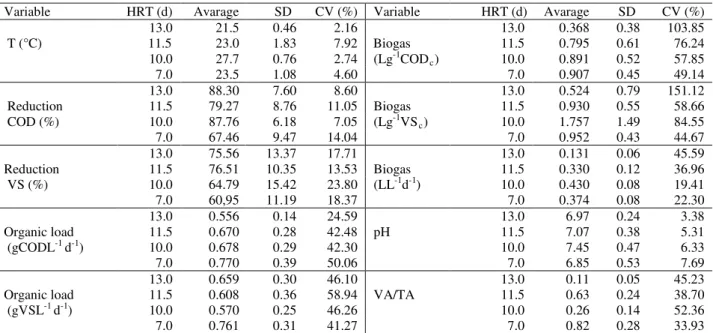
The Table 2 presents the results of descriptive statistics for the response variables.
TABLE 2. Response variables descriptive statistics.
Variable HRT (d) Avarage SD CV (%) Variable HRT (d) Avarage SD CV (%)
T (°C)
13.0 21.5 0.46 2.16 13.0 0.368 0.38 103.85 11.5 23.0 1.83 7.92 Biogas 11.5 0.795 0.61 76.24
10.0 27.7 0.76 2.74 (Lg-1COD
c) 10.0 0.891 0.52 57.85
7.0 23.5 1.08 4.60 7.0 0.907 0.45 49.14
Reduction COD (%)
13.0 88.30 7.60 8.60 13.0 0.524 0.79 151.12 11.5 79.27 8.76 11.05 Biogas 11.5 0.930 0.55 58.66 10.0 87.76 6.18 7.05 (Lg-1VS
c) 10.0 1.757 1.49 84.55
7.0 67.46 9.47 14.04 7.0 0.952 0.43 44.67
Reduction VS (%)
13.0 75.56 13.37 17.71 13.0 0.131 0.06 45.59 11.5 76.51 10.35 13.53 Biogas 11.5 0.330 0.12 36.96 10.0 64.79 15.42 23.80 (LL-1d-1) 10.0 0.430 0.08 19.41
7.0 60,95 11.19 18.37 7.0 0.374 0.08 22.30
Organic load (gCODL-1 d-1)
13.0 0.556 0.14 24.59 13.0 6.97 0.24 3.38 11.5 0.670 0.28 42.48 pH 11.5 7.07 0.38 5.31 10.0 0.678 0.29 42.30 10.0 7.45 0.47 6.33 7.0 0.770 0.39 50.06 7.0 6.85 0.53 7.69
Organic load (gVSL-1 d-1)
13.0 0.659 0.30 46.10 13.0 0.11 0.05 45.23 11.5 0.608 0.36 58.94 VA/TA 11.5 0.63 0.24 38.70 10.0 0.570 0.25 46.26 10.0 0.26 0.14 52.36 7.0 0.761 0.31 41.27 7.0 0.82 0.28 33.93 SD – Standard Deviation; CV – Coefficient of variation
The differences between treatments, identified in the statistical analysis, consider the influences of all variables. The highest coefficients of variation were observed in organic load variables COD and VS, biogas production by CODc, VSc and volumetric and ratio VA/TA. The behavior is due to the variation of concentration in organic load, in the effluent’s flow generated in the cassava starch industry and in the biogas produced.
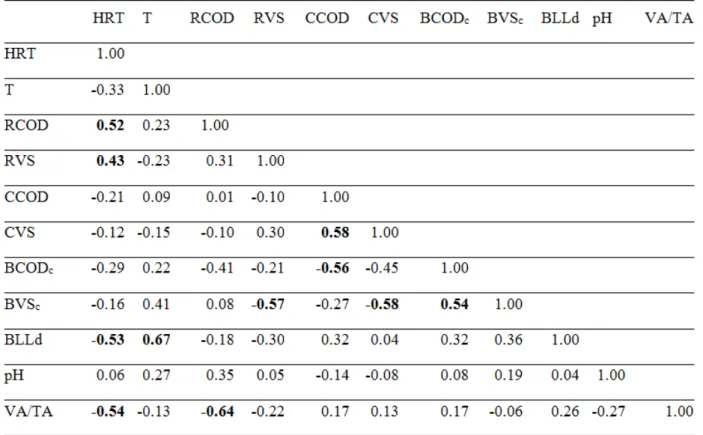
TABLE 3. Linear correlations of response variables.
T - Temperature (°C); RCOD – Reduction of COD (%); RVS – Reduction of VS (%); CCOD – Organic load
in COD (gCODL-1 d-1); CVS –Organic load in volatile solids (gVSL-1 d-1); BCOD
c – Biogas per COD consumed
(Lg-1COD
c); BVSc – Biogas per VS consumed (Lg-1VSc); BLLd – volumetric biogas (LL-1d-1).
The Table 3 presents the positive moderate linear correlation between the independent variableHRT and the dependent variable reduction of organic load in COD, demonstrating that the reduction of the HRT reduced the efficiency of the anaerobic treatment (FENG et al., 2008). Two other moderate linear correlations, but negative, occurred with the volumetric biogas production and ratio VA/TA. The researches confirm that the reduction of HRT increases the volumetric production of biogas, fact explainable by the increasing of the microbial metabolism in face of increased substrate supply (KUCZMAN et al., 2011). The content of volatile acids in the pilot reactor was another variable that increased with HRT reduction, possibly due to the increased flow of effluent in the reactor, with reduction of methanogenic activity (WIJEKOON et al., 2011).
The variable internal temperature of the reactor showed a positive linear correlation with the production of biogas per volume of reactor, demonstrating that the specific biogas production per volume of reactor is proportional to the temperature (CHAE et al., 2008).
On the other hand, the reduction of COD showed a negative linear correlation with VA/TA ratio, associating the reduction of organic load in COD with the increasing of alkalinity in the reactor.
The volumetric production of biogas showed a weak positive linear correlation with the load. Therefore, to increase the biogas production per reactor volume it should be operated with higher loads (KUCZMAN et al., 2011).
Finally, the biogas production per consumed COD obtained positive linear correlation with the biogas production per VS consumed, confirming the similar nature of the variables.
The Table 4 presents the summary of the statistical univariate and multivariates.
TABLE 4. Results of the statistical tests on the response variables.
Statistical Test Results
Univariate Normality (Shapiro Wilk at 5%) p-value = 0.12 Normal only for pH
Multivariate Normality (Shapiro Wilk and Shapiro Francia at 5%) p-value < 0.01 Not normal
Homogeneity of the covariance matrix (M Box at 5%) p-value < 0.01
Not homogeneous
MANOVA (Pillai at 1%) p-value < 0.01
At least one HRT influenced the answers Equality of matrix and variance and covariance compared two by
two (Bartlett at 1%)
p-valor < 0.01 Not equal Conjoint comparison of the vectors of means two by two (Hotteling
at 1%)
p-value < 0.01 Different
Analyzing the assumptions associated with multivariate statistical model, which validate the use of MANOVA, as shown in Table 4, the only variable with univariate normality by the Shapiro-Wilk method, at 5% significance level, was the pH. In the analysis of multivariate normality, the p-value resulted in <0.01, showing that the set of response variables did not present multivariate normal distribution. The assumption of homogeneity of the covariance matrix, evaluated by the M Box test hypothesis, was rejected at 5% of significance.Despite of the assumptions associated with the model have not been attended the Pillai criterion, it was used because this procedure is robust enough to guarantee reliability in the multivariate method, considering the minimal sampling size used in the experiment (MUIRHEAD, 2005). The p-value, by Pillai test with a significance level of 1%, presented itself <0.01, showing that at least one treatment influenced the set of responses.
The test of equality of variance and covariance matrices was performed by the Bartlett Test at 1% significance, with p-value <0.01, concluding that the matrices of variance and covariance, comparing the treatments two by two, were not equal. As at least one of the treatments was statistically significant and the variance and covariance matrices were not equal, the Hotteling Test was applied, which compares the average vectors two by two, justified by the sample size that meets the minimum requirements (MUIRHEAD, 2005) for the accuracy of statistical inference. The comparison of average vectors, by Hotteling Test at 1% significance, resulted in a p-value <0.01, showing that the sets of response variables are, on the average, different between the treatments.
HRT (days) C O D m g L 1
13 11.5 10 7
6000 6500 7000 7500 3000 3500 4000 4500 F lo w L d 1 COD Flow
FIGURE 3. Organic load and flow at the HRT.
Despite of the increase of the flow during treatments to increase the organic load in the reactor, the COD concentration in the effluent fluctuated, with the HRT decrease of 7.0 days, showing the variability in the concentration of raw material in a pilot reactor.
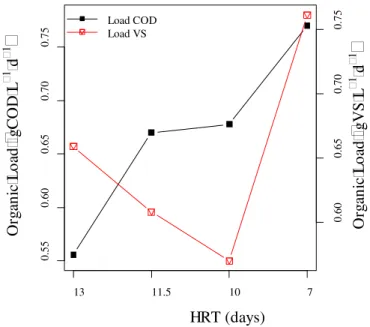
The Figure 4 presents the evolution of the average values of organic load in COD and VS.
HRT (days) O rg an ic L oa d gC O D L
1 d
1
13 11.5 10 7
0.55 0.60 0.65 0.70 0.75 0.60 0.65 0.70 0.75 O rg an ic L oa d gV S L
1 d
1
Load COD Load VS
FIGURE 4. Organic load in COD and VS at the HRT.
HRT (days) O rg an ic L oa d gC O D L
1 d
1
13 11.5 10 7
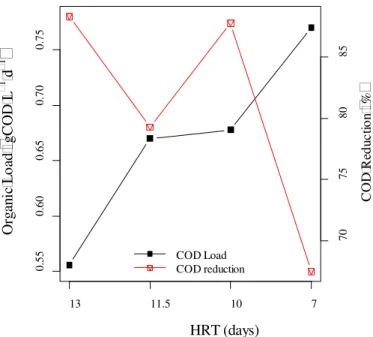
0.55 0.60 0.65 0.70 0.75 70 75 80 85 C O D R ed uc tio n % COD Load COD reduction
FIGURE 5. Organic load in COD and its reduction at the HRT.
With the reduction of the HRT, it occurred an increase in the organic load with diminution of the reduction of the organic load, except for the HRT of 10.0 days. This exception is explained by the higher temperature with which the HRT of 10.0 days was operated, when the more intense activity of the reactor increased the organic load reduction. COD reductions occur with the increasing in the HRT, because the substrate has more time to degrade itself (FENG et al., 2008; KUCZMAN et al., 2013).
KUCZMAN et al. (2011) fed an horizontal tubular bench reactor with effluent of cassava starch, using an organic load of 2.68 g COD L-1d-1, TRH of 7 days and 33 °C, and obtaining a COD reduction of 95%. In the present experiment, they were obtainedCOD removal efficiencies of 70% for the same HRT (7 days) and an average temperature of 23.6 C.The advantage achieved by the authors may be explained by the operating temperature, higher in 9.4 °C, even without support mean. The average values of temperature and reduction of COD are shown in the Figure 6.
HRT (days) T em pe ra tu re C
13 11.5 10 7
21 22 23 24 25 26 27 28 70 75 80 85 C O D R ed uc tio n % Temperature COD Reduction
It is observed in the Figure 6 that, although the temperature, statistically different, varied from 21.5 to 23 °C and the HRT from 13.0 to 11.5 days, there was a decrease in the COD reduction, contradicting the researchers Chae et al. (2008), who reporte that the microbial activity is proportional to temperature variation.The decrease in reduction of COD, even with the increase in temperature, may be justified because it is the beginning of the fermentation process, when the system has not had structured biomass.At HRT of 10.0 days, due to the average temperature of 27.7 ° C, there was an accentuated increase in the COD reduction, close to 88%. At the HRT of 7.0 days, the reduction in temperature decreased the reduction of COD, as also observed by CHAE et al. (2008).The average temperature ranged from 21.5 to 27.7 °C, which is below the optimal range for mesophilic digestion, from 35 to 37 °C (BOUALLAGUI et al., 2004).
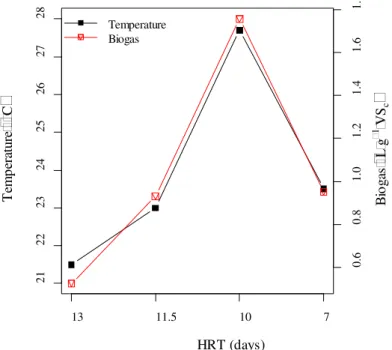
The Figures 7 and 8 present the profiles of the average biogas production at the treatments.
HRT (days) T em pe ra tu re C
13 11.5 10 7
21 22 23 24 25 26 27 28 0.6 0.8 1.0 1.2 1.4 1.6 1.8 B io ga s L g
1 V
Sc
Temperature Biogas
FIGURE 7. Temperature and biogas production at the HRT.
HRT (days) T em pe ra tu re C
1 2 3 4
21 22 23 24 25 26 27 28 0.15 0.20 0.25 0.30 0.35 0.40 V ol um et ric B io ga s L Lre ac to r 1 d 1 Temperature Biogas
The biogas productions followed the variations of the internal temperature of the reactor, which often interferes with the performance of biological wastewater treatment and with the stability of the process.The temperature presented positive linear correlation with the production of biogas, as shown in the Table 2.The temperatures below 24 °C, inHRT of 13.0; 11.5 and 7.0 days, are considered psichrophilics (<25°C) (EL-MASHAD et al., 2004), the phase of lower microbial activity (DONOSO- BRAVO, 2011).The biodigester was operated for 111 days, of which 83 days (75%) had average temperatures between 21.2 and 23.5 °C, which was prejudicial to biogas production (CHAE et al., 2008).The higher production of biogas in the reactor in 10.0 days HRT resulted from average temperature of 27.7 °C. The biogas, analyzed in composite sample from the HRT of 7.0 days, resulted in 53.7% methane.
Anaerobic digestions that occur below 30 °C change the microbial activity in 11% per °C temperature. The research of KUCZMAN et al. (2011) in bench reactor, with the same effluent and without the support mean, obtained biogas production per CODc of 0.61 against 0.91Lg-1 of this study and volumetric biogas production of 0.63 against 0.37 LL-1 d-1, due to the operating temperature of the reactor, 33 °C against 23.5 °C in the same HRT at 7.0 days.
FEIDEN & CEREDA (2003) fed a pilot UASB reactor with effluent of cassava starch and obtained production of 3.975 L of biogas per liter of manipueira influent to the reactor, equivalent to the average of the present study.
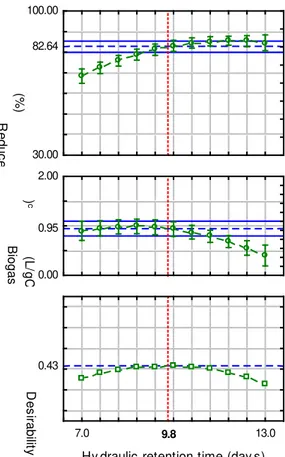
In the Figure 9, it is observed that the HRT of 9.8 days is the treatment that combines both the higher reduction of COD with higher production of biogas by COD consumed. The smoothness of the curve defines a broad range of HRT, between 8.0 and 12.0 days, as the greatest performance in the variables reduction of COD and biogas production by CODconsumed.
30.00 82.64 100.00
R
ed
u
c
e
(%)
0.00 0.95 2.00
B
io
ga
s
(L
/g
C
c
)
7.0 9.8 13.0
Hy draulic retention time (day s)
0.43
D
e
s
irabilit
y
FIGURE 9. HRT desirability to reduce COD and to biogas production.
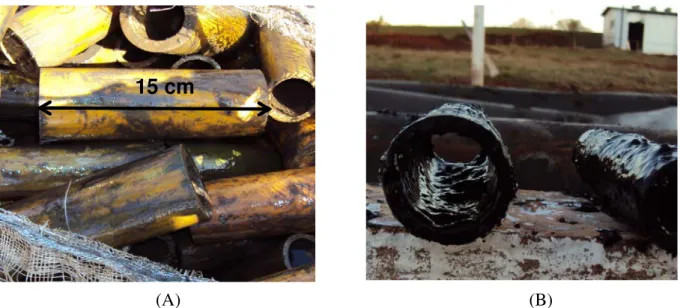
The Figure 10 presentess the visual characteristics of the bamboo parts taken from the reactor, at two different times.
(A) (B) FIGURE 10. Bamboo pieces: (A) 60 days and (B) 470 days after the reactor inoculation.
Observing the Figure 10A, it is possible, after 60 days of inoculation, see the beginning of the biofilm formation, indicating that the first treatments hstill did not have it.
In the Figure 11 are described the average values of stability reactor indicators.
HRT (days)
R
at
io
V
A
T
A
13 11.5 10 7
0.2
0.4
0.6
0.8
6.9
7.0
7.1
7.2
7.3
7.4
pH
VA/TA pH
FIGURE 11. Ratio VA / TA and pH at the HRT.
The optimal pH range, from 6.8 to 7.2 (WARD et al., 2008), was achieved in the HRT of 13.0, 11.5 and 7.0 days, whereas the VA/TA ratio, which recommended range, according to Sanchez et al. (2005) is 0.1 to 0.5, was observed in the HRT of13.0 and 10.0 days.The pH in the HRTof 10 days, showed up more than 7.2 and VA/TA ratio above 0.5 in the HRT of 11.5 and 7.0 days: even so the fermentation process was stable, observed by the maintenance of biogas production. In the HRT of 10.0 days, influenced by the temperature, the ratio value VA/TA decreased and the pH increased, improving the performance of the reactor.Several observations of VA =/TA ratio had values above 0.8, especially in smaller HTR, which could cause the collapse of the system, with the decrease in pH and inhibition of methanogenic phase. The reactor capacity in
supporting values VA/TA above normal limits can be associated with the use of support mean, which provided higher amount of microorganisms.
CONCLUSIONS
Anaerobic treatment of manipueira in horizontal tubular pilot reactor showed COD removals between 67 and 88% and the best biogas production by CODc, VSc and volumetric occurred in HRT of 7.0; 10.0 and 13.0 days, respectively.The pH was maintained above 6.5 and high ratios VA/TA (0.82) did not result in instability, which may be due to the presence of the support mean. The HRT of 10.0 days, conducted under higher temperature (27.7 °C), showed the best performance, with increased biogas production and bigger reduction of COD (87.7%). The treatments, evaluated jointly, showed themselves, with 1% of significance, statistically different.
ACKNOWLEDGMENTS
To the Post Graduation Program in Agricultural Engineering - PGEAGRI of Western Parana State University - UNIOESTE for the infrastructure support, and to CNPq for granting the funds.
REFERENCES
APHA - American Public Health Association. Standard methods for the examination of water and wastewater. 19th ed. Washington, 1998.
BOUALLAGUI, H.; HAOUARI, O.; TOUHAMI, Y.; BEN, C. R.; MAROUANI, L.; HAMDI, M., Effect of temperature on the performance of an anaerobic tubular reactor treating fruit and vegetable waste. Process Biochemistry,London, v. 39, p. 2143-2148, 2004.
CHAE, K. J.; JANG, A.; YIM, S. K.; KIM I. S. The effects of digestion temperature and
temperature shock on the biogas yields from the mesophilic anaerobic digestion of swine manure. Bioresource Technology, Essex, v. 99, p. 1-6, 2008.
CHAVALPARIT, O.;ONGWANDEE, M. Clean technology for the tapioca starch industry in Thailand. Journal of Cleaner Production, Amsterdam, v.17, n.2, p.105-110, 2009.
DONOSO-BRAVO, A.; MAILLIER, J.; MARTIN, C.; RODRIGUEZ, J.; ACEVES-LARA, C. A.; WOUWER, A. V. Model selection, identification and validation in anaerobic digestion: A review. Water Research, New York, v. 45, n. 17, p.5347-5364, 2011.
EL-MASHAD, H. M.; ZEEMAN, G.; VAN LOON, W. K. P.; BOT, G. P.A.; LETTINGA, G. Effect of temperature and temperature fluctuation on thermophilic anaerobic digestion of cattle manure. Bioresource Technology, Essex, v. 95, p. 191–201, 2004.
FAO - Organização das Nações Unidas para Agricultura e Alimentação. Disponível em:<https://www.fao.org.br/>. Acesso em: 20 ago. 2011.
FEIDEN, A.; CEREDA, M. P. Potencial energético do biogás gerado no tratamento de águas residuárias de fecularias em sistema piloto de biodigestão anaeróbia com separação de fases. Energia na Agricultura, Botucatu, v. 18, n. 2, 2003.
FENG, H-J.; HU, L-F.; SHAN, D.; FANG, C-R.; SHEN, D-S.Effects of Temperature and Hydraulic Residence Time (HRT) on Treatment of Dilute Wastewater in a Carrier Anaerobic Baffled Reactor. Biomedical and Environmental Sciences, Beijing, v. 21, p. 460-466, 2008.
KUCZMAN, O.; TORRES, D. G. B.; DAMASCENO, S. D.; TAVARES, M. H. F.; ALCANTARA, M. S.Produção específica de biogás a partir de manipueira em reator de fase única. Engenharia Agrícola, Jaboticabal, v. 31, n. 1, p. 143-149, 2011.
effluent using a one-phase horizontal reactor. Journal of Food, Agriculture & Environment, v.11 n.1, p. 1118-1120, 2013.
MARTINS, F. M.; OLIVEIRA, P. A. V. de. Análise econômica da geração de energia elétrica a partir do biogás na suinocultura.Engenharia Agrícola, Jaboticabal, v. 31, n. 3, p. 477-486,
2011.MORITA, M.; SASAKI, K. Factors influencing the degradation of garbage in methanogenic bioreactors and impacts on biogas formation. Applied Microbiology and Biotechnology, Berlin, v. 94, n. 3, p. 575-582, 2012.
MUIRHEAD, R. J.Aspects of multivariate statistical theory.New York: Wiley Interscience, 2005. R DEVELOPMENT CORE TEAM. R: A language and environment for statistical computing. Vienna: R Foundation for Statistical Computing. Disponível em: <//www.R-project.org/ > Versão 2.13.0. Acesso em: 13 abr. 2011.
SÁNCHEZ, E.; BORJA, R.; TRAVIESO, L.; MARTÍN, A.; COLMENAREJO, M.F. Effect of organic loading rate on the stability, operational parameters and performance of a secondary up flow anaerobic sludge bed reactor treating piggery waste. Bioresource Technology, Essex v.96, n.3, p.335-344, 2005.
STATSOFT. STATISTICA for Windows. Tulsa, UK: StatSoft, 2006.
SUN, L.; WAN, S.; YU, Z.; WANG, Y.; WANG, S. Anaerobic biological treatment of high
strength cassava starch wastewater in a new type up-flow multistage anaerobic reactor. Bioresource Technology, Essex, v. 104, n. 3, p. 280-288, 2012.
WARD, A. J.; HOBBS, P.J.; HOLLIMAN, P. J.; JONES, D. L. Optimisation of the anaerobic digestion of agricultural resources. Bioresource Technology, Essex, v.99, n. 17, p.7928-7940, 2008. WIJEKOON, K. C.; VISVANATHAN, C.; ABEYNAYAKA, A. Effect of organic loading rate on VFA production, organic matter removal and microbial activity of a two-stage thermophilic