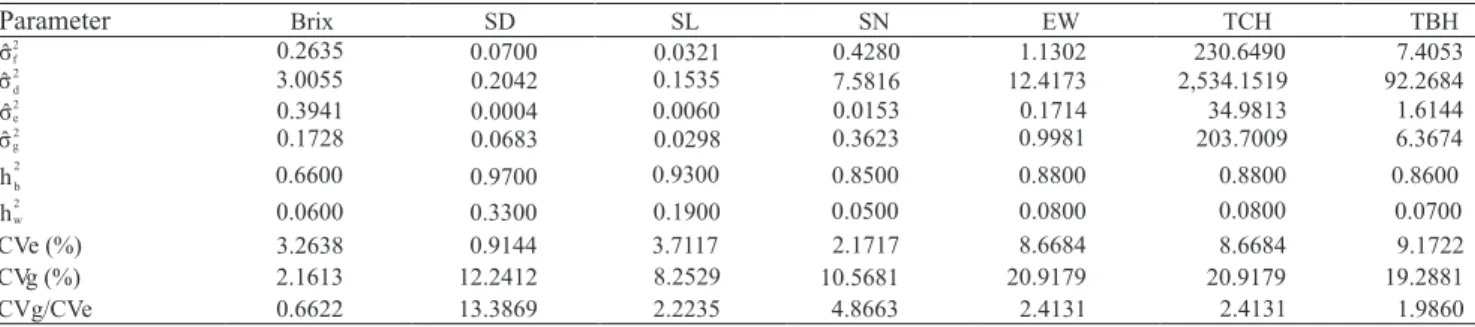
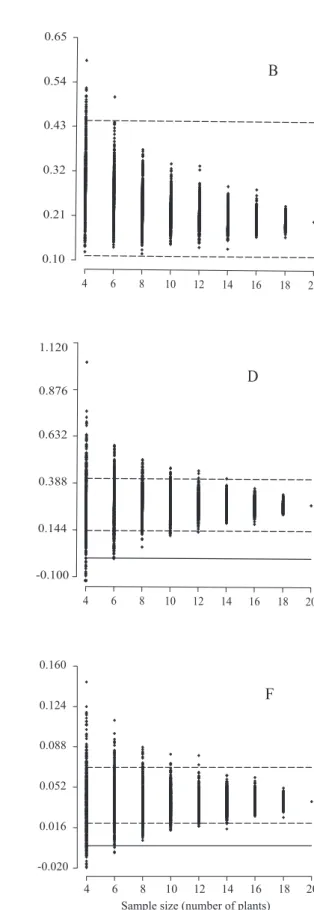
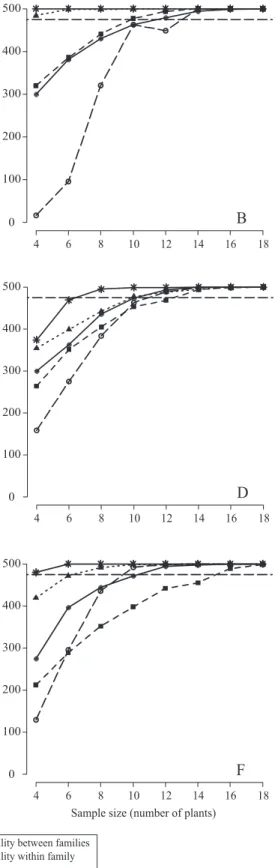
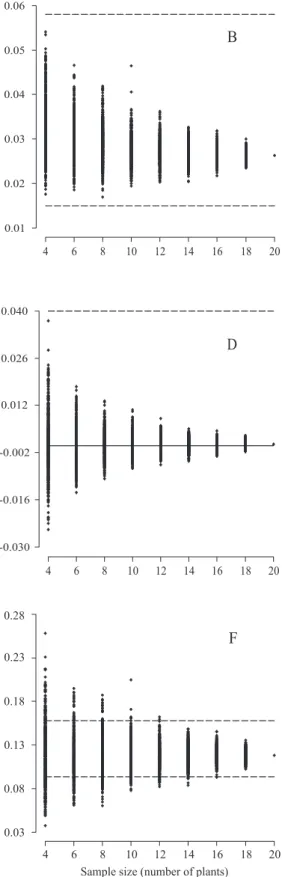
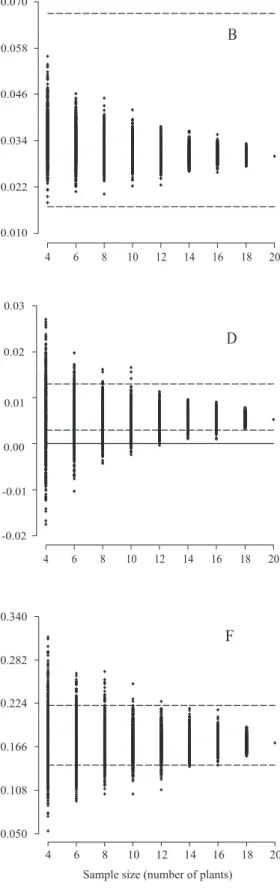
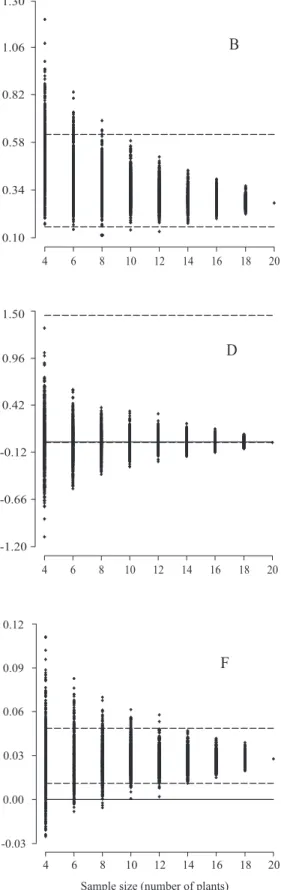
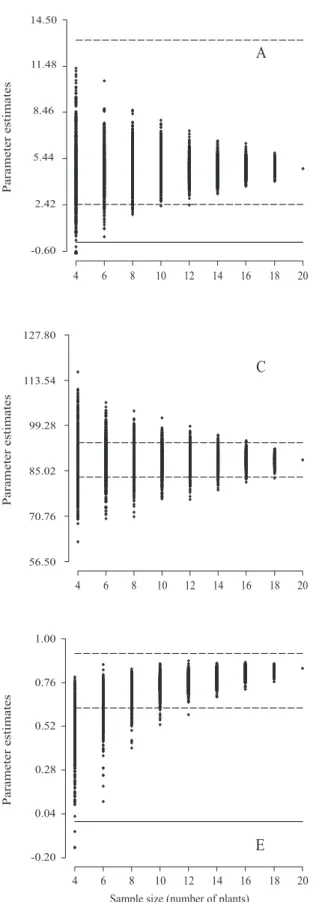
Mauro Sergio de Oliveira Leite , Luiz Alexandre Peternelli , Márcio Henrique Pereira Barbosa , Paulo Roberto Cecon(1) and Cosme Damião Cruz(1)
(1)Universidade Federal de Viçosa, Avenida P.H. Rolfs, s/no, CEP 36570‑000 Viçosa, MG, Brazil. E‑mail: mleite@ctc.com.br, peternelli@ufv.br,
barbosa@ufv.br, cecon@dpi.ufv.br, cruz@ufv.br
Abstract – The objective of this study was to determine the minimum number of plants per plot that must be sampled in experiments with sugarcane (Saccharum officinarum) full-sib families in order to provide an effective estimation of genetic and phenotypic parameters of yield-related traits. The data were collected in a randomized complete block design with 18 sugarcane full-sib families and 6 replicates, with 20 plants per plot. The sample size was determined using resampling techniques with replacement, followed by an estimation of genetic and phenotypic parameters. Sample-size estimates varied according to the evaluated parameter and trait. The resampling method permits an efficient comparison of the sample‑size effects on the estimation of genetic and phenotypic parameters. A sample of 16 plants per plot, or 96 individuals per family, was sufficient to obtain good estimates for all traits considered of all the characters evaluated. However, for Brix, if sample separation by trait were possible, ten plants per plot would give an efficient estimate for most of the characters evaluated.
Index terms: Saccharum officinarum, cane breeding, simulation, statistical methods, variance components.
Tamanho da amostra para avaliação de famílias
de irmãos completos em cana‑de‑açúcar
Resumo – O objetivo deste estudo foi determinar o número mínimo de plantas por parcela a ser amostrado em experimentos de famílias de irmãos completos, em cana-de-açúcar (Saccharum officinarum), para possibilitar a estimação eficiente de parâmetros genéticos e fenotípicos para características de produção. Os dados foram coletados em delineamento de blocos ao acaso, composto por 18 famílias de irmãos completos, com 6 repetições e 20 plantas por parcela. O tamanho da amostra foi determinado com o uso de técnicas de reamostragem com reposição, com posterior estimação dos parâmetros genéticos e fenotípicos. As estimativas do tamanho da amostra variaram de acordo com a variável e o parâmetro avaliados. O método da reamostragem permite uma comparação eficiente dos efeitos do tamanho da amostra na estimação de parâmetros genéticos e fenotípicos. Uma amostra de 16 plantas por parcela, ou seja, 96 indivíduos, por família, foi suficiente para obter estimativas fidedignas de todos os parâmetros avaliados em todas as variáveis consideradas. Porém, para a variável Brix, se fosse possível desmembrar a amostragem por característica, uma amostra de dez plantas por parcela já possibilitaria a estimação precisa da maioria dos parâmetros genéticos e fenotípicos avaliados.
Termos para indexação: Saccharum officinarum, melhoramento da cana, simulação, métodos estatísticos, componentes de variância.
Introduction
In order to increase the effectiveness of sugarcane breeding programs, family selection, a technique capable of identifying superior crosses, is being incorporated into the initial stages. Superior crosses must form the base population upon which individual selection will be done, with inferior progenies discarded in the early stages of the program (Bastos, 2005).
Family selection has been routinely employed in some sugarcane breeding programs in other countries
(Cox et al., 1996; Bressiani, 2001), especially for characters with family-based heritability higher than within individuals .
be formed by individuals that had not yet been cloned and that would jointly provide information on the genetic value of the evaluated families, as performed by Stringer et al. (1996).
In order to help optimize the resources available in a breeding program, research is being done to determine the number of individuals required for the
accurate and efficient representation of mean, variance
and other parameters. Barbosa et al. (2001) studied a population of 500 sugarcane plants and concluded that
50 individuals would suffice to estimate the production
of stalks, and that ten individuals per plot could be sampled to estimate the mean Brix of the families. Leite et al. (2006) found that plots with only two rows (14 plants), in experiments with six replicates, were
sufficient to estimate the genetic parameters required
in sugarcane family experiments. Family selection has been widely used in all Australian sugarcane breeding programs, where 20 plants per plot are routinely planted
in the first selection stage (Kimbeng & Cox, 2003). It is also important to define the size of the
reduction in sample size, namely the number of sampled individuals in the plots in family trials, which can reduce costs, permit the use of new methods , and also permit the testing of more families with the same resources available.
The objective of this study was to determine the minimum number of plants per plot that must be sampled in experiments with sugarcane full-sib families, in order
to enable the efficient estimation of some genetic and
phenotypic parameters of yield-related characteristics used in family selection.
Materials and Methods
The study used 18 full-sib families whose parents were elite clones and commercial varieties with good yields and early maturation. The crossings were carried out at the Serra do Ouro station of Universidade Federal de Alagoas, in Murici, Alagoas, Brazil (09°13'S, 35°50'W, 450 m a.s.l.). Seeds produced in these crosses were planted at the sugarcane breeding center (CECA) of Universidade Federal de Viçosa, in Oratórios, Minas Gerais, Brazil (20o25'S, 42o48'W, 494 m a.s.l.), in an Oxisol lowland area. The experiment started on April 12, 2004 using a randomized complete block design with six replicates and two tests: the RB72454 and RB855156 varieties.
Seedlings were obtained and transplanted as described by Barbosa & Silveira (2000).
The experiment comprised 120 plots covering a total area of 0.24 ha. Each plot consisted of two 5-m rows with ten plants each, with a spacing of 1.40 m between rows and 0.5 m within rows. Two rows of the RB855156 variety were planted around the experiment as a lateral border. The experimental area was fertilized at planting with 500 kg ha-1 of a formula containing 5% of N, 25% of P2O5 and 25% of K2O.
The following data were collected from the plant
cane in July 2005: Brix, measured at the fifth internode
from the base from one stalk per plant with a Brix hand refractometer; total number of stalks per plant; measurements of stalk diameter, taken with a caliper at the same internode sampled for Brix; measurements of stalk length, taken at the same stalk sampled for Brix. The measurements were done with a wooden ruler articulated at meter intervals, in order to facilitate following the curvature of the stalk.
Using the data on stalk number (SN), stalk diameter (SD) and stalk length (SL), an estimate was made of the weight of each plant, in kilograms, with the formula
EW = π x SN x SL x (SD/2)2 x d (Chang & Milligan, 1992); the volume of a stalk was considered to be equal to that of a cylinder, and the density was 1 g cm-3. The cane yield per hectare (TCH, in Mg ha-1) was estimated
using the expression: (EW x 10)/0.7, where 0.7 is the
footprint of each plant in square meter. Brix yield per hectare (TBH, in Mg ha-1) was calculated by the
equation: (TCH x Brix)/100.
The variables were analyzed using the statistical model (Cruz et al., 2004): Yijk = μ + Gi + Bj + εij + δijk, where Yijk is the observation obtained in the kth individual of the ith family evaluated in the jth block; μ is the overall mean of the experiment; Gi is the random effect of the ith family; Bj is the random effect of the jth
block; εij is the random effect of the variation between
families; and δijk is the random effect of the variation between plants, within the family.
[CVe (%) = 100 (ˆs2e )0.5/ –
X], genetic coefficient of variation [CVg (%) = 100 (ˆs2g)0.5/X–], CVg/CVe relation, broad-sense heritability between family (h2b = ˆs
2 g / sˆ
2 f) and broad-sense heritability within family (h2w = ˆs
2 g/sˆ
2 d); in which MSfamily is the mean square of families, MSEbetween is the mean square of error between the families, MSEwithin is the mean square of error within the families, n is the number of individuals in a family and b is the number of families.
To obtain the samples for comparison, each plant was considered a basic unit. The procedure used for the simulation of the new data set was an adaptation of the “bootstrap” resampling technique (Davison & Hinkley, 1997), which was summed up in the following steps: i, n random-size samples were removed from each plot of the original data to avoid repeating the sampled plants in the same sample, and eight sample sizes were tested (n was equivalent to 4, 6, 8, 10, 12, 14, 16 and 18 plants); ii, resamplings with replacement were carried out 500 times (Xie & Mosjidis, 1997, 1999), in
compliance with the first step, generating 500 new data
sets for each n value, in each variable evaluated; iii, for each data set generated, variance analysis was carried
out according to the model previously defined, and the
parameters of interest were estimated and stored in new vectors of corresponding estimates.
To evaluate the effect of sample size on the parameter estimates, an adaptation was made in the methodology of Xie & Mosjidis (1997, 1999), which uses scatter plots
of parameter estimates with their respective confidence intervals (CI). In the present study, the confidence
intervals for the values of the parameters estimated in the original data set (20 plants) were built according to the methodology presented by Barbin (1993), except for the heritabilities.
The expression presented by Knapp et al. (1985) was used to estimate confidence intervals for the heritability
between families. According to these authors, this
heritability is defined as 1 ‑ (θ2/θ1), and the intervals may then be estimated by the equation P{1 - [(M1/M2) F1‑α/2:gl2,gl1]-1 ≤1 ‑ (θ2/θ1) ≤[(M1/M2)Fα/2:gl2,gl1]-1} = 1 ‑ α. In the present study, M1 was considered the value estimated for the family mean square (MSfamily), M2 was the value estimated for the mean square error between families (MSEbetween), and θ1 and θ2 were the real values of the family mean square and mean square
error between families, respectively, while α is the level of significance.
To estimate the confidence intervals for the
heritability within families, 1,000 resamplings with replacement were taken from the original data set, and 1,000 estimates were obtained for this parameter. Next, values referring to 2.5 and 97.5% quantis, respectively, were chosen for the lower and upper limits of the
confidence interval. Algorithms were developed using
the R programming language (R Development Core Team, 2005) to automate the simulation procedures, analysis and estimation of the parameters presented, and also to apply the method proposed, and design the graphs.
Variable estimates of the genetic and phenotypic parameters were considered the true values of the parameter, since the data set studied was considered as the known population. Once full-sib families were used, there is only one genotypic variance estimate, since the estimates of the genotypic variance between and within families, for this family structure, have the same estimator, without considering the effects of dominance deviations.
Results and Discussion
The values of CVe (%) for all variables may be considered low (Table 1) when compared to data in the literature. Bressiani et al. (2002), who also studied the genotype x environment interaction in sugarcane families, evaluated the same variables studied here and found values from 1.49 to 11.81% for the variation
coefficient, concluding that these values showed good
experimental accuracy. Bastos (2001) found values of 1.91 to 10.11% for the same parameter in variables similar to those evaluated in this study. Bastos (2005) also demonstrated that the highest CVe (%) values are estimated for TCH and TBH. According to Jackson et al.
(1995), the residual coefficient of variation for TBH
varied from 14.2 to 23.1%, and for TCH, between 12.9 and 22.9%. Erazzú et al. (1996) presented estimates between 8.90 and 25.56% for sugar yield per hectare for this parameter.
The high values found for the heritability between families (Table 1) indicate that most phenotypic variation is caused by the variation in family effects. Similarly to Bastos (2001), the variables with the highest and lowest estimates of heritability between families were SD and Brix respectively. However, the estimates for heritability within families were very low, showing that, within families, phenotypic variance is higher than genotypic variance.
An explanation for the low heritability within families in experiments with individual information is that mean square within represents the phenotypic variance within families, and the estimates for this mean square are expected to be high, especially in the initial generations, due to the great variability found in the families. This has been observed in other experiments with families (Souza et al., 2000).
The dispersal of Brix estimates follows a general trend, according to which the variation within the 500 estimates increases as the sample size decreases (Figure 1). The mean of 500 estimates in each sample size tends to be close to the parametric value for most parameters, except for heritability between, where it tends to decrease with the sample size. As already mentioned by Cox et al. (1996) and Bressiani (2001), the reason may be that heritability based on family means is higher than that with individual plants. As the number of plants sampled decreases, the heritability estimate “between” tends to converge to the estimates at the individual level. It was observed that, for a certain sample size, the parameter estimates
tend to go beyond the limits of the confidence interval
(CI) (Figure 1).
Based on this, it is possible to observe (Figure 2) the number of estimates of each parameter located within the CI in each sample size, for all varieties. It is also possible to determine that a sample of ten plants would
be sufficient to estimate all the parameters proposed
for Brix, except for phenotypic variance within the plots (Figure 2 A), where a sample of 16 plants would be necessary, since the CI for this parameter is very strict (Figure 1).
The dispersion of parameter estimates of SD and the general tendencies were similar to those presented for Brix (Figure 3); for example, decrease in the variation estimate with increase in the number of sampled plants, and the proximity of the mean of 500 parameter estimates to the parametric value, for most parameters except for heritability between, in which the mean tends to decrease with the sample size. The same can be observed for all the other characters (Figures 4–7). As shown in Figure 2 B, a
sample of 12 plants would be sufficient to estimate all of
the parameters proposed for SD.
In a similar study with red clover heritability, Xie & Mosjidis (1997) reported frequent estimates of negative variance with decrease in the sample
size, mentioning the same problem in the definition
of the sample size for the estimation of the genetic correlation and ascribing it to sampling problems (Xie & Mosjidis, 1999).
Negative results for genotypic variance and heritability were also found for some variables in this work. This may have been due to the small number of families evaluated (18), which resulted in estimates of mean square within families higher than the mean square between families for the variables with high
Table 1. Estimates of the genetic and phenotypic parameters in sugarcane full-sib families for Brix, stalk diameter (SD), stalk length (SL), stalk number (SN), stalk estimated weight (EW), tons of cane per hectare (TCH) and tons of Brix per hectare (TBH), obtained with 20 plants per plot.
ˆ
s2
f, phenotypic variance between family means; ˆs 2
d, phenotypic variance within family; sˆ 2
c, environmental variance between family means; ˆs 2
g, genotypic
variance between and within families; h2b, broad-sense heritability between; h 2
w, broad‑sense heritability within; CVe (%), experimental coefficient of
Figure 2. Number of estimates placed within the confidence intervals built for the parametric values of the genotypic variance,
variability within families, generating negative estimates of variance components without sampling problems.
Stalk diameter and SN presented the smallest estimates for CVe (%), indicating good experimental accuracy, but SD presented the highest estimate for CVg (%), which indicates great genetic variability within the families, and SD, followed by SN, achieved
the highest values for CVg/CVe (above one unit),
showing that most of the variation occurring within families for these two characters had genetic rather than environmental causes (Table 1). Therefore, the problem here may not be sample size.
Stalk length presented similar general trends when compared to the other characters (Figure 4). According to Figure 2 C, a sample of 14 plants would be adequate to accurately estimate all the parameters for SL. The graphs for SN show a very similar general behavior to SD (Figure 5). Some negative estimates were obtained for genotypic variance in the four-plant sample size, probably from samples with the mean square between families higher than the family mean square. In other words, the determination of differences between the families would be impaired with this sample size. Figure 2 D demonstrates that 14 plants would also be enough to accurately estimate all of the SN parameters.
For TCH and TBH, the results are very similar to those already discussed (Figures 6 and 7). The explanation is that TCH is estimated according to EW, which, in turn, is estimated by an equation that depends on SD, SL and SN, and the TBH variable is a function of the TCH variable; thus, all the variability expressed in these characters is also expressed in the TCH and TBH variables. According to Figures 2 E and 2 F, 16 plants would be enough to accurately estimate both TCH and TBH.
Conclusions
1. Sample size estimates vary according to the evaluated parameter and variable.
2. Resampling permits an efficient comparison of
the effects of sample size on the estimation of genetic and phenotypic parameters.
3. A sample of 16 plants per plot, equivalent to 96 plants per family in the present work, is enough to achieve reliable estimates for all the parameters
and variables studied, in experiments with sugarcane full-sib families.
4. For Brix, if the separation of sampling by trait were
possible, ten plants per plot would permit an efficient
estimation of the parameters, except for phenotypic variance within the plots.
Acknowledgements
To Conselho Nacional de Desenvolvimento
Científico e Tecnológico and Coordenação de
Aperfeiçoamento de Pessoal de Nível Superior, for the fellowship and scholarship respectively; to Fundação de Amparo à Pesquisa do Estado de Minas Gerais, for funding this research; and to Rede Interuniversitária para o Desenvolvimento do Setor Sucroalcooleiro, for the opportunity to work together.
References
BARBIN, D. Componentes de variância: teoria e aplicações. Piracicaba: FEALQ, 1993. 120p.
BARBOSA, M.H.P.; PETERNELLI, L.A.; SILVEIRA, L.C.I. da. Plot size in sugarcane family selection experiments. Crop Breeding and Applied Biotechnology, v.1, p.271-276, 2001.
BARBOSA, M.H.P.; SILVEIRA, L.C.I. da. Metodologias de seleção, progressos e mudanças no programa de melhoramento
genético da cana‑de‑açúcar da Universidade Federal de Viçosa.
STAB, v.18, p.30-32, 2000.
BASTOS, I.T. Capacidade combinatória de clones e variedades de cana‑de‑açúcar (Saccharum spp.). 2001. 48p. Dissertação (Mestrado) - Universidade Federal de Viçosa, Viçosa.
BASTOS, I.T. Seleção, adaptabilidade e estabilidade genotípica de clones de cana‑de‑açúcar utilizando modelos mistos. 2005. 140p. Tese (Doutorado) - Universidade Federal de Viçosa, Viçosa.
BRESSIANI, J.A. Seleção seqüencial em cana‑de‑açúcar. 2001. 133p. Tese (Doutorado) - Escola Superior de Agricultura Luiz de Queiroz, Piracicaba.
BRESSIANI, J.A.; VENCOVSKY, R.; BURNQUIST, W.L.
Interação entre famílias de cana-de-açúcar e locais: efeito na resposta esperada com a seleção. Bragantia, v.61, p.1-10, 2002.
CHANG, Y.S.; MILLIGAN, S.B. Estimating the potential of sugarcane families to produce elite genotypes using univariate cross prediction methods. Theoretical and Applied Genetics, v.84, p.662-671, 1992.
COX, M.C.; MCRAE, T.A.; BULL, J.K.; HOGARTH, D.M. Family selection improves the efficiency and effectiveness of sugar cane
improvement program. In: WILSON, J.R.; HOGARTH, D.M.; CAMPBELL, J.A.; GARSIDE, A.L. (Ed.). Sugarcane: research
towards efficient and sustainable production. Brisbane: CSIRO
CRUZ, C.D.; REGAZZI, A.J.; CARNEIRO, P.C.S. Modelos biométricos aplicados ao melhoramento genético. 3.ed. Viçosa: UFV, 2004. v.1, 480p.
DAVISON, A.C.; HINKLEY, D.V. Bootstrap methods and their application. New York: Cambridge University, 1997. 582p.
ERAZZÚ, L.E.; CHAVANNE, E.R.; MARIOTTI, J.A. Aplicación
de dos métodos para estimar la estabilidad del comportamiento
productivo de genotipos de caña de azúcar (Saccharum spp.) en Tucumán, Argentina. Revista Industrial y Agrícola de Tucumán, v.73, p.37-43, 1996.
JACKSON, P.; BULL, J.K.; MCRAE, T.A. The role of
family selection in sugarcane breeding programs and the effect of genotype x environment interactions. Proceedings of the Australian Society of Sugar Cane Technology, v.22, p.261-270, 1995.
JACKSON, P.; MCRAE, T.A. Selection of sugarcane in small
plots: effects of plot size and selection criteria. Crop Science,v.41, p.315-322, 2001.
KIMBENG, C.A.; COX, M.C. Early generation selection of sugarcane
families and clones in Australia: a review. Journal of the American Society of Sugarcane Technologists, v.23, p.20-39, 2003.
KNAPP, S.J.; STROUP, W.W.; ROSS, W.M. Exact confidence
intervals for heritability on a progeny mean basis. Crop Science, v.25, p.192-194, 1985.
LEITE, M.S. de O.; PETERNELLI, L.A.; BARBOSA, M.H.P. Effects of plot size on the estimation of genetic parameters in sugarcane families. Crop Breeding and Applied Biotechnology, v.6, p.40-46, 2006.
R DEVELOPMENT CORE TEAM. R: a language and environment for statistical computing. Vienna: R Foundation for Statistical Computing, 2005.
SOUZA, E.A. de; GERALDI, I.O.; RAMALHO, M.A.P. Alternativas experimentais na avaliação de famílias em programas
de melhoramento genético do feijoeiro. Pesquisa Agropecuária Brasileira, v.35, p.1765-1771, 2000.
STRINGER, J.K.; MCRAE, T.A.; COX, M.C. Best linear
unbiased prediction as a method of estimating breeding value in sugarcane. In: WILSON, J.R.; HOGARTH, D.M.; CAMPBELL, J.A.; GARSIDE, A.L. (Ed.). Sugarcane: research towards efficient and sustainable production. Brisbane: CSIRO Division of Tropical Crops and Pastures, 1996. p.39-41.
XIE, C.; MOSJIDIS, J.A. Influence of sample size on precision of
genetic correlations in red clover. Crop Science, v.39, p.863-867, 1999.
XIE, C.; MOSJIDIS, J.A. Influence of sample size on precision of
heritability and expected selection response in red clover. Plant Breeding, v.116, p.83-88, 1997.