REFERÊNCIA
SALES, Luciano da Silva Bastos; AUGUSTO, Rodrigo; BARBALHO, Sanderson César Macêdo. Application of the “success to the successful” archetype in a case study to demonstrate the
importance of benefits management in the program management. In: ENCONTRO NACIONAL DE ENGENHARIA DE PRODUÇÃO, 37., 2017, Joinville. Anais eletrônicos [...]. Rio de Janeiro: ABEPRO, 2017. Disponível em: http://www.abepro.org.br/publicacoes/index.asp?
CASE STUDY TO DEMONSTRATE THE
IMPORTANCE OF BENEFITS
MANAGEMENT IN THE PROGRAM
MANAGEMENT
Luciano da Silva Bastos Sales (UnB)
Rodrigo Augusto (UTA)
Sanderson Cesar Macedo Barbalho (UnB)
Many organizations still run programs as large projects. Such organizations are unable to properly manage benefits, which is the key feature program management can deliver. The practical consequence of such a gap in program management understanding is that projects that should work together in a coordinated fashion, aiming to deliver the maximum benefits, end up instead competing one against another. In this work, we argue that this situation fits into the Success to the Successful archetype, which is just one of system archetypes in which an organization can fall in due to improper program management. Falling into such a trap thus represents compromising organizations’ internal decision structures as well as overshadowing long-term potential benefits that could be derived from the initiatives they are
2
carrying out. We use the Connected Amazon Program, a Brazilian Government initiative as case study. Using real data, we use System Dynamics to model and run a simulation that demonstrates the results obtained before and after a proper program’ structure was in place. In practice, it was identified that the incorporation of program management practices can improve decision making in the strategic initiatives, thus avoiding that projects’ delivered capabilities will never become benefits for the organizations involve.
Palavras-chave: System Dynamics; Project Management; Program
3
1. Introdução
Would programs be only large projects or do they represent something unique? This question was made by Artto et al (2009) in a paper that discusses the foundations of program management. To Walenta (2015), programs and projects are so different that it is necessary to promote, within the organizations the idea that the separation between projects and programs is critical to the success of both.
Miterev et al. (2016) states that to build a theory about program management based in the assumptions and literature of project management is a great mistake, since a series of studies have demonstrated deep differences between programs and projects. Pellegrinelli, et al. (2007) believe that programs are phenomena qualitatively different from projects and that organizations that see programs as large projects are using the right remedy to the wrong problem, and as such, lose most of the benefits that they could realize.
Considering, as pointed out by the literature, that there exist fundamental differences between projects and programs, if program managers are to be using solely project management tools and techniques in order to conduct programs, we can imagine that most of these initiatives will not meet the expected benefits, since, to The Standard for Program Management (SPM), Third Edition – PMI, 2013 and the Managing Successful Programmes (MSP) – TSO, 2011, the central focus for programs to be considered successful is related to benefits management. Senge (1996) states that from the perspective of systemic thinking, some patterns and structures are recurrent within the organizations. The aforementioned researcher calls these patterns as “system archetypes”, showing that not all management problems are specific of a particular organization. According to Braun (2002), the system archetypes describe common behavioral patterns in the organizations, must be understood as diagnosis tools that provide information and that alert managers for future unexpected consequences of their decisions. As observed by Braun (2002) and Senge (1996), the tools of system dynamics (SD) are the basis for the identification of system archetypes, whose understanding contributes to the
4 solution of knowledge fraction problem. In this perspective, it would be plausible to suppose that the lack of program management knowledge could generate system archetypes in the organizational decision-making structure that conducts projects and programs, thus generating in these initiatives structural errors or leading them to failure.
In this problem context, the use of program management will be analyzed as an alternative to
project management through the following research question: how system archetypes can be
used by organizations to understand the losses coming from the lack of use of program management practices - losses that can lead to strategic initiatives failure? As such, the goal of this paper is to identify and describe how SD, through system archetypes, can be used to demonstrate the importance of benefits management, leading organizations to choose which practices are more suitable for them to conduct their initiatives.
In order to fulfill this goal, it will be presented in section 2, how benefit management is critical to a program, the concepts related to SD and the system archetypes; in section 3, research method related questions; in section 4, the analysis of results; in section 5, the conclusions of this work, limitations and future research.
2. Theoretical Background
2.1. Programs, projects and benefits management
To PMI (2013), a program is understood as a group of related projects, subprograms and activities that are managed in a coordinated way for benefits obtainment that would not be available if they were managed individually. To TCO (2011), a program is a temporary and flexible organization, created to coordinate, drive and supervise the implementation of a group of related projects, aiming to deliver results and benefits aligned the organizational strategic objectives.
Rijke et al. (2014) justify that the separation between projects and programs must occur because the relationship of the program to its projects is completely different from the relationship of the project to its deliveries and work packages. Pellegrinelli (2011) states that,
5 organized within a program, projects can become islands of order, with relative stability and predictability, focused in the delivery of their objectives, although distinct, but well-defined and directed by an integrating management.
Thiry (2010), states that there exist four main elements intrinsic to programs that are enough for maintaining their sustainability, maturity and excellence: the management of decisions, the management of benefits, the management of stakeholders and the program governance. Between these, he opines that the management of benefits is the most important.
According to Breese et al. (2015), a fundamental principle behind the relationship between projects and programs is to deliver capabilities that are needed but are not enough to generate benefits. This way, it is the combination of all projects required within a program that generates benefits, and that when managed in a coordinated way, generate value to the organizations.
In TCO (2011), the logic behind the concepts of capacity and benefits can be found. As presented in Figure 1, the outputs of the projects build a new capability. This new capability will enable the outcomes (results), as long as a new operational state is achieved after the transition of the new capabilities to the operational environment. The results realize the planned benefits, and those contribute to one or more corporate objectives.
6 Source: Adapted from TCO (2011)
2.2. System Dynamics
System Dynamics (SD) was introduced by Forrester as a method for modeling and analysis of the behavior of complex industrial systems. It is a proven effective method for modeling and analysis of complex, dynamic and non-linear variables that interact with each other, being widely used in simulations, as it allows the analysis of the effect of changes in the variables through time as well as the transmission of information among these variables (Zhang, Wu, Shen & Skitmore, 2014).
To Forrester (2009), in SD, every model for decision taking involves three fundamental elements: the outcome one expects to achieve; the action to be taken in order to achieve the outcome; and the information that connects the action to the result. The modeling of systems can be classified in two types: soft, more subjective and focused on the qualitative aspect and in the systemic learning; and hard, with a quantitative focus and aimed at simulation and decision making (Forrester, 2009).
Soft modeling can be represented through causal loop diagrams, influence, feedback or loop – that enables a greater comprehension by the simplicity of their construction and representation (Sterman, 2000). Such diagrams represent the model variables and the cause-effect relations
7 among the variables, allowing to identify the interactions and influences in the dynamics of the system structure. To Forrester (2009), the causal loop diagrams have two important goals. The first is to serve as a draft of the causal hypothesis; while the second is to simplify the design of the model to be build for the simulation.
The hard modeling, on the other hand, can be represented through the stock and flow diagrams, that because demand greater detailing of the system’s functional behavior, allows mathematical approaches to be developed focusing on computational simulations (Sterman, 2000).
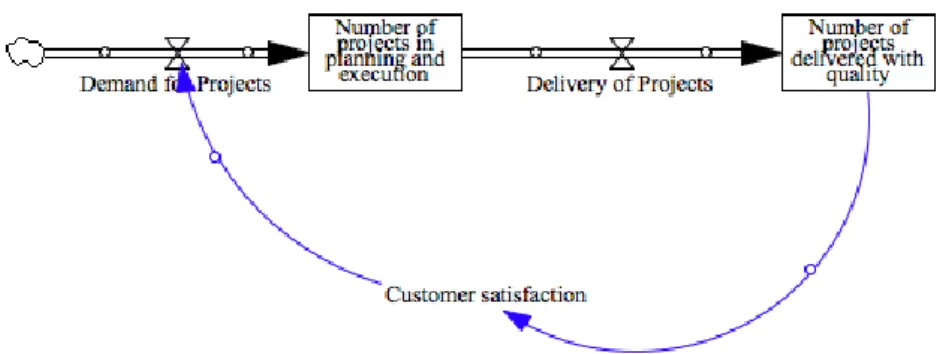
Figure 2 presents a feedback cycle in which an organization that develops projects wishes to measure the effects generated by demand increase. The stock represented by variable “Number of Projects in Planning and Execution”, accumulates the flow of projects originated in the flow “Demand for Projects”. As the first stock increases, the other variables related to the number of people that develop these projects stay steady, and the flow “Project Delivery” begins to diminish. With delays and possible rework, the stock “Number of Projects delivered with Quality” begins to diminish, directly impacting customer satisfaction. As customer satisfaction decreases, the flow “Demand for Projects” begins to slow down (balancing loop), thus resulting in incoming losses and damage to the organizational image.
Figure 2 - Flow and stock diagram
8
2.3. System Archetypes
System archetypes were introduced as a formal and independent way to classify structures responsible for generic patterns of behavior in the organizations through time, particularly counter-intuitive behaviors (Wolstenholme, 1990).
To Wolstenholme (2003), such structures consist in intended actions and unexpected
reactions, being used to help generate comprehension and to accelerate organizational
learning. According to Spicar (2014), system archetypes are general patterns found in diverse fields of knowledge, the causal loop diagram being used for their identification.
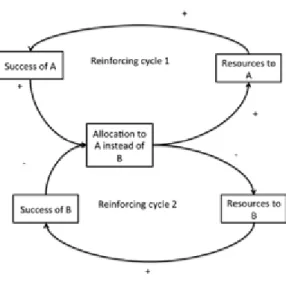
One archetype example, the “Success to the Successful”, according to Senge (1996), occurs when two activities compete for support or resources. The more successful one of them becomes, the more it secures support, thus weakening the other. As shown in Figure 3, the aforementioned archetype is composed by two reinforcing processes, with the top cycle representing the success of initiative A, due to it receiving a little more of resources, considering that A reached a more rapid initial result. With the initial penalty suffered by activity B, the reinforcing cycle creates a negative spiral that cripples the possibility of development for this activity.
9 Source: Adaptated from Senge (1996)
Following, in Figure 4, it is presented a summary with the main characteristics of the archetypes cited by Senge (1996).
10 Source: Senge (1996)
3. Methodology
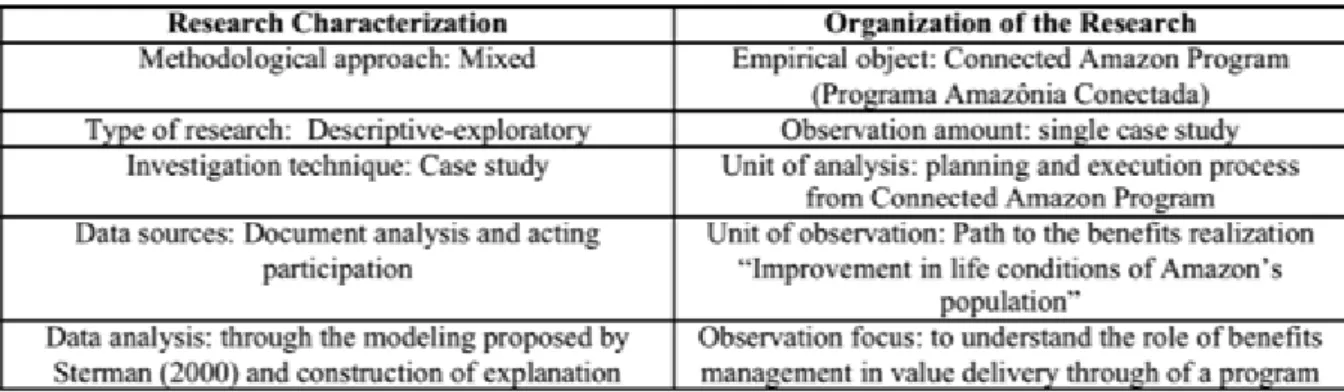
In this study, under a descriptive-exploratory purpose, it was used the modeling process based in the proposal of Sterman (2000). The analysis unit is process of planning and executing the
Connected Amazon Program (CAP). As such, the research object is the CAP itself, which is an initiative from the Brazilian Government, focusing on the implementation of a telecommunications infrastructure at Amazon, through 05 (five) information highways that use underwater optical fiber cables linking 52 cities in the Brazilian State of Amazonas. The main benefit to be delivered by the program will be an effective improvement in the life conditions to the population living at Brazilian Amazon. In the first 12 months of the program (2015), it was decided that all resources would be invested in a pilot subproject of the Infovias
11 Project, connecting two cities. This decision was made because of the political visibility of the new capabilities, which would facilitate future investments.
All data used in this research were conceded to the researchers by CAP, through public documents available on its website. The data collection source was given by the document analysis of the main documents that contributed to the planning and execution of the program, as well as through active participation by the researchers.
As such, from the selected documents onwards, a quantitative modeling was built based on the proposal of Sterman (2000), in 5 (five) steps:
- Articulation of the problem, meaning, what motivates the modeling and its key variables;
- Hypothesis formulation using the mapping of causal loop and flow and stock diagrams from system dynamics;
- Formulation of the simulation model with real data;
- Test realization aiming to consolidate the models’ robustness; e
- Evaluation, in other words, once the simulation model generates trust, it is possible to elaborate strategies in order to overcome the identified problems.
In Figure 5 it is presented a summary of all methodological key aspects used in this research.
12 Source: The authors
4. Analysis of Results
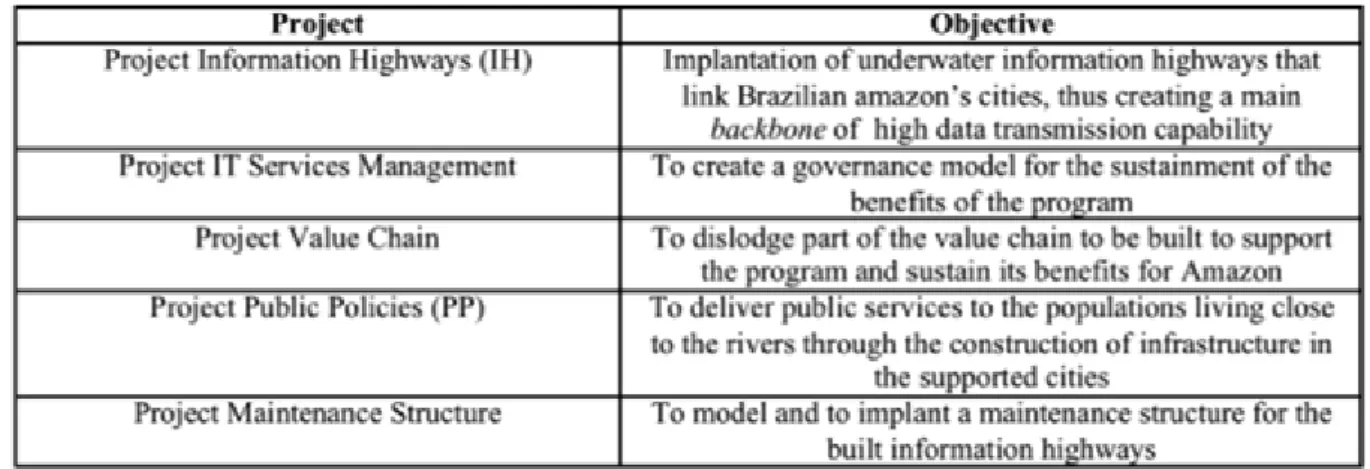
CAP was established through 05 (five) component projects, as presented in Figure 6, below: Figure 6 - Constituent Projects of CAP
Source: www.amazoniaconectada.eb.mil.br
The CAP, among other benefits it intends to deliver, has as main strategic orientation, to improve the life conditions of Amazon’s population. This benefit, as can be seen through the program’s map of benefits (Figure 7), will only succeed if met, as result, the effective delivery of IT services (with quality) to the interior of Amazon, which will represent an effective improvement of the population’s life conditions.
13 Source: www.amazoniaconectada.eb.mil.br
Following the proposal from Sterman (2000), in the first step of the research, it was attempted to clearly define the problem being focused by the to be developed modeling: CAP would deliver value to the population over the course of the first 48 months of activities, in case the evaluation of its progress would be related to the capabilities delivered by its projects? In which way could benefits management prevent the formation of system archetypes that cause the development of the program to become vicious? Besides this, still in the first step, it is necessary to identify the key variables of the problem. In Figure 8, below, important variables were identified by the program’s team.
14 Figure 8 - Variables for modeling
Source: www.amazoniaconectada.eb.mil.br
The second step of the modeling is the development of hypothesis through the construction of causal loop (qualitative) and flow and stock (quantitative) diagrams. Two projects were chosen: the Information Highways and Public Policies projects. This choice is directly linked to the existence of data for analysis, as they are the projects that contribute for reaching the focus benefit of the observation unit.
According to documents available in the Program’s website, Information Highways Project is moving forward more rapidly than Public Policies Project, one of the reasons being related to the visibility of the first Project, which makes it more capable for obtaining financing. It is also related to the natural challenge faced by the second Project, as the cities have their own dynamics and interests. This is shown in the causal loop diagram of Figure 9.
15 Figure 9 - Interaction between capabilities of Information Highways and Public Policies
Source: The authors
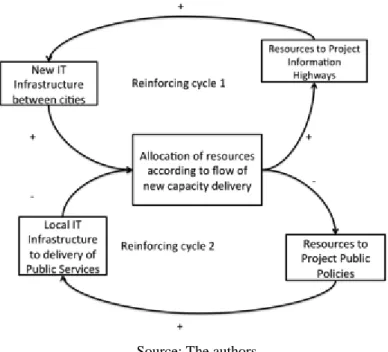
The modeling identified two reinforcing cycles, the first (R1) represents the resource allocation dynamics to the Information Highways project, where the creation of an infrastructure among the cities generated capabilities in a faster way, thus creating incentives to this same Project with more resources, in detriment of Public Policies project (R2), thus reducing its possibilities of new capabilities delivery.
The diagram presented in Figure 9 (in 3 parts) is known in the literature as the Success to the Successful archetype. To Braun (2002), this archetype suggests that success or failure can occur more due to initial conditions than the intrinsic merits of the initiatives. Through this archetype, managers can find out that the current performance can be one more of the initial conditions.
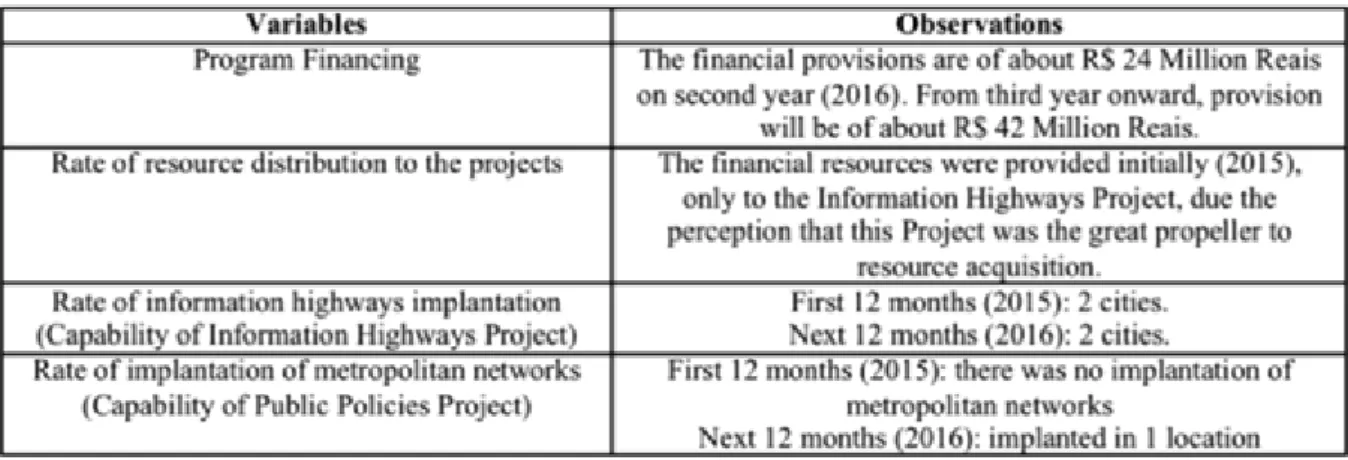
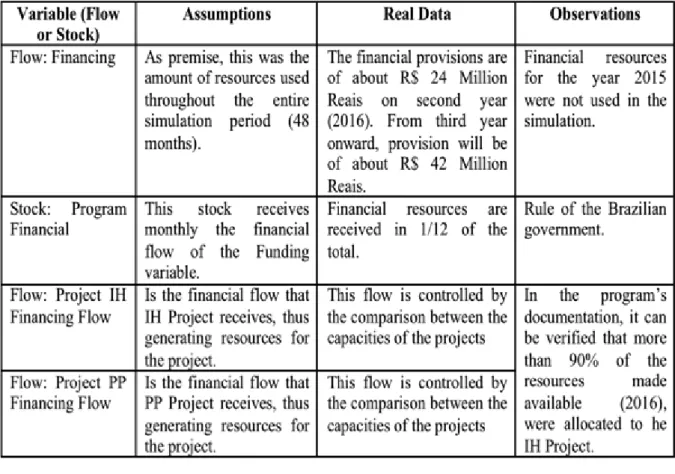
16 Figure 9 - Data used in the modeling (Part 1)
17 Figure 9 - Data used in the modeling (Part 2)
18 Source: The authors
19 Source: The authors
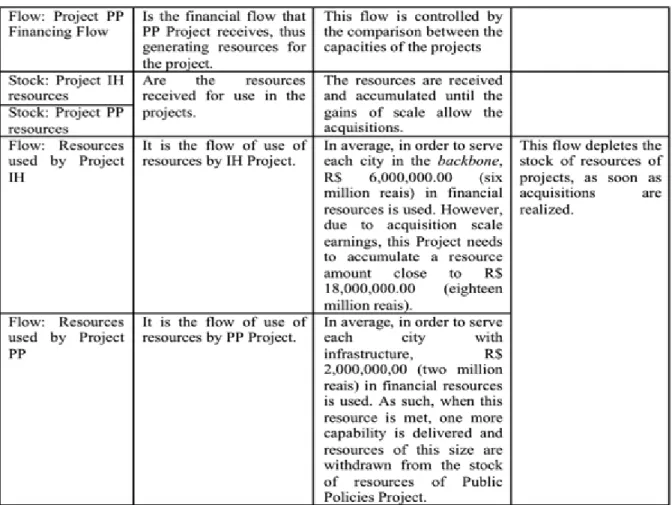
As the source of funding for CAP is the same for all projects (public resources), if the flow of funding depends solely in the comparison of the new capabilities delivered by the projects, a financial advantage is granted to the project that has an initially more rapid delivery. The next step was to model the flow and stock diagram for the understanding of the future consequences of current decisions, as presented in Figure 10.
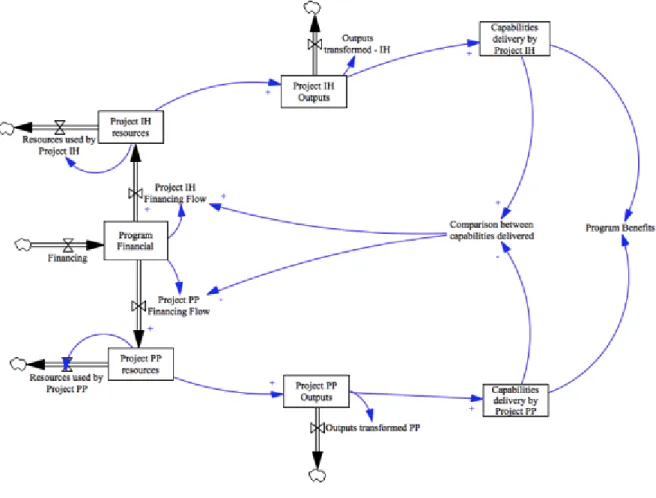
20 Figure 10 - Flow and Stock diagram - capabilities of Information Highways Project and Public Policies Project.
Source: The authors
The variable “Program Benefits” was included, for the understanding of how benefits are impacted by the financial policy being adopted. Also in Figure 10, one realizes that the benefit “Improvement in the conditions of population of Amazon” only is reached if the results delivered by both projects are realized. We also present the current dynamics of decision making, which was defined by the sponsors of the program: the funding depends almost entirely on the comparison of new delivered capabilities by the projects. The faster a project delivers a new capability, the faster it will have access to new financial resources.
The third step is the formulation of the simulation model, with the inclusion of real world variables in the model developed in the previous step (Figure 11).
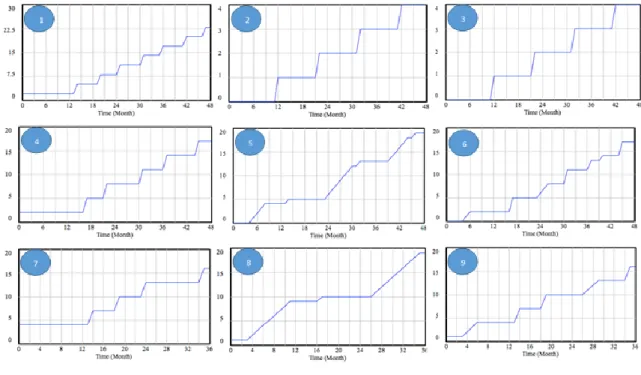
21 The fourth step is the conducting of tests in the built model, aiming to verify if the conceptual model gets close to the real world. In charts 1, 2 and 3 of Figure 12, a first scenario is presented, where one can verify the potential for capabilities that will be delivered by the program in 48 months. The first 12 months were simulated with historical data, thus presenting results compatible to the current reality of the program: approximately 4 cities (or new locations) were served. We thus predict the scenario shown in chart 1, in that, within the upcoming 36 months, the Information Highways project will deliver, approximately 23 cities in total.
Figure 12 - Simulation conceptual models.
Source: The authors.
The capabilities delivered by Information Highway Project, are also close to reality, with only one city served at the moment. The prediction for the upcoming 36 months, in case the focus of the resource distribution was solely aimed at the comparison between both projects, would be serving only four cities in total as shown in chart 2. In such way, the benefits would be limited to the capabilities delivered by the Public Policies project, with only 4 cities effectively receiving the benefits of the National Broadband Plan, as shown in chart 3.
22 Aiming to improve decision making, and already focusing on step 5 of the model proposed by Sterman (2000), two small modifications to the simulation model were done, with the financial flow no longer being controlled based on delivery of capabilities, but by the joint delivery of results by both projects under analysis, in other words, focusing long term benefits. In this way, the variable “Comparison between capabilities delivered” will control the results delivered jointly by the projects, focusing on the benefits, changing the distribution of resources to the projects, focusing on the overall result.
The aforementioned changes leads us to scenario 2, presented through charts 4, 5 and 6 of Figure 12, where one can verify a considerable change in the program benefits delivery reality. The focus in the benefits is now considered since the very start of program. The total capabilities delivered by Information Highways Project in 48 months comprehend 17 cities as shown in chart 4, however, as shown in chart 5, Public Policies Project delivers infrastructure (capabilities) at 19 cities, the number of cities benefited by the National Broadband Plan rising to 17, in other words, a growth that is superior to 300% as demonstrated by the comparison between charts 3 and 6.
Through charts 7, 8 and 9 of Figure 12, a third and more realistic scenario, true to what happened in the real life situation of our case study, is also tested. The first 12 months (2016) occurred while the archetype was in effect. Therefore, at the end 2016, as shown in chart 7, the total capabilities delivered by Information Highways Project comprehend 4 cities, and Public Policies Project delivers infrastructure (capabilities) at 1 city, as shown in chart 8. As the simulation progress through the next 36 months, now representing a behavioral shift that allows for focus on the benefits, we realize major changes to the program’s trends.
The total capabilities delivered by Information Highways Project in 48 (12 + 36) months end up comprehending 16 cities, and Public Policies Project delivers infrastructure (capabilities) at 19 cities, the number of cities benefited by the National Broadband Plan rising to 16, in other words, a growth that is equal to 300%, as it is evident when charts 3 and 9 are compared. The explanation for this major improvement lies in the fact that in the third
23 scenario, the resource distribution between projects is controlled by the results achieved jointly by both of them (from 13° month going forward).
As such, through the use of the model presented, the concept of the management of benefits and their control performed dynamically, from the delivery of capabilities by the projects onwards, allows for its better assimilation by strategic decision makers, representing a more balanced focus on the choices related to the program’s component projects.
5. Conclusion
We aimed to describe how System Dynamics, through system archetypes, demonstrate the importance of benefits management, applied inside a proper program management context, thus leading organizations to better conduct their strategic initiatives. Literature showed
consistent differences between project and program management. Such differences can lure
even the best managers, towards taking wrongful decisions, impairing the execution of the initiatives being carried out by organizations, and resulting in the lack of value, or benefits. To avoid falling in such pitfalls, the recommendation proposed through the results of this study is that one must incorporate program management practices, in particular, the focus on
benefits management, so that the archetypes can be avoided in organizational initiatives. The
decision structure of programs or their governance structure need to focus on benefits, even if said benefits only represent future, long term outcomes.
Our conclusion is that the incorporation of program management practices can improve decision making in the strategic initiatives, thus preventing the occurrence of the harmful situation where delivered capabilities by individual projects will never become benefits for the organizations (or people) involved.
The main limitation of our work regards to the fact that this research is restricted to a single case study, thus not allowing one to generalize any of its results. As future works we propose: the identification of new archetypes, typical in a program management context, yet unidentified in the literature; the use of simulation models to prevent major public
24 undertakings of failing to deliver the intended benefits to the population; and finally, the identification of SD tools that can be integrated into program management practices.
References
ARTTO, K.; MARTINSUO, M.; GEMUNDEN, H; MURTOARO, J. Foundations of program management: A bibliometric view. International journal of Project Management, 27, p-18, 2009.
BREESE, R.; JENNER, S.; SERRA, C.E.M.; THORP, J. Benefits management: Lost or found in translation.
International journal of Project Management, Vol 33, No 7, p 1438-1451, 2015.
BLAIR, D.G. Enhancing trust in government: adoption or program management discipline can help government improve program delivery and service. Public Administration Review, USA, vol 75, No 6, p 780-790, 2015. BRAUN, W. The System Archetypes. 2002
FORRESTER, J. Some basic concepts in system dynamics. In: Report Nr D-4894. Massachusetts Institute of Technology, Sloan School of Management. 2009.
MAYLOR, H.; BRADY, T.; COOKE-DAVIES, T.; HODGSON, D. From projectification to programmification.
International journal of Project Management, Vol 24, No 8, p 663-674, 2006.
MITREV, M.; ENGWALL, M.; JERBRANT, A. Exploring program management competences for various program types. International journal of Project Management, Vol 34, No 3, p 547-557, 2016.
PELLEGRINELLI, S. The importance of context in programme management: An empirical review of programme practices. International journal of Project Management, Vol 25, No 1, p 41-55, 2007.
PELLEGRINELLI, S. What's in a name: Project or programme? International jornal of Project Management, Vol 29, No 2, p 232-240, 2011.
Project Management Institute. SPM. USA: Author. 2013.
RIJKE, J.; Herk, S.; Zevenbergen, C.; Ashley, R.; Hertogh, M.; Heuvelhof, E. Adaptative programme management through a balanced performance/strategy oriented focus. International journal of Project
Management, Vol 32, No 7, p 1197-1209, 2014.
SALES, L.; ROSES, K.; PRADO, H. A utilização do Scorecard Dinâmico na Governança de TI. 10th
CONTECSI, São Paulo, SP, Brasil. 2013.
SENGE, P. M. A Quinta Disciplina: A arte e a prática da organização que aprende. Rio de Janeiro, RJ: Best Seller. 1996.
SPICAR, R. System Dynamics Archetypes in Capability Planning. Procedia Engineering 69, 1350-1355, 2014. STERMAN, J. Business Dynamic: System Thinking and Modeling a Complex World. Boston: USA: McGraw-Hill. 2000.
25 THIRY, M. Program Management. Farnham, UK: Gower Publishing Limited. 2010.
WALENTA, T. Projects & Programs are two different animals, don't underestimate the gap. In: WORLD CONGRESS INTERNATIONAL PROJECT MANAGEMENT ASSOCIATION, 29, 2015, Westin Playa Bonita, Panama.
WOLSTENHOLME, E. System Enquiry – a System Dynamics Approach. Wiley: Chichester. 1990. WOLSTENHOLME, E. Towards the definition and use of a core set of archetypal structures in system dynamics. System Dynamics Review, Vol. 19, No. 1, p 7–26, 2003.
ZHANG, X., WU, Y., SHEN, L., SKITMORE, M. A prototype system dynamics model for assessing the sustainability of construction projects. International Journal of Project Management, Vol 32, No 1, p 66-76, 2014.