Monocarboxylate transporters (MCTs) in
gliomas: expression and exploitation as
therapeutic targets
Vera Miranda-Gonc¸alves, Mrinalini Honavar, Ce´line Pinheiro, Olga Martinho,
Manuel M. Pires, Ce´lia Pinheiro, Michelle Cordeiro, Gil Bebiano, Paulo Costa,
Isabel Palmeirim, Rui M. Reis, and Fa´tima Baltazar
Life and Health Sciences Research Institute (ICVS), School of Health Sciences, University of Minho, Campus Gualtar, Braga, Portugal (V.M.-G., C.P., O.M., R.M.R., F.B.); ICVS/3B’s-PT Government Associate Laboratory, Braga/ Guimara˜es, Portugal (V.M.-G., C.P., O.M., R.M.R., F.B.); Department of Pathology, Hospital Pedro Hispano, Matosinhos, Portugal (M.H.); Unit of Neuropathology (M.M.P.); Department of Neurosurgery, Centro Hospitalar do Porto, Porto, Portugal (C.P.); Hospital Dr. Ne´lio Mendonc¸a, Madeira, Portugal (M.C., G.B.); Radiotherapy Service, Centro Hospitalar do Montijo, Barreiro, Setu´bal, Portugal (P.C.); Regenerative Medicine Program, Departamento de Cieˆncias Biome´dicas e Medicina, Universidade do Algarve, Faro, Portugal (I.P.); and IBB – Institute for
Biotechnology and Bioengineering, Centro de Biomedicina Molecular e Estrutural, Universidade do Algarve, Faro, Portugal (I.P.); and Molecular Oncology Research Center, Barretos Cancer Hospital, Sa˜o Paulo, Brazil (R.M.R.)
Background. Gliomas exhibit high glycolytic rates, and monocarboxylate transporters (MCTs) play a major role in the maintenance of the glycolytic metabolism through the proton-linked transmembrane transport of lactate. However, their role in gliomas is poorly studied. Thus, we aimed to characterize the expression of MCT1, MCT4, and their chaperone CD147 and to assess the ther-apeutic impact of MCT inhibition in gliomas.
Methods. MCTs and CD147 expressions were character-ized by immunohistochemistry in nonneoplastic brain and glioma samples. The effect of CHC (MCT inhibitor) and MCT1 silencing was assessed in in vitro and in vivo glioblastoma models.
Results. MCT1, MCT4, and CD147 were overexpressed in the plasma membrane of glioblastomas, compared with diffuse astrocytomas and nonneoplastic brain. CHC de-creased glycolytic metabolism, migration, and invasion and induced cell death in U251 cells (more glycolytic) but
only affected proliferation in SW1088 (more oxidative). The effectiveness of CHC in glioma cells appears to be de-pendent on MCT membrane expression. MCT1 downre-gulation showed similar effects on different glioma cells, supporting CHC as an MCT1 inhibitor. There was a syner-gistic effect when combining CHC with temozolomide treatment in U251 cells. In the CAM in vivo model, CHC decreased the size of tumors and the number of blood vessels formed.
Conclusions. This is the most comprehensive study report-ing the expression of MCTs and CD147 in gliomas. The MCT1 inhibitor CHC exhibited tumoral and anti-angiogenic activity in gliomas and, of importance, en-hanced the effect of temozolomide. Thus, our results suggest that development of therapeutic approaches target-ing MCT1 may be a promistarget-ing strategy in glioblastoma treatment.
Keywords: CD147, CHC, glioblastomas, gliomas, glycolytic metabolism, lactate, monocarboxylate transporters.
G
liomas, the most common primary centralnervous system (CNS) tumors, have distinct his-tological subtypes and, according to the latest World Health Organization (WHO) classification, are
divided into 4 malignant grades.1 Glioblastomas
Corresponding Authors: Fa´tima Baltazar, PhD, Life and Health Sciences Research Institute (ICVS), School of Health Sciences, University of Minho, Campus de Gualtar, 4710-057 Braga, Portugal (fbaltazar@ecsaude.uminho.pt); Rui M. Reis, PhD, Life and Health Sciences Research Institute (ICVS), School of Health Sciences, University of Minho, Campus de Gualtar, 4710-057 Braga, Portugal (rreis@ecsaude.uminho.pt).
Received January 2, 2012; accepted October 17, 2012.
Advance Access publication December 20, 2012
(WHO grade IV) are not only the most frequent, but also the most aggressive CNS tumors. Despite progress in therapy, prognosis of patients with glioblastoma is still very dismal. The current gold standard therapy strategy combines temozolomide with radiotherapy, with an
overall survival of only approximately 15 months.2
Tumor cells present uncontrolled cell proliferation, and during cancer progression, there are selective active processes, namely adjustments of energy
metabo-lism, to fuel cell growth and division.3,4A classical
phe-nomenon that describes this metabolic adaptation is a shift from oxidative phosphorylation to aerobic glycoly-sis, as a main source of ATP, even in the presence
of oxygen, known as the Warburg effect.5–7 The high
rates of glycolytic metabolism produce high levels of
lactate/H+ (lactic acid), and to maintain the enhanced
glycolytic flux and intracellular physiological pH, tumor cells perform the efflux of lactic acid into the ex-tracellular microenvironment, preventing inex-tracellular
acidosis and consequent cell death.8 Therefore, tumor
cells upregulate pH regulators, such as monocarboxylate
transporters (MCTs), among others.9
The MCT family comprises 14 members with similar topology; however, only 4 isoforms (MCT1 – MCT4) are proton-linked monocarboxylate transporters, perform-ing the transmembrane transport of monocarboxylates, such as lactate, coupled with a proton, in an equimolar
manner.10,11Monocarboxylate transporters play an
im-portant role in mammalian metabolism by regulating
distinct pathways.12,13In the adult brain, MCT1 is
ex-pressed in endothelial cells of microvessels and in astro-cytes. MCT2 is expressed in neurons, and MCT4 is
present exclusively in astrocytes.14,15The difference in
MCT isoforms between astrocytes and neurons is ex-plained by the lactate shuttle hypothesis, which states that lactate is produced by astrocytes and used by
neurons.16,17MCT plasma membrane localization and
activity is regulated by coexpression with chaperone
proteins,11,13 namely CD147 (basigin) for MCT1,
MCT3, and MCT4 and gp-70 (embigin) for MCT2.18,19
Lactate produced by glycolytic tumor cells has an im-portant role in the tumor microenvironment, being
asso-ciated with poor prognosis.20Given the different affinity
of the MCT isoforms to lactate,11MCT1 and MCT4 are
associated with lactate efflux and, therefore, have an im-portant contribution to the maintenance of glycolytic metabolism and consequently tumor cell survival. Several studies described MCT expression in different
solid tumors, such as breast,21 colorectal,22cervical,23
lung,24and gastric25. However, expression of MCTs in
gliomas, in particular, in glioblastomas is not well char-acterized, and their role is poorly elucidated. There are only a few studies on brain tumors that describe the im-portance of MCTs in pH homeostasis and tumor
growth.26–30
Because of the crucial importance of glycolytic me-tabolism to tumor cells and the pivotal role of MCTs in its maintenance, clarifying the role of MCTs in glioma cell survival, proliferation, and aggressiveness is essential. Thus, our study aimed to explore MCTs as a new therapeutic target in glioblastomas. For that,
assessment of MCT1 and MCT4 expressions, as well as CD147, in a series of human gliomas and evaluation of the clinical-pathological significance of their expres-sion profile was performed. Furthermore, the effect of MCT1 inhibition on the viability, proliferation, survival, and aggressiveness of glioma cells was evaluated in both in vitro and in vivo models.
Materials and Methods
Tissues SamplesA series of paraffin-embedded glioma tissue samples was obtained from Hospital Pedro Hispano, Matosinhos, Centro Hospitalar do Porto, Porto, and Hospital do Dr. Ne´lio Mendonc¸a, Madeira, Portugal. This series was composed of 78 glioblastomas (WHO grade IV), 10 diffuse astrocytomas (WHO grade II), and 24 nontu-moral adjacent tissues. The present study was previously approved by Local Ethical Review Committees, and all the samples enrolled in the present study were unlinked and unidentified from their donors.
Cell Lines and Cell Culture
In the present study, 8 high-grade glioma cell lines were used. The cell lines SW1088, SW1783, U87-MG, and A172 were obtained from American Type Culture Collection, the cell lines SNB-19 and GAMG were ob-tained from German Collection of Microorganisms and Cell Cultures, and the cell lines U251 and U373 were
kindly provided by Professor Joseph Costello,
California University, Neurosurgery Department,
San Francisco. Cell line authentication was performed at IdentiCell Laboratories (Department of Molecular
Medicine at Aarhus University Hospital Skejby, A˚ rhus,
Denmark) in August 2011. Genotyping confirmed the complete identity of all cell lines, except the U373 cell line, which was shown to be a subclone of the U251 cell line. All cell lines were maintained in Dulbecco’s
Modified Eagle’s Medium (DMEM 1×, High Glucose;
Gibco, Invitrogen) supplemented with 10% fetal bovine serum (Gibco, Invitrogen) and 1% penicillin-streptomycin solution (Gibco, Invitrogen) at 378C and
5% CO2.
Downregulation of MCT1 Expression
Silencing of MCT1 expression was done with siRNA (siRNA for MCT1, ASO0J7OY, Invitrogen; scramble siRNA, ASO0JDS2, Invitrogen), using lipofectamine (13778-075, Invitrogen) as the permeabilization agent, according to the manufacturer’s instructions.
Drugs
Alpha-cyano-4-hidroxycinnamate (CHC; Sigma-Aldrich) and temozolomide (TMZ; Sigma-Aldrich) were dissolved in dimethyl sulfoxide (DMSO; Sigma-Aldrich) to 3 M
and 100 mM stock solutions, respectively, from which the working solutions were prepared.
Antibodies
For immunohistochemistry, we used the following anti-bodies and dilutions: MCT1 (1:200 dilution; AB3538P; Chemicon International); MCT4 (1:500 dilution, H-90; sc-50329; Santa Cruz Biotechnology); CD147 (1:500 dilution; 18-7344; Zymed Laboratories Inc), and Ki67 (1:100 dilution; 6599-059; AbD Serotec).
Immunohistochemistry
Representative 4-mm-thick tissue sections were used for immunohistochemical analysis. Immunohistochemistry (IHC) for MCT1 was performed according to the avidin-biotin-peroxidase principle (R.T.U. Vectastin Elite ABC kit; Vector Laboratories), as previously
de-scribed by our group.22 For CD147 and MCT4, IHC
was performed with the Ultravision Detection System Anti-polyvalent, HRP (Lab Vision Corporation), as
pre-viously described.31 In brief, deparaffinized and
rehy-drated slides were submitted to heat-induced antigen retrieval for 20 min at 988C with 10 mM citrate buffer (pH, 6.0) for MCT1 and MCT4 and 1 mM EDTA buffer (pH, 8.0) for CD147. After endogenous peroxi-dase inactivation, incubation with the primary antibody was performed overnight for MCT1 and 2 h for MCT4 and CD147, at room temperature. The immune reaction
was visualized with 3,3′-Diamonobenzidine (DAB+
Substrate System; Dako) as a chromogen. All sections were counterstained with Gill-2 haematoxylin. For neg-ative controls, primary antibodies were omitted and also replaced by a universal negative control antibody (N1699, Dako). Colon carcinoma tissue was used as positive control for MCT1, MCT4, and CD147. Tissue immunostaining was evaluated semiquantitative-ly, considering extension and intensity of staining, as
published previously.22 The score for immunoreactive
extension was as follows: score 0, 0% of immunoreac-tive cells; score 1, ,5% of immunoreacimmunoreac-tive cells; score 2, 5% – 50% immunoreactive cells; and score 3, .50% of immunoreactive cells. For intensity, the score was as follows: 0, negative; 1, weak; 2, intermedi-ate; and 3, strong. The final score was defined as the sum of these 2 semiquantitative scores, and for statistical analysis, final score .3 was considered to be positive. Cellular localization of staining (cytoplasm/membrane) of the studied markers was also evaluated.
Immunocytochemistry
Paraffin cytoblocks were made from concentrated cell suspensions by centrifuging fresh cell suspensions at 1200 rpm for 5 min. Cell pellets were incubated with formaldehyde 3.7% overnight and recentrifuged. Cell pellets were then processed in an automatic tissue proces-sor (TP1020; Leica), before inclusion into paraffin (block-forming unit EG1140H; Leica). Immunocytochemistry
for MCT1, MCT4, and CD147 was performed in 4 mm cytoblock sections, according to the protocol mentioned for paraffin tissues. Cells were evaluated for protein expression, distinguishing cytoplasmic from membrane expression.
Western Blotting
Parental glioma cell lines and siMCT1 cells were grown to 80% confluence, homogenized in lysis buffer (supple-mented with protease inhibitors) for 15 min, and then centrifuged at 13 000 rpm for 15 min at 48C. The super-natants were collected, and protein quantification was performed according to the Bio-Rad Dc Protein Assay (500-0113, Bio Rad). Aliquots of 20 mg of total protein were separated on 10% polyacrylamide gel by SDS-PAGE and transferred onto a nitrocellulose mem-brane (Amersham Biosciences) in 25 mM Tris-base/ glycine buffer. Membranes were blocked with 5% milk in TBS/0.1% Tween (TBS-T; pH ¼ 7.6) for 1 h at room temperature. After incubation overnight at 48C with the primary polyclonal antibodies for MCT1 (1:200 dilution; AB3538P; Chemicon International), MCT4 (1:500 dilution, H-90; sc-50329; Santa Cruz Biotechnology), and CD147 (1:500 dilution; 18-7344; Zymed Laboratories), membranes were washed in TBS/0.1% Tween and incubated with the secondary an-tibody coupled to horseradish peroxidase (SantaCruz Biotechnology). The bound antibodies were visualized by chemiluminescence (Supersignal West Femto kit; Pierce), and quantification of Western blot results using band densitometry analysis was performed with the Image J software (version 1.41; National Institutes of Health). b-Actin was used as loading control at 1:300 dilution (I19, sc-1616; Santa Cruz Biotechnology).
Cell Viability and Proliferation Assays
Cells were plated into 96-well plates, at a density of 3×
103cells per well. The effect of treatment with CHC
(0.6 –12 mM) on cell number (total biomass) was deter-mined at 24, 48, and 72 h by the sulforhodamine B assay (SRB, TOX-6; Sigma-Aldrich), according to the
manu-facturer’s recommendations. IC50values (i.e., CHC
con-centration that corresponds to 50% of cell growth inhibition) were estimated from 3 independent
experi-ments, each one in triplicate, using GraphPad
Software. Cell proliferation assay was performed as
pre-viously described32 and assessed under the treatment
conditions previously described, for 5 mM and 10 mM of CHC. After CHC treatment, cells were incubated with BrdU and its incorporation was assessed at
450 nm (lref¼ 655 nm), according to the
manufactur-er’s protocol (BrdU, Cell Proliferation ELISA; Roche Diagnostics). Cell growth (total biomass) and cell prolif-eration for glioma siMCT1 cells and the effect of CHC (1.25 – 15 mM) on cell number were performed as de-scribed above.
Drug Combination Studies
A density of 3× 10³U251 cells/well were seeded into
96-well plates. Treatments with TMZ (0.01 –1 mM),
CHC (0.6 – 12 mM), and TMZ+ CHC (0.05–0.5 mM
TMZ+ 5 mM CHC) were done for 72 h. The effect of
TMZ and CHC alone or in combination on cell growth was evaluated using the SRB assay, as described above. The combined effect of the drugs was determined using the CalcuSyn Software (Biosoft). Synergy or antag-onism was quantified by the combination index (CI), where CI ¼ 1 indicates an additive effect, CI , 1
indi-cates synergy, and CI . 1 indiindi-cates antagonism.33
Metabolism Assay (Extracellular Glucose and Lactate Measurements)
Cells were plated in 48-well plates at a density of 4×
104cells per well and allowed to adhere overnight.
Then, cells were treated with 5 mM and 10 mM CHC, and the cell culture medium was collected after 8, 12, and 24 h for glucose and lactate quantification. For these time points, the total protein (expressed as total biomass) was assessed using the SRB assay. Cellular me-tabolism for glioma siMCT1 cells was assessed for 12 and 24 h. Glucose and lactate were quantified using commercial kits (Roche and Spinreact, respectively), ac-cording to the manufacturer’s protocols. Results are ex-pressed as total mg/total biomass.
Apoptosis Assay
Apoptotic and necrotic cell populations were deter-mined by Annexin V-FLOUS Apoptosis Kit (Roche Diagnostics) according to the manufacturer’s
instruc-tions. For that, 2.5× 10⁵cells/well were seeded into
6-well plates in DMEM culture medium. Cells were
treated with the IC50 value of CHC for 72 h. After
that, cells were collected and Annexin V/PI staining was performed according to the manufacturer’s instruc-tions and incubated for 15 min at room temperature. The percentage of cell death was assessed by flow cytom-etry (LSRII model, BD Biosciences), a total of 50 000 events, and the results were analyzed using the FlowJo software (version 7.6; Tree Star).
Wound-Healing Assay
Cells were seeded in 6-well plates and cultured to at least 95% of confluence, and wound-healing assay was
per-formed as described previously.32,34Cells were treated
with 5 and 10 mM CHC for 24 h, and the wound areas were photographed at 0 and 24 h. The relative mi-gration distances were analyzed using Image J Software (version 1.41; National Institutes of Health). The rela-tive migration for siMCT1 glioma cells was assessed as described above.
Invasion Assay
Cell invasion in U251 and SW1088 cells was performed using 24-well BD Biocoat Matrigel Invasion Chambers, according to the manufacturer’s instructions (354480, BD Biosciences). In brief, after matrigel invasion chamber rehydration, cells were seeded and incubated with 5 mM and/or 10 mM CHC for 24 h. Then, nonin-vading cells were removed and innonin-vading cells were fixed with methanol and stained with hematoxylin. Membranes were photographed in Olympus SZx16
stero-microscope (16×), and invading cells were counted using
the Image J software (version 1.41; National Institutes of Health). Invasion was calculated as percentage of cell inva-sion normalized for the control condition.
Chicken Chorioallantoic Membrane (CAM) Assay
CAM assay was performed as previously described.32,34
In brief, fertilized chicken eggs (Pinto Bar) were incubat-ed at 378C. On day 3 of development, a window was made into the eggshell after puncturing the air chamber, and eggs were sealed with BTK tape and re-turned to the incubator. On day 9 of development, a ring was placed on the CAM, and on day 10, the U251
cell line (2× 10⁶cells in 20 mL DMEM medium) was
placed inside the ring and the eggs were tapped and re-turned to the incubator. At day 14 of incubation, the control group received 40 mL of 1% DMSO in DMEM without fetal bovine serum and the treated group re-ceived 40 mL of 5 mM CHC. After 72 h (day 17 of devel-opment), the chicken embryos were sacrificed by placing them at 2808C for 10 min. CAMs with tumors were dis-sected, fixed in 4% paraformaldehyde at room tempera-ture, and included in paraffin. Immunohistochemistry on paraffin sections of microtumors was performed for MCTs, as previously described for the human samples. The effect of CHC on cell proliferation was assessed
by Ki67 immunohistochemistry using the
avidin-biotin-peroxidase method (R.T.U. Vectastin Elite ABC kit, Vector Laboratories). Antigen retrieval was performed in the microwave with 10 mM citrate buffer (pH ¼ 6) for 15 min. Digital Images were taken on days 14 and 17 of development in a stereomicroscope
(Olympus S2× 16), using a digital camera (Olympus
DP71). At the selected time points, the in ovo tumor pe-rimeter was measured using the Cell B software (Olympus). Before paraffin inclusion, tumors were pho-tographed ex ovo for blood vessel count. The number of blood vessels was counted in the area inside the ring placed previously in the CAM, using Image J software (version 1.41; National Institute of Health). CHC effect on CAM vascularization was performed at day 14 of development for 72 h. At day 17, the CAM was photographed ex ovo for blood vessel count, as de-scribed above.
Statistical Analysis
Data from human tissue samples were analyzed using SPSS statistical software (version 18.0; SPSS).
The comparison of MCTs and CD147 expressions among nontumoral, diffuse astrocytomas, and glioblas-toma tissues was evaluated for statistical significance
using the Pearson’s x2test, with the threshold for
signifi-cance being P≤ .05. Analyses of associations between
MCTs and CD147 expressions in glioblastomas and as-sociations with clinical-pathological data were per-formed using the same statistical analysis. For the in vitro studies, the GraphPad prism 5 software was used, with the Student’s t-test, considering significant values
to be P≤ .05.
Results
Expression of MCT1, MCT4, and CD147 in Human Brain Samples
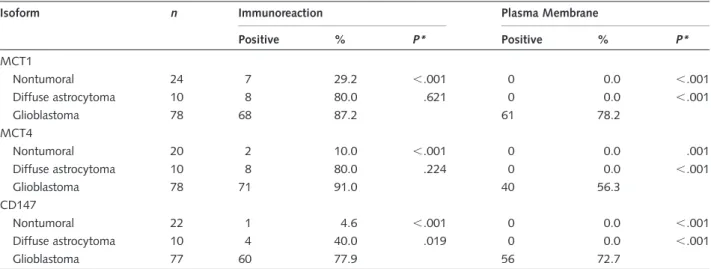
In the present study, 24 nonneoplastic adjacent brain tissues, 10 diffuse astrocytoma (WHO grade II), and 78 glioblastoma (WHO grade IV) tissues were character-ized for MCT1, MCT4, and CD147
immunohistochem-ical expression (Table 1). MCT1, MCT4 and CD147
were expressed in few cases of nonneoplastic brain tissues (29.2% [7/24], 10.0% [2/20], and 4.6% [1/ 22], respectively). In diffuse astrocytomas, MCT1 and MCT4 were both expressed in 80.0% (8/10) of cases, and CD147 was expressed in 40.0% (4/10). MCT1, MCT4, and CD147 were highly expressed in glioblasto-mas (87.2% [68/78], 91.0% [71/78], and 77.9% [60/
77], respectively) (Table1). There was a significant
in-crease in MCT1, MCT4, and CD147 expressions in glio-blastomas, compared to nontumoral tissues. In addition, CD147 expression increased significantly from diffuse astrocytomas to glioblastomas, but not MCT1 or
MCT4 expressions (Table1). Of note, MCT1, MCT4,
and CD147 were present only in the cytoplasm in
nontu-moral brain tissue and diffuse astrocytomas (Table 1,
Fig.1). On the other hand, MCT1 and CD147 were
ex-pressed in the plasma membrane of almost all positive
glioblastoma cases, whereas MCT4 was only expressed
in 56.3% of the total glioblastomas (Table 1, Fig.1).
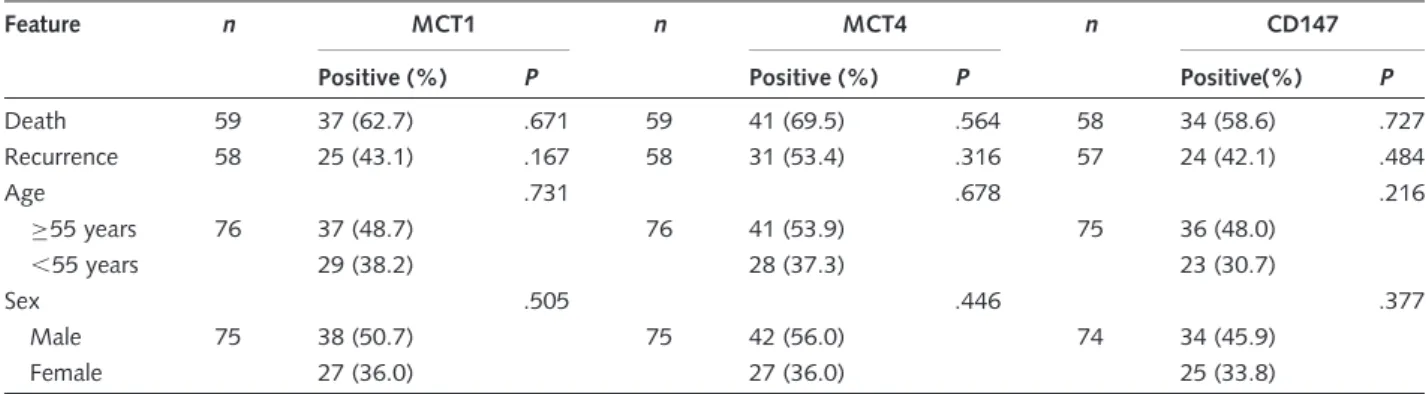
With regard to positivity for plasma membrane expres-sion, significant associations between MCT1 and CD147 (72.3% [44/61]; P , .001) and between MCT4 and CD147 (77.5% [31/40]; P , .001) were ob-served. No significant associations were found between MCT1, MCT4, and CD147 expressions and clinical-pathological data, such as age, sex, recurrence, and
death (P . .05; Table 2). In addition, no correlation
between MCT1, MCT4, and CD147 expressions with overall survival was observed using a Kaplan – Meier analysis (P ¼ .101, P ¼ .850, P ¼ .871, respectively; data not shown). Furthermore, both MCT1 and CD147 were expressed in microvessels and capillaries of nonneoplastic brain tissue and diffuse astrocytomas
(Fig.1).
Expression of MCT1, MCT4, and CD147 in Glioma Cell Lines
All glioma cell lines expressed MCT1 and MCT4 and CD147, however, with distinct levels, as detected by
Western blot and immunocytochemistry (Fig.2). There
was prominent MCT1 expression at the plasma membrane of U251, U373, SNB-19, and GAMG cells. MCT4 was expressed at the plasma membrane in U251, U373, SW1783, and GAMG cell lines, whereas for SW1088 and U87 cells, expression was only present in the cytoplasm. CD147 was expressed at the plasma membrane in almost all cell lines.
In Vitro Effect of CHC on Glioma Cells
To assess the role of MCTs on glioblastoma behavior, we used the classical MCT inhibitor CHC. There is evi-dence that CHC inhibits MCT1 activity, with no
appar-ent cytotoxicity in vivo.35,36First, we started to measure
the effect of CHC on cell viability. The response of
Table 1. Monocarboxylate transporters (MCT1 and MCT4) and CD147 expressions in nontumoral and glioma tissues
Isoform n Immunoreaction Plasma Membrane
Positive % P* Positive % P* MCT1 Nontumoral 24 7 29.2 ,.001 0 0.0 ,.001 Diffuse astrocytoma 10 8 80.0 .621 0 0.0 ,.001 Glioblastoma 78 68 87.2 61 78.2 MCT4 Nontumoral 20 2 10.0 ,.001 0 0.0 .001 Diffuse astrocytoma 10 8 80.0 .224 0 0.0 ,.001 Glioblastoma 78 71 91.0 40 56.3 CD147 Nontumoral 22 1 4.6 ,.001 0 0.0 ,.001 Diffuse astrocytoma 10 4 40.0 .019 0 0.0 ,.001 Glioblastoma 77 60 77.9 56 72.7
*Association with glioblastoma tissue.
glioma cell lines to CHC (IC50 values) was estimated
after 72 h of treatment (see Supplementary material, Fig. S1 and Table S1). We found that, in the range of 0.6 –12 mM of CHC, glioma cells present a decrease in total biomass (SRB assay). Most cell lines presented
IC50 values for CHC of 2.5 –5.1 mM CHC, with
higher values for SW1088 and SW1783 cell lines
(10.8 mM and 7.1 mM CHC, respectively) (see
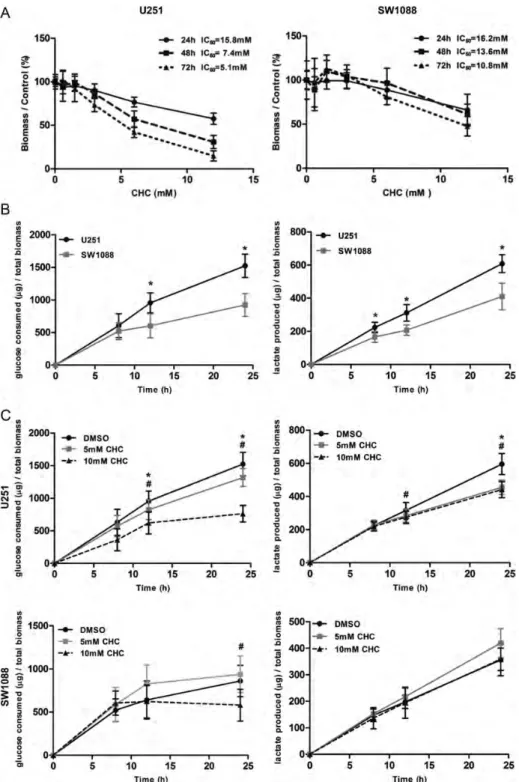
Supplementary material, Table S1). For subsequent studies, 2 cell lines were chosen on the basis of their op-posite response to CHC: U251, one of the most sensitive cells, and SW1088, the least-sensitive cell line (see Supplementary material, Table S1). CHC decreased the total cell biomass over time in a dose-dependent
manner in U251 cells; however, the CHC effect was
smaller on SW1088 cells (Fig.3A). We assessed the
gly-colytic rates of both cell lines by measuring the extracel-lular levels of glucose and lactate over time. As can be
seen in Fig.3B, U251 exhibited higher glycolytic rates
than SW1088 cells. Then, to evaluate the effect of CHC on metabolic disturbance, glucose consumption and lactate production were evaluated for 8, 12, and 24 h, using 5 mM and 10 mM CHC for U251 and SW1088 cells. Results for U251 showed a significant decrease in glucose consumption for 12 and 24 h and in lactate production for 12 h for 10 mM CHC and 24 h for both 5 mM and 10 mM CHC, compared with
untreated cells (Fig. 3C). For SW1088, only 10 mM
Fig. 1. Immunohistochemical expression of monocarboxylate transporters and their chaperone protein CD147 in glioma samples. MCT1 and MCT4 isoforms and their chaperone CD147 presented weak cytoplasmic expression in few cases of nontumoral cerebral tissue. Diffuse astrocytomas presented cytoplasmic expression of MCT1, MCT4, and CD147. Glioblastoma tissues present a strong expression of MCT1 and CD147, mainly at the plasma membrane, whereas MCT4 reactivity was found in both the cytoplasm and the plasma membrane. Pictures were obtained using the microscope Olympus BX61, at 400× magnification.
Table 2. Associations of monocarboxylate transporters (MCT1 and MCT4) and CD147 expressions with clinical-pathological features
Feature n MCT1 n MCT4 n CD147
Positive (%) P Positive (%) P Positive(%) P
Death 59 37 (62.7) .671 59 41 (69.5) .564 58 34 (58.6) .727 Recurrence 58 25 (43.1) .167 58 31 (53.4) .316 57 24 (42.1) .484 Age .731 .678 .216 ≥55 years 76 37 (48.7) 76 41 (53.9) 75 36 (48.0) ,55 years 29 (38.2) 28 (37.3) 23 (30.7) Sex .505 .446 .377 Male 75 38 (50.7) 75 42 (56.0) 74 34 (45.9) Female 27 (36.0) 27 (36.0) 25 (33.8)
CHC produced a significant decrease in glucose con-sumption for 24 h, with no significant effect on lactate
production over time (Fig.3C).
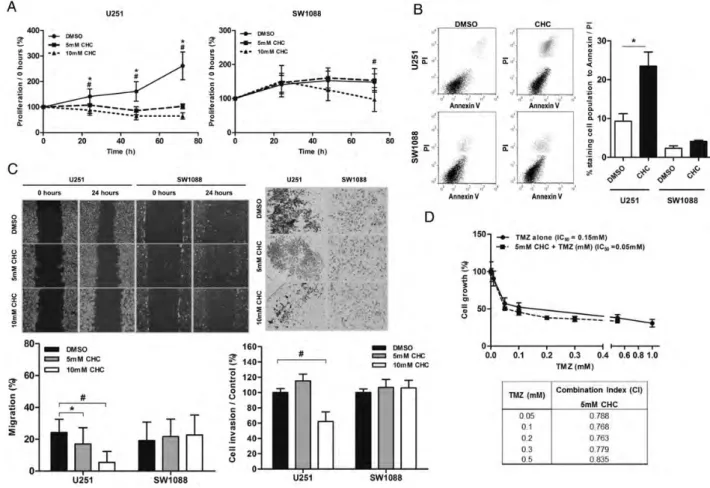
In cell proliferation analysis assessed by BrdU assay, CHC decreased the proliferation of U251 over time for
the 2 CHC concentrations used (5 mM and 10 mM), whereas for SW1088, this effect was only seen for
10 mM CHC at 72 h of treatment (Fig.4A). To
deter-mine the effect of CHC on glioma cell death and cell cycle distribution, U251 and SW1088 cells were
Fig. 2. Monocarboxylate transporters (MCT1 and MCT4) and CD147 expressions in glioblastoma cell lines. (A) Western blot analysis of MCT1, MCT4, and CD147 showing different levels of expression in glioma cells. The molecular weights (kDa) are the following: 50 kDa for MCT1, 52 kDa for MCT4, and 50–60 kDa for the highly glycosylated and 42 kDa for low glycosylated form of CD147. Results are presented as the mean + SD of 2 independent cell lysates. (B) Immunocytochemistry analysis of MCT1, MCT4, and CD147 expressions in glioma cells (400× magnification). MCT1 is mainly expressed at the plasma membrane of U251, U373, SNB-19, and GAMG glioma cell lines, whereas MCT4 is present at both plasma membrane and cytoplasm of the different glioma cells. CD147 is expressed at the plasma membrane of some glioma cells, with different levels.
treated during 72 h with 5 mM and 10 mM CHC, re-spectively. U251 presented a significant increase in the cell population of subG0 phase and a decrease in the
cell population of G0/G1 phase of the cell cycle, com-pared with the control. However, in SW1088, there was a significant increase in the cell population of S
Fig. 3. Effect of the MCT inhibitor, CHC, on total cell biomass and cellular metabolism. (A) The effect of CHC on total biomass of glioma cells was evaluated over time by the sulphorhodamine B assay. CHC inhibited the viability of U251 cells, but not SW1088, over time, in a dose-dependent manner. (B) Metabolic characterization of U251 and SW1088 cells. U251 cells presented higher levels of glucose consumption and lactate production than SW1088 cells. *P≤ .05, compared U251 with SW1088 cells. (C) The effect of CHC on cellular metabolism was evaluated by extracellular glucose and lactate measurements. CHC induced a significant decrease in glucose consumption and lactate production on U251, compared with SW1088 cells. Results were normalized to total biomass, at each time point. *P≤ .05, compared 5 mM CHC with DMSO.#
P≤ .05, compared 10 mM CHC with DMSO. Results are expressed as the mean + SD of at least 3 independent experiments, each in triplicate.
phase with a decrease in the cell population of G0/G1 phases, but without effect in the cell population of subG0 phase (see Supplementary material, Fig. S2). Through the Annexin V/PI assay, we observed that CHC induced cell death in U251 cells, but not in Sw1088, by a significant increase in late
apoptotic/ne-crotic cell population (Fig. 4B). According to these
results, CHC induced cell death in the U251 cell line, having only an effect on proliferation of SW1088 cells. Thus, CHC appears to have a cytotoxic effect in U251 cells and a cytostatic effect in SW1088 cells.
The importance of MCT activity on cellular migra-tion and invasion capacity was assessed by the wound-healing assay and matrigel invasion assay, respectively. Treatment with CHC decreased U251 cell migration for both concentrations of CHC (5 mM and 10 mM),
but not for SW1088 cells (Fig.4C). In addition, we
ob-served that 10 mM of CHC induced a significant
decrease in U251 cell invasion (Fig.4C).
To evaluate the effect of the combination of CHC and TMZ, we assessed U251 cell total biomass with use of the SRB assay. CHC potentiated the effect of TMZ,
Fig. 4. Effect of CHC on glioma cell behavior and response to TMZ. (A) The effect of CHC on cell proliferation was determined using the BrdU assay. CHC had a significant effect on the cellular proliferative capacity of U251 cells over time, and for SW1088, CHC only had an effect for 10 mM CHC at 72 h. *P≤ .05, compared 5 mM CHC with DMSO.#P≤ .05, compared 10 mM CHC with DMSO. Results are expressed as the mean + SD of at least 3 independent experiments, each in triplicate. (B) Cell death analysis was done in U251 and SW1088 cells after 72 h of treatment with IC50values of CHC by Annexin V/PI assay (flow cytometry). In U251 cells, we observed a significant increase in cell death induced by CHC, whereas for SW1088, there was no difference (right panel). Representative dotplot of cell population distribution stained for Annexin V and PI are shown in the left panel (cell population in bottom/left ¼ viable cells; the cell population in upper/right ¼ death cells [late apoptosis/necrosis]). *P≤ .05. Results are expressed as the mean + SD of at least 3 independent experiments; (C) In the wound-healing migration assay and matrigel invasion assay, we observed that CHC decreased U251 cell migration, compared with control cells, but not for SW1088 cells. Representative images of the migration assay at 0 and 24 h are presented (40× magnification) (left panel). For invasion assay, representative images at 24 h are shown (100× magnification) (right panel); *P≤ .05, compared 5 mM CHC with DMSO. #P≤ .05, compared 10 mM CHC with DMSO. Results are expressed as the mean + SD of at least 3 independent experiments. (D) Effect of CHC+ TMZ treatment in U251 cell growth was evaluated by SRB at 72 h. U251 cells were treated with fixed concentration of CHC (5 mM) and increasing concentrations of TMZ (0.05– 0.5 mM). TMZ+ CHC therapy decreased cell growth of U251 cells, compared with TMZ alone (graph). Growth curves for TMZ and CHC in monotherapy were compared with the combination to determine the combination index (CI) for each concentration of TMZ (table). Values ,1 indicate a synergistic drug relationship; results are representative of 3 independent experiments, each in triplicate.
decreasing its IC50 value (Fig. 4D). The CI was ,1
(Fig.4D), confirming the synergistic effect of the
combi-nation of CHC with TMZ.
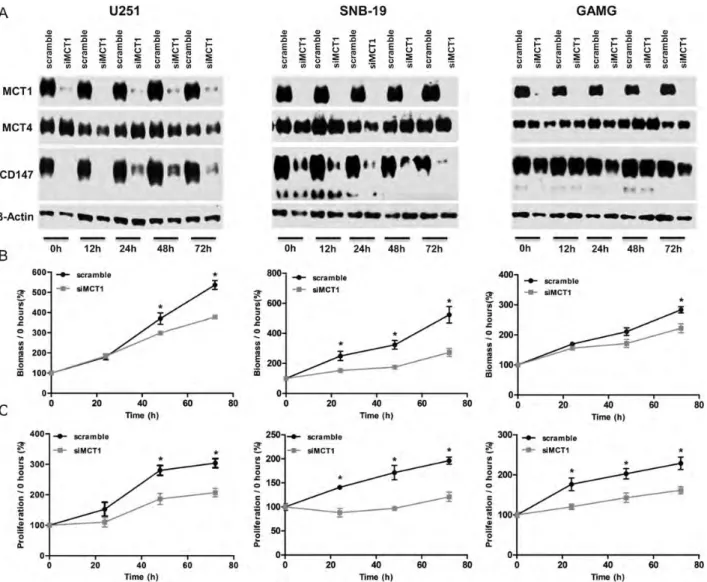
To further confirm CHC inhibition of MCT1 as the mechanism of selective toxicity observed in glioblastoma cells, we performed downregulation of MCT1 with use of siRNA in U251, SNB-19, and GAMG cell lines, which exhibited MCT1 expression at the plasma mem-brane. Downregulation of MCT1 in all 3 cell lines led to an efficient decrease in MCT1 expression, which was accompanied by decrease of CD147 expression in
U251 and SNB-19 cells (Fig.5A). No effect on MCT4
expression was observed in all 3 cell lines (Fig. 5A).
Similar to MCT1 activity inhibition, downregulation of MCT1 in glioma cells led to a decrease in cell growth over time, being only significant for GAMG
cells for 72 h (Fig. 5B). Likewise, cell proliferation
de-creased over time for the 3 cell lines (Fig. 5C).
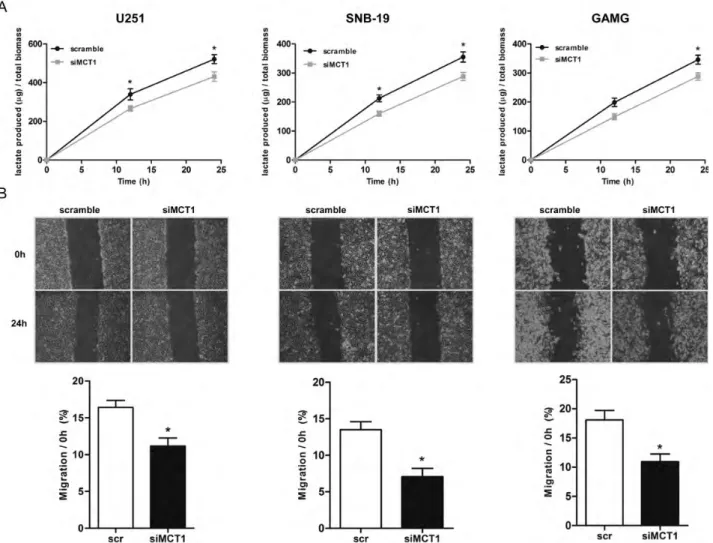
Downregulation of MCT1 also induced a significant decrease in lactate production in U251 and SNB-19 cells for 12 and 24 h and in GAMG cells for 24 h
(Fig.6A), supporting the role of MCT1 in the
mainte-nance of glycolytic rates. In addition, it was observed that downregulation of MCT1 induced a significant decrease in the cellular migration of U251, SNB-19,
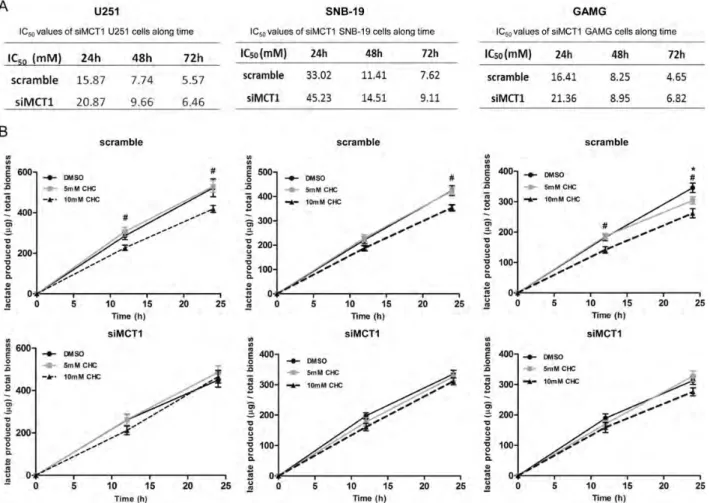
and GAMG cells (Fig. 6B). Downregulation of MCT1
increased the IC50 values for CHC, compared with
control cells, up to 72 h (Fig. 7A) in all glioma cells
used. Furthermore, treatment of siMCT1 cells with
CHC did not alter lactate production (Fig.7B).
In Vivo Effect of CHC on Glioma Cells
U251 cell line exhibits higher glycolytic rates, and ac-cording to the in vitro results obtained in this study, MCT activity appears to have an important role on
Fig. 5. Effect of MCT1 downregulation on cell growth and proliferation. (A) Western blot analysis of MCT1, MCT4, and CD147 expressions in siMCT1 U251, SNB-19, and GAMG cells. Molecular weights (kDa) are the following: 50 kDa for MCT1, 52 kDa for MCT4, and 50– 60 kDa for the highly glycosylated and 42 kDa for the low glycosylated form of CD147. (B) Cell growth and (C) cell proliferation decreased with MCT1 downregulation. *P≤ .05, siMCT1 cells compared with scramble. Results represent the mean + SD of at least 3 independent experiments, each in triplicate.
cell growth, migration, and invasive capacity of these cells. Thus, we evaluated the potential of CHC in vivo
with use of the chicken CAM assay,37which allows a
3D tumor formation that is important in the context of tumor microenvironment and cellular metabolism. U251 cells were grown in the CAM of chicken embryos for 4 days, and treatment with 5 mM CHC
was initiated. As shown in Fig.8A, we observed a
diffe-rence in tumor size between the control and treated group and in the number of blood vessels formed around the tumor. CHC induced a significant decrease in the perimeter of the tumors of the treated group (3.6 mm), compared with the control group (5.2 mm),
after 72 h (Fig.8B). This treatment also induced a
signif-icant decrease in the number of blood vessels around the tumors in the treated group (45 vessels), compared with
the control group (35 vessels) (Fig. 8B). In addition,
CHC decreased the proliferation of tumors, presenting 25% Ki67 positive cells in the control group (n ¼ 5),
compared with 5% in the CHC group (n ¼ 5) (Fig.8C
and D). However, there was no clear difference in MCT1 and MCT4 expressions between the control
and CHC group (Fig.8C), corroborating the results
ob-tained in vitro (see Supplementary material, Fig. S3). Furthermore, CHC did not decrease the number of blood vessels when put alone in the CAM under the same conditions (Supplementary material, Fig. S4), dem-onstrating that CHC effect is mediated by the tumor cells and not directly on the CAM vessels.
Discussion
Glioblastomas are very aggressive human neoplasms,
pre-senting high resistance to current therapy.2 Thus,
exploitation of new molecular targets becomes crucial in neuro-oncology. It is well established that solid tumors, including glioblastomas, present hypoxic regions and in-creased glycolysis. It is described that glycolysis is
upregu-lated .3-fold in glioblastomas that in normal brain,38
Fig. 6. Effect of MCT1 downregulation on lactate production and cell migration. (A) Lactate production decreased at 12 and 24 h in both siMCT1 U251 and SNB-19 cells and only at 24 h in GAMG cells. Results represent the mean + SD of at least 3 independent experiments, each in triplicate. *P≤ .05, siMCT1 cells compared with scramble. (B) Downregulation of MCT1 decreased the migration capacity of cells by the wound-healing assay. Results represent the mean + SD of at least 3 independent experiments. *P≤ .05, siMCT1 cells compared with scramble.
accompanied by an increased ratio of lactate to
pyru-vate.39Thus, upregulation of MCTs likely plays an
impor-tant role in glioma intracellular homeostasis and, thus, contributes to its high aggressiveness.
In the present study, we observed that MCT1 and MCT4 were upregulated in glioblastomas, compared with nonneoplastic brain tissues. Compared with diffuse astrocytomas, no significant differences were ob-served, possibly because of the small number of cases evaluated. Our results are in accordance with the study
of Froberg et al.,30who showed that MCT1 was
upregu-lated in glioblastoma tissues (n ¼ 17), compared with normal brain and low-grade astrocytomas (n ¼ 14). However, unlike our study, the authors did not describe the cellular localization of MCT1 expression, essential for the role of MCTs in intracellular homeostasis. MCT4 expression has not previously been looked at in brain tumors. MCT4 is increased in glioblastomas, com-pared with nonneoplastic brain tissue, and in a high number of glioblastomas, MCT4 was present in the cytoplasm (43.7% [31/71]), in opposition to MCT1. The high expression of MCT4 in the cytoplasm may reflect its role in lactate-pyruvate transport in other
intracellular organelles.40,41 Thus, our results suggest
that MCT1 would be preferentially involved in lactate efflux, as an adaptation to the glycolytic phenotype in glioblastomas. In addition to being an MCT1 and MCT4 chaperone, CD147 is described as a key
element in oncogenesis42 and is upregulated in many
human tumors. In the present study, CD147 expression increased with malignancy, with a significant increase from nonneoplastic tissue to diffuse astrocytomas and high-grade gliomas. Our results are in accordance with the study of Sameshima et al., in which it was shown that CD147 was highly expressed in glioblastomas (n ¼ 9) but not in low-grade gliomas (n ¼ 9) or
nonneo-plastic brain tissue (n ¼ 12).43In addition, our results
showed an association of both MCT1 and MCT4 with CD147 plasma membrane expression, supporting the role of CD147 as chaperone for both MCT isoforms in gliomas.
We observed that MCT1, MCT4, and CD147 are ex-pressed in the glioma cell lines studied, however, with different expression levels and cellular localization and with a pattern similar to glioblastoma tissues. To under-stand the biological role of MCTs, we performed in vitro
Fig. 7. Effect of MCT1 downregulation on the sensitivity to CHC. (A) IC50values for scramble and siMCT1 cells were determined over time by total cell biomass. (B) Effect of CHC on lactate production in siMCT1 cells over time. *P≤ .05, 5 mM CHC compared with DMSO.#P≤ .05, 10 mM CHC compared with DMSO. Results are expressed as the mean + SD of at least 3 independent experiments, each in triplicate.
and in vivo assays using CHC, a classical MCT inhibitor. Despite the availability of other MCT inhibitors, such as
4,4′-diisothiocyanostilbene-2,2′-disulphonate (DIDS),44
quercetin,45and lonidamine (LND),46CHC is the best
described in the literature as having MCTs, namely
MCT1, as a primary target,47 which of importance,
shows no toxicity in in vivo models.35,36Nevertheless,
CHC and all the other compounds may have other targets. It is described that CHC inhibits the
chloride-bicarbonate exchanger AE1 with lower affinity.12
DIDS inhibits AE1 more powerfully than MCTs,12and
quercetin has various intracellular targets, inhibiting sig-naling molecules involved in cell survival and
prolifera-tion.48 LND inhibits lactate transportation,46,49
decreasing intracellular pH;50 however, it is well
de-scribed that the LND primary target is the hexokinase
II (HKII) enzyme activity.51,52
We verified that most glioma cell lines were sensitive to CHC, with the exception of SW1088 and SW1783
cells, which showed lower sensitivity. The effect of CHC on U251 and SW1088 total cell biomass appears to be related to lactate transport activity. Accordingly, U251 cells presented higher levels of MCT1 and CD147 at the plasma membrane than did SW1088, and consequently, CHC decreased glucose consumption and lactate production in U251, but not in SW1088 cells. A decrease in glucose consumption is an expected result, because the blockage of lactate efflux likely leads to glycolysis arrest. In the sensitive U251 cells, CHC was able to inhibit cell proliferation and induce cell death, having a cytotoxic effect; however, in the less sensitive SW1088 cells, CHC only inhibited cell pro-liferation but did not induce cell death, having only a cytostatic effect. We verify that MCT location was in agreement with the CHC effect on cell proliferation and/or cell death. Our findings support the dependence of CHC sensitivity on MCT plasma membrane expres-sion. Results obtained by Mathupala et al. showed that
Fig. 8. In vivo effect of CHC in U251 glioma cell growth. (A) Representative pictures (16× [up] and 12.5× [down] magnifications) of CAM assay after 7 days of tumor growth ex ovo. Representative pictures of CHC effect on the perimeter (up) and in vascularization (down) of tumors. (B) Tumor growth was measured in vivo, and blood vessels around the tumors were counted ex ovo, as described in the Materials and Methods section. A significant decrease in the perimeter (mm) of the tumors treated with 5 mM CHC (left graph) (control group n ¼ 20; CHC group n ¼ 20) was observed. CHC decreased the number of vessels around the tumors, compared with the control group (right graph) (control group n ¼ 20; CHC group n ¼ 20). (C) Representative pictures (400× magnification) of immunohistochemical analysis of MCT1, MCT4, and Ki67 expression in tumors of control compared with CHC group. CHC did not induce an effect in the cellular localization and expression of MCT1 and MCT4. In Ki67 immunoreaction, we observed a decrease in the number of U251-stained cells in the CHC group, compared with control group. (D) Percentage of Ki67 positive cells. CHC group had a lower number of Ki67 positive cells (5%, n ¼ 5), compared with the control group (25%, n ¼ 5); data are the mean + SD. *P≤ .05.
inhibition of MCTs by siRNA26and CHC27reduced cell
viability and lactate efflux and promoted cell death in U87-MG cells; however, they did not associate these results with MCT cellular localization. MCT plasma membrane expression is essential for lactate efflux, con-tributing to the maintenance of the high glycolytic rates and to acidic microenvironment, important features
in tumor invasive phenotype.6 Thus, assessment of
plasma membrane expression becomes crucial to explain the effect of CHC. Despite being described as an inhibitor of pyruvate transportation into the
mito-chondria,47recent studies indicate that CHC does not
enter the cell,27,36because its inhibitory effect is
depen-dent on interactions with membrane proteins accessible from the outside of the cell. It is known that CHC can
inhibit different MCT isoforms;11 however, they have
different sensitivities. In this context, in addition to MCT1, CHC could also inhibit MCT4 activity; however, the latter should happen at much higher con-centrations, because MCT4 has much lower affinity for
CHC (Ki values are 5– 10 times higher than for
MCT1; 50 – 100 mM). Because we used concentrations of 0.6 – 12 mM CHC, it can be assumed that CHC effect is mediated by MCT1 inhibition.
CHC inhibited the migration and invasion capacity of the glycolytic U251 but not the less glycolytic SW1088 cells, suggesting that the glycolytic phenotype and MCT expression profile have an important role in the migration and invasive capacity of glioma cells, putatively through lactate efflux and consequent contribution to acidic micro-environment. Our results are in accordance with the recent published studies, which demonstrate that classical MCT inhibitors and knockdown of MCT1 and MCT4 reduced the migration and invasion capacity of breast, lung, and
glioma cells.36,53,54Although the recent study published
by Mathupala et al.36reported that CHC decreases the
in-vasive capacity of glioma cells, the authors did not charac-terize MCT isoform expression and cellular location in glioma cells, which would be essential to show that the effect of CHC is mediated by lactate efflux inhibition through MCTs. Thus, according to the different MCT ex-pression between both cell lines in study, our results suggest that MCT1 may have a crucial role in the highly
in-vasive capacity of glioma cells, along with lactate55in the
tumor microenvironment.
Overall, our results suggest that the effect of CHC on lactate transportation activity, namely lactate efflux, and consequently, proliferation, cell death, migration, and invasion activity may be mediated through MCT1 inhi-bition. It is known that MCTs are expressed in several
human organs,13 and therefore, some adverse effects
are expected because of inhibition of lactate transport
activity by CHC. However, Sonveaux et al.35 and
Colen et al.36demonstrated that CHC did not show
ap-parent toxicity in the animal models used. Moreover, it was demonstrated that CHC effects in the normal brain tissue are minimal and do not have a significant
impact in the neuron-astrocyte lactate shuttle.36
In addition, we showed that the use of CHC in com-bination with TMZ potentiated the effect of TMZ on glioma cell growth. These results suggest that CHC,
through lactate transport inhibition and consequent gly-colytic flux arrest, makes glioma cells more sensitive to standard therapy. Thus, CHC becomes a promising drug for adjuvant therapy of patients with glioblasto-mas, sensitizing glioma cells to standard therapy, antici-pating little impact on the integrity and viability of normal brain. The effect of CHC as adjuvant in glioma
therapy was also demonstrated by Mathupala et al.,27
who reported that U87-MG cells were more sensitive to radiotherapy with CHC pretreatment. Thus, our results for combination of CHC with standard therapy highlighted the importance to target glioma glycolytic metabolism, namely MCT activity; this will decrease lactate concentrations in the tumor microenvironment and, consequently, decrease the migration and invasive capacity of glioblastomas, which is also associated with resistance to standard therapy. TMZ has been
de-scribed to have a pro-autophagic56 and late apoptotic
effect,57contributing also to an anti-angiogenic activity
of gliomas when combined with bevacizumab.58These
studies showed that the effect of TMZ in vivo was
higher than in vitro, when the respective IC50 values
were compared. Thus, the in vitro effect of TMZ could be masked by the cell culture conditions, and it might be important to test the relevance of CHC and TMZ combination in vivo. However, our study showed for the first time that CHC potentiates the action of TMZ, with a synergistic effect.
To clarify the role of MCT1 inhibition as the mecha-nism of CHC action, we downregulated MCT1 in U251, SNB-19, and GAMG glioma cell lines, which exhibited the highest MCT1 plasma membrane expression togeth-er with hightogeth-er sensitivity to CHC. Downregulation of MCT1 led to a decrease in cell growth, proliferation, and migration, likely because of the observed decrease in lactate production. This indicates that MCT1 has an important role in glioma proliferation and progression. Downregulation of MCT1 expression in glioma cells conferred resistance to CHC, as observed by the
in-creased IC50 values. Furthermore, treatment of
siMCT1 cells with CHC did not change lactate produc-tion, providing further evidence for the specificity of CHC for MCT1, because MCT4 is still present at the plasma membrane in these cells, although at lower levels than in MCT1. Of interest, the decrease in CD147 expression after MCT1 downregulation that was observed in U251 and SNB-19 cells was not detect-ed in GAMG cells. This fact could be explaindetect-ed by the higher MCT4 membrane expression in GAMG cells, which could have allowed the maintenance of CD147 expression. These observations are in agreement with the interdependence of MCT1/4 and CD147 described
in the literature.54
Overall, inhibition of MCT1 expression was similar to inhibition of MCT1 activity, providing evidence for CHC-inhibition of MCT1 as the mechanism of selective toxicity observed in glioblastoma cells.
Furthermore, through in vivo studies, we observed a significant decrease in the size of U251 tumors formed in the CAM, validating the antitumoral activity of CHC against glioma cells. This was further confirmed
by a decrease in proliferation of glioma cells with CHC treatment. These observations support the in vitro results, where it was reported that CHC decreases cell growth and promotes cell death. Although the CAM assay is not a full in vivo assay, it has been used as a rapid, economic, and reliable approach for drug
screen-ing, as demonstrated by other groups.37,59–61In
addi-tion, we observed that CHC had an inhibitory effect in the CAM angiogenesis, demonstrated by a significant decrease in the vascularization associated with the formed tumors, which we showed was not attributable to direct effect of CHC on chicken endothelial cells. It is described that lactate increases VEGF production,
the major angiogenic factor in the microenvironment,62
and we observed that CHC decreased lactate produc-tion in U251 cells. Therefore, we hypothesized that treatment with CHC decreased tumor size and number of blood vessels, likely because of impairment of tumor glycolytic metabolism and decrease in VEGF pro-duction mediated by the decrease in microenvironment lactate concentrations.
In summary, in the present study, we demonstrated that MCT1 and MCT4, along with their chaperone CD147, are upregulated at the plasma membrane in glioblastomas. In addition, using in vitro and in vivo glioblastoma models, we demonstrated the effectiveness
of inhibiting the activity and expression of MCT1, par-ticularly in more glycolytic cells. Of importance, a syner-gistic effect between CHC and TMZ was observed. Thus, the use of MCT1 inhibitors and probably other metabolic-targeting drugs should be explored as a novel strategy for glioblastoma treatment.
Supplementary Material
Supplementary material is available at Neuro-Oncology Journal online (http://neuro-oncology.oxfordjournals. org/).
Conflict of interest statement. None declared.
Funding
This work was supported by the Life and Health Sciences Research Institute, University of Minho, Portugal, and Fundac¸a˜o para a Cieˆncia e Tecnologia
(SFRH/BI/33503/2008 to V.M.G., SFRH/BPD/
69479/2010 to C. P., and SFRH/BD/36463/2007 to O. M.).
References
1. Louis DN, Ohgaki H, Wiestler OD, et al. The 2007 WHO classification of tumours of the central nervous system. Acta Neuropathol. 2007;114(2):97 – 109.
2. Stupp R, Hegi ME, Mason WP, et al. Effects of radiotherapy with concomitant and adjuvant temozolomide versus radiotherapy alone on survival in glioblastoma in a randomised phase III study: 5-year anal-ysis of the EORTC-NCIC trial. Lancet Oncol. 2009;10(5):459 – 466. 3. Dang CV, Semenza GL. Oncogenic alterations of metabolism. Trends
Biochem Sci. 1999;24(2):68 – 72.
4. Hanahan D, Weinberg RA. Hallmarks of cancer: the next generation. Cell. 2011;144(5):646 – 674.
5. Gatenby RA, Gillies RJ. Why do cancers have high aerobic glycolysis? Nat Rev Cancer. 2004;4(11):891 – 899.
6. Kroemer G, Pouyssegur J. Tumor cell metabolism: cancer’s Achilles’ heel. Cancer Cell. 2008;13(6):472 – 482.
7. Vander Heiden MG, Cantley LC, Thompson CB. Understanding the Warburg effect: the metabolic requirements of cell proliferation. Science. 2009;324(5930):1029 – 1033.
8. Gillies RJ, Robey I, Gatenby RA. Causes and consequences of increased glucose metabolism of cancers. J Nucl Med. 2008;49(suppl 2):24S – 42S. 9. Izumi H, Torigoe T, Ishiguchi H, et al. Cellular pH regulators: potentially promising molecular targets for cancer chemotherapy. Cancer Treat Rev. 2003;29(6):541 – 549.
10. Halestrap AP, Price NT. The proton-linked monocarboxylate transporter (MCT) family: structure, function and regulation. Biochem J. 1999;343(pt 2):281 – 299.
11. Enerson BE, Drewes LR. Molecular features, regulation, and function of monocarboxylate transporters: implications for drug delivery. J Pharm Sci. 2003;92(8):1531 – 1544.
12. Halestrap AP, Meredith D. The SLC16 gene family-from monocarboxy-late transporters (MCTs) to aromatic amino acid transporters and beyond. Pflugers Arch. 2004;447(5):619 – 628.
13. Merezhinskaya N, Fishbein WN. Monocarboxylate transporters: past, present, and future. Histol Histopathol. 2009;24(2):243 – 264. 14. Pierre K, Pellerin L. Monocarboxylate transporters in the central nervous
system: distribution, regulation and function. J Neurochem. 2005;94(1): 1 – 14.
15. Pellerin L, Bergersen LH, Halestrap AP, Pierre K. Cellular and subcellular distribution of monocarboxylate transporters in cultured brain cells and in the adult brain. J Neurosci Res. 2005;79(1 – 2): 55 – 64.
16. Kennedy KM, Dewhirst MW. Tumor metabolism of lactate: the influ-ence and therapeutic potential for MCT and CD147 regulation. Future Oncol. 2010;6(1):127 – 148.
17. Pellerin L. Lactate as a pivotal element in neuron-glia metabolic cooper-ation. Neurochem Int. 2003;43(4 – 5):331 – 338.
18. Kirk P, Wilson MC, Heddle C, Brown MH, Barclay AN, Halestrap AP. CD147 is tightly associated with lactate transporters MCT1 and MCT4 and facilitates their cell surface expression. EMBO J. 2000;19(15):3896–3904.
19. Wilson MC, Meredith D, Fox JE, Manoharan C, Davies AJ, Halestrap AP. Basigin (CD147) is the target for organomercurial inhibition of monocarboxylate transporter isoforms 1 and 4: the ancillary protein for the insensitive MCT2 is EMBIGIN (gp70). J Biol Chem. 2005; 280(29):27213 – 27221.
20. Walenta S, Wetterling M, Lehrke M, et al. High lactate levels predict likelihood of metastases, tumor recurrence, and restricted patient survival in human cervical cancers. Cancer Res. 2000;60(4):916–921.
21. Pinheiro C, Albergaria A, Paredes J, et al. Monocarboxylate transporter 1 is up-regulated in basal-like breast carcinoma. Histopathology. 2010;56(7):860 – 867.
22. Pinheiro C, Longatto-Filho A, Scapulatempo C, et al. Increased expres-sion of monocarboxylate transporters 1, 2, and 4 in colorectal carcino-mas. Virchows Arch. 2008;452(2):139– 146.
23. Pinheiro C, Longatto-Filho A, Ferreira L, et al. Increasing expression of monocarboxylate transporters 1 and 4 along progression to invasive cervical carcinoma. Int J Gynecol Pathol. 2008;27(4):568 – 574. 24. Koukourakis MI, Giatromanolaki A, Bougioukas G, Sivridis E. Lung cancer: a
comparative study of metabolism related protein expression in cancer cells and tumor associated stroma. Cancer Biol Ther. 2007;6(9):1476–1479. 25. Pinheiro C, Longatto-Filho A, Simoes K, et al. The prognostic value
of CD147/EMMPRIN is associated with monocarboxylate transporter 1 co-expression in gastric cancer. Eur J Cancer. 2009;45(13):2418–2424. 26. Mathupala SP, Parajuli P, Sloan AE. Silencing of monocarboxylate
trans-porters via small interfering ribonucleic acid inhibits glycolysis and induces cell death in malignant glioma: an in vitro study. Neurosurgery. 2004;55(6):1410 – 1419; discussion 1419.
27. Colen CB, Seraji-Bozorgzad N, Marples B, Galloway MP, Sloan AE, Mathupala SP. Metabolic remodeling of malignant gliomas for enhanced sensitization during radiotherapy: an in vitro study. Neurosurgery. 2006;59(6):1313–1323; discussion 1323–1314.
28. Fang J, Quinones QJ, Holman TL, et al. The H+-linked monocarboxy-late transporter (MCT1/SLC16A1): a potential therapeutic target for high-risk neuroblastoma. Mol Pharmacol. 2006;70(6):2108 – 2115. 29. Li KK, Pang JC, Ching AK, et al. miR-124 is frequently down-regulated
in medulloblastoma and is a negative regulator of SLC16A1. Hum Pathol. 2009;40(9):1234 – 1243.
30. Froberg MK, Gerhart DZ, Enerson BE, et al. Expression of monocarbox-ylate transporter MCT1 in normal and neoplastic human CNS tissues. Neuroreport. 2001;12(4):761 – 765.
31. Pinheiro C, Longatto-Filho A, Pereira SM, et al. Monocarboxylate transporters 1 and 4 are associated with CD147 in cervical carcinoma. Dis Markers. 2009;26(3):97 – 103.
32. Martinho O, Granja S, Jaraquemada T, et al. Downregulation of RKIP is associated with poor outcome and malignant progression in gliomas. PLoS One. 2012;7(1):e30769.
33. Chou TC. Theoretical basis, experimental design, and computerized simulation of synergism and antagonism in drug combination studies. Pharmacol Rev. 2006;58(3):621 – 681.
34. Moniz S, Matinho O, Pinto F, et al. Loss of WNK2 expression by promoter gene methylation occurs in adult gliomas and triggers Rac1-mediated tumour cell invasiveness. [published online ahead of print October 22, 2012]. Hum Mol Genet. 2012. doi:10.1093/hmg/dds405.
35. Sonveaux P, Vegran F, Schroeder T, et al. Targeting lactate-fueled respi-ration selectively kills hypoxic tumor cells in mice. J Clin Invest. 2008;118(12):3930 – 3942.
36. Colen CB, Shen Y, Ghoddoussi F, et al. Metabolic targeting of lactate efflux by malignant glioma inhibits invasiveness and induces necrosis: an in vivo study. Neoplasia. 2011;13(7):620 – 632.
37. Hagedorn M, Javerzat S, Gilges D, et al. Accessing key steps of human tumor progression in vivo by using an avian embryo model. Proc Natl Acad Sci U S A. 2005;102(5):1643– 1648.
38. Oudard S, Arvelo F, Miccoli L, et al. High glycolysis in gliomas despite low hexokinase transcription and activity correlated to chromosome 10 loss. Br J Cancer. 1996;74(6):839 – 845.
39. Tabatabaei P, Bergstrom P, Henriksson R, Bergenheim AT. Glucose me-tabolites, glutamate and glycerol in malignant glioma tumours during radiotherapy. J Neurooncol. 2008;90(1):35 – 39.
40. Dubouchaud H, Butterfield GE, Wolfel EE, Bergman BC, Brooks GA. Endurance training, expression, and physiology of LDH, MCT1, and MCT4 in human skeletal muscle. Am J Physiol Endocrinol Metab. 2000;278(4):E571 – E579.
41. Benton CR, Campbell SE, Tonouchi M, Hatta H, Bonen A. Monocarboxylate transporters in subsarcolemmal and intermyo-fibrillar mitochondria. Biochem Biophys Res Commun. 2004;323(1): 249 – 253.
42. Nabeshima K, Iwasaki H, Koga K, Hojo H, Suzumiya J, Kikuchi M. Emmprin (basigin/CD147): matrix metalloproteinase modulator and multifunctional cell recognition molecule that plays a critical role in cancer progression. Pathol Int. 2006;56(7):359 – 367.
43. Sameshima T, Nabeshima K, Toole BP, et al. Expression of emmprin (CD147), a cell surface inducer of matrix metalloprotei-nases, in normal human brain and gliomas. Int J Cancer. 2000; 88(1):21 – 27.
44. Poole RC, Halestrap AP. Reversible and irreversible inhibition, by stilbe-nedisulphonates, of lactate transport into rat erythrocytes. Identification of some new high-affinity inhibitors. Biochem J. 1991;275(pt 2): 307 – 312.
45. Belt JA, Thomas JA, Buchsbaum RN, Racker E. Inhibition of lactate transport and glycolysis in Ehrlich ascites tumor cells by bioflavonoids. Biochemistry. 1979;18(16):3506– 3511.
46. Floridi A, Paggi MG, D’Atri S, et al. Effect of lonidamine on the energy metabolism of Ehrlich ascites tumor cells. Cancer Res. 1981;41(11 pt 1): 4661–4666.
47. Halestrap AP, Denton RM. Specific inhibition of pyruvate transport in rat liver mitochondria and human erythrocytes by alpha-cyano-4-hydroxycinnamate. Biochem J. 1974;138(2):313 – 316.
48. Senthilkumar K, Arunkumar R, Elumalai P, et al. Quercetin inhibits inva-sion, migration and signalling molecules involved in cell survival and proliferation of prostate cancer cell line (PC-3). Cell Biochem Funct. 2011;29(2):87 – 95.
49. Ben-Yoseph O, Lyons JC, Song CW, Ross BD. Mechanism of action of lonidamine in the 9L brain tumor model involves inhibition of lactate efflux and intracellular acidification. J Neurooncol. 1998; 36(2):149 – 157.
50. Zhou R, Bansal N, Leeper DB, Pickup S, Glickson JD. Enhancement of hyperglycemia-induced acidification of human melanoma xenografts with inhibitors of respiration and ion transport. Acad Radiol. 2001; 8(7):571 – 582.
51. Mathupala SP, Ko YH, Pedersen PL. Hexokinase II: cancer’s double-edged sword acting as both facilitator and gatekeeper of malignancy when bound to mitochondria. Oncogene. 2006; 25(34):4777 – 4786.
52. Pelicano H, Martin DS, Xu RH, Huang P. Glycolysis inhibition for anti-cancer treatment. Oncogene. 2006;25(34):4633 – 4646.
53. Izumi H, Takahashi M, Uramoto H, et al. Monocarboxylate transporters 1 and 4 are involved in the invasion activity of human lung cancer cells. Cancer Sci. 2011;102(5):1007 – 1013.
54. Gallagher SM, Castorino JJ, Wang D, Philp NJ. Monocarboxylate trans-porter 4 regulates maturation and trafficking of CD147 to the plasma membrane in the metastatic breast cancer cell line MDA-MB-231. Cancer Res. 2007;67(9):4182 – 4189.
55. Baumann F, Leukel P, Doerfelt A, et al. Lactate promotes glioma migra-tion by TGF-beta2-dependent regulamigra-tion of matrix metalloproteinase-2. Neuro Oncol. 2009;11(4):368 – 380.
56. Kanzawa T, Germano IM, Komata T, Ito H, Kondo Y, Kondo S. Role of autophagy in temozolomide-induced cytotoxicity for malignant glioma cells. Cell Death Differ. 2004;11(4):448 – 457.
57. Roos WP, Batista LF, Naumann SC, et al. Apoptosis in malignant glioma cells triggered by the temozolomide-induced DNA lesion O6-methylguanine. Oncogene. 2007;26(2):186 – 197.
58. Mathieu V, De Neve N, Le Mercier M, et al. Combining bevacizumab with temozolomide increases the antitumor efficacy of temozolomide in a human glioblastoma orthotopic xenograft model. Neoplasia. 2008;10(12):1383 – 1392.
59. Sihn G, Walter T, Klein JC, et al. Anti-angiogenic properties of myo-inositol trispyrophosphate in ovo and growth reduction of implanted glioma. FEBS Lett. 2007;581(5):962 – 966.
60. Saidi A, Hagedorn M, Allain N, et al. Combined targeting of interleukin-6 and vascular endothelial growth factor potently inhibits glioma growth and invasiveness. Int J Cancer. 2009;125(5): 1054 – 1064.
61. Brignole C, Marimpietri D, Pastorino F, et al. Effect of bortezomib on human neuroblastoma cell growth, apoptosis, and angiogenesis. J Natl Cancer Inst. 2006;98(16):1142 – 1157.
62. Kumar VB, Viji RI, Kiran MS, Sudhakaran PR. Endothelial cell response to lactate: implication of PAR modification of VEGF. J Cell Physiol. 2007;211(2):477 – 485.

![Fig. 8. In vivo effect of CHC in U251 glioma cell growth. (A) Representative pictures (16 × [up] and 12.5 × [down] magnifications) of CAM assay after 7 days of tumor growth ex ovo](https://thumb-eu.123doks.com/thumbv2/123dok_br/18779593.924218/13.890.102.779.89.555/effect-glioma-growth-representative-pictures-magnifications-assay-growth.webp)
