The Quality of Work Life Scale: Validity
Evidence from Brazil and Portugal
Jorge Sinval
1,2, M. Joseph Sirgy
3, Dong-Jin Lee
4, and João Marôco
1*
1
William James Center for Research, ISPA - Instituto Universitário,
Lisbon, Portugal
2
Instituto Universitário de Lisboa (ISCTE-IUL), Business Research
Unit (BRU-IUL), Lisboa, Portugal
3
Pamplin College of Business, Virginia Polytechnic Institute & State
University, Blacksburg - VA, United States of America
4
Department of Marketing, Yonsei University, Seoul, Republic of
Korea
*Corresponding author information: João Marôco, Rua Jardim do Tabaco, 34; 1149-041 Lisboa, Portugal (e-mail: [email protected]).
Jorge Sinval
ORCID ID: 0000-0002-2855-1360
Address: 880 West Campus Drive (Office: 2025 Pamplin Hall); Blacksburg, Virginia 24061-0236, USA
Dong-Jin Lee
Address: Yonsei-ro 59, Seodaemun-gu, 03722, Seoul, Korea,
João Marôco
ORCID ID: 0000-0001-9214-5378
Address: Rua Jardim do Tabaco, 34; 1149-041 Lisboa; Portugal
Abstract:
Quality of work life (QWL) is an important construct, based on satisfaction of worker’s needs. It is strongly related to higher work engagement and lower burnout. To properly establish comparisons between countries’ QWL with a psychometric instrument, the measure must show validity evidence, namely in terms of measurement invariance. This study aims to assess the validity evidence of the Quality of Work Life Scale (QWLS) by examining the internal structure of the measure (i.e., dimensionality, reliability, and measurement invariance) and its relations with other variables such as burnout and work engagement. The measure was tested using a total sample of 1,163 workers, 566 workers from Portugal, and 597 from Brazil. The data had a good fit to the QWLS second-order model and good reliability estimates for the two countries.
and Brazil and for gender too. The measure also demonstrated good nomological validity evidence by successfully predicting burnout and work engagement.
Keywords:
quality of work life; Quality of Work Life Scale; Brazil; Portugal; measurement invariance.
Acknowledgements:
The authors would like to thank: the Portuguese national occupational health program of the Directorate-General of Health (DGS) and the William James Center for Research, Portuguese Science Foundation (FCT
Running head: THE QUALITY OF WORK LIFE SCALE 1
There are several definitions of quality of work life (QWL; Martel and Dupuis 2006). Quality of work life (QWL), or “quality of work” as others prefer to call it (Lau and May 1998; Louis 1998), refers to satisfaction of various needs at work (Efraty and Sirgy 1990; Sirgy et al. 2001). That is, QWL is high when the worker perceives that his various basic and growth needs are met through the employing organization. Sirgy et al. (2001) theorized that QWL involves workers’ satisfaction of basic and growth needs (i.e., lower-order and higher-order needs based on Maslow framework). The lower-order needs include health and safety needs (i.e., protection from injury at work and outside of work, as well as job-related health benefits), and economic and family needs (i.e., adequate wages, job security, having time from work to attend family needs). Higher-order needs include social needs (i.e., leisure time off work and social
interactions at work), esteem needs (i.e., recognition of job performance within the organization itself and recognition of one’s job performance outside of the organization), actualization needs (i.e., realization of one’s potential within the organization, and/or as a professional in the worker’s field), knowledge needs (i.e., learning to enhance professional skills and/or job skills), and aesthetic needs (i.e., personal creativity and general aesthetics, creativity at work). As such, QWL involves the satisfaction of basic and growth needs through worker’s participation in organizational life. Organizational rules or standards that govern the conduct of workers (i.e., corporate culture, incentive systems, valued behaviors, promotion policies, and management behavior) can be viewed as antecedents to QWL (Koonmee et al. 2010).
QWL is viewed to impact a variety of behavioral outcomes such as job satisfaction (e.g. Chan and Wyatt 2007; Danna and Griffin 1999; Knox and Irving 1997), job performance, organizational identification, intention to quit, personal alienation, and work engagement (e.g.
Kanten and Sadullah 2012; Sirgy et al. 2001), lower turnover and health perceptions (e.g. Chan and Wyatt 2007; de Jong et al. 2015; Easton et al. 2013; Van Laar et al. 2007).
There are several published instruments designed to measure QWL. These include the Quality of Work Life Scale (QWLS) (Sirgy et al. 2001), the Work-Related Quality of Life Scale (Easton and Van Laar 2018), Zin’s (2004) Quality of Work Life Measure, Nurses’ Quality of Working Life Questionnaire (Hsu 2016), Quality of Work Life Questionnaire (Elizur and Shye 1990), and the Quality of Working Life Systemic Inventory (Martel and Dupuis 2006). Although the conceptual definition of QWL may somewhat differ across studies and measures, it is
generally accepted that QWL is related to employee happiness, employee well-being, and job satisfaction.
The QWLS (Lee et al. 2007; Sirgy et al. 2001) provides managers and policy makers with information about the satisfaction of specific needs at work. It also provides managers and policy makers with specific guidelines on effective ways to improve the QWL of workers. The QWLS measure has advantages over other QWL measures in that it is short and easily applicable to various work groups for comparison.
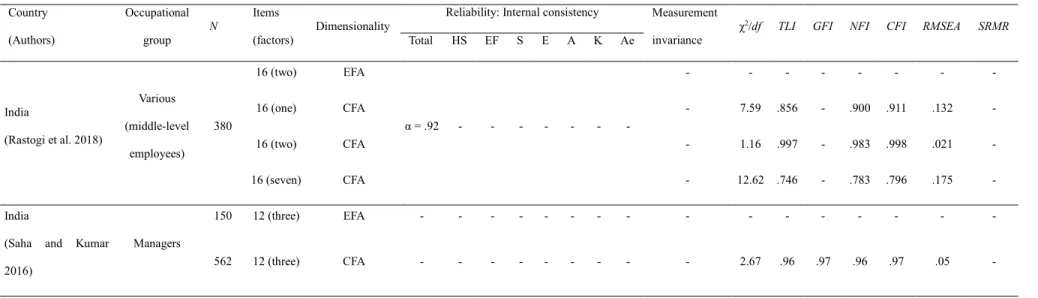
The QWLS has been employed in several studies in the USA and adapted to other countries (see Table 1). The table also summarizes the different QWLS versions used with different samples found on a search on Embase, Scopus, PubMed, Web of Science and Scholar Google. The table documents validity evidence based on the internal structure findings. In addition to the original study (Sirgy et al. 2001), two studies tested the original version of the QWLS through a second-order factor: one with the maintaining all the items (Afsar and Burcu 2014) and other with 13 items (Marta et al. 2013). However, most studies failed to report satisfactory results—given the fact that some studies reported only exploratory factor analysis
results instead of the desired confirmatory factor analysis (Marôco 2014). No studies were identified testing measurement invariance of the QWLS for any group. However, the reliability evidence in terms of internal consistency is considered acceptable in the majority of the studies (Abdollahzade et al. 2016; Koonmee et al. 2010; Singhapakdi et al. 2014).1
The present study is designed to assess the validity of QWLS by examining the internal structure of the measure (i.e., dimensionality, reliability, and measurement invariance) and its relations with other variables such as burnout and work engagement. Brazil and Portugal were selected for cross-cultural adaptation of the QWLS because they have cultural and historical commonalities. They share the same language, have close economic ties, and exchange an increasingly large number of migrants (Serviço de Estrangeiros e Fronteiras 2018).
Due to the workforce migration between the two countries, it is important to consider and compare the economic and social context of both countries (Horst et al. 2016). With 20.3% of the total foreign residents, the Brazilian community is the largest foreign resident community in Portugal (Serviço de Estrangeiros e Fronteiras 2018). In 2016, Brazil’s migrants represented the top inflows nationality of total inflows of foreigners entries to Portugal: 15% (OECD 2018). Brazil’s migrants represented 1.1% of the total OECD countries inflows in 2016, with 18% more than in 2015, is the 25th country of origin with more migrants (OECD 2018). In turn, Portugal
was one of the countries that sent more migrants to Brazil, ranked second in terms of investments (Cavalcanti et al. 2017). In fact, from 2010 to 2016, Portugal was the 8th country having more
migrants entering in Brazil, and it was the 5th country with more work visa grants (Cavalcanti et
al. 2017). Brazil was one of the top desired destination countries of potential migrants between
1Although only the study by Afsar and Burcu (2014) reported individual estimates for each of the
2010 and 2015 (International Organization for Migration 2017). These two countries share more than just the same language, they share human capital and cultural exchange programs. Several studies compared psychometric instruments between Portugal and Brazil (Dias et al. 2010; Souza et al. 2008). Several other studies have focused on the adaptation of psychometric instruments to Brazil-Portugal unique versions (Marôco et al. 2014; Sinval et al. 2018). There are significant advantages to have two equivalent versions, one per country (Jorge 1998). As such, it is
important to evaluate the QWL in these countries, allowing policy makers to provide culturally valid and comparable QWL information for workers in the two countries. It is expected that QWL in Portuguese companies, Triste Fado (“sad fate”) as some call it (Costa and Costa 2017), is poor. This may be mainly due to the economic crisis, from which the country is recovering, that have affected deeply the Portuguese economy. The same authors referred to the Brazilian situation as El Dorado (“country of fabulous riches”), which, despite some political and social instability, is somehow representative of the Brazilian economic situation at the date of the data collection. Both El Dorado and Triste Fado seem to be good metaphors of the economic situation, work environment, cultural and history context of both countries.
Following the Standards for Educational and Psychological Testing (American Educational Research Association et al. 2014) recommendations for assessing instruments validity evidence, two different sources of validity evidence will be used to assess QWLS. One source is based on the internal structure of the instrument, which is related to the dimensionality, reliability of the scores and measurement invariance. The second source of validity evidence is based on relationships with other variables. The first source of validity involves three
hypotheses. The first hypothesis (H1) assumes that the QWLS has a satisfactory fit based on its original second-order structure. This assumption is based on the findings of previous studies that
tested the second-order structure of the instrument obtaining an acceptable or a good fit (Afsar and Burcu 2014; Marta et al. 2013; Sirgy et al. 2001). Past research has shown that the reliability evidence in terms internal consistency estimates is considered acceptable in regards to all items of the original version (Koonmee et al. 2010; Mohan and Suppareakchaisakul 2014; Rastogi et al. 2018) as with short versions of the instrument (Chan and Wyatt 2007; Marta et al. 2013; Nimalathasan and Ather 2010; Taher 2013). No study tested properly the second-order internal consistency, and only one study presented the individual seven first-order internal consistency estimates, which turned out to be acceptable (Afsar and Burcu 2014). Thus, the second
hypothesis (H2) assumes that the QWLS has good reliability estimates both at first- and second-order factors levels.
No research that has used the QWLS tested the measurement invariance in relation to gender and country. There is evidence that invariance can be obtained between Portugal and Brazil with other instruments (Campos et al. 2012; Sinval et al. 2018) and in relation to gender in these countries (Sinval et al. 2019). Given that both countries share a common culture, it is more likely to find measurement invariance between the two samples (Vargas et al. 2017). To make valid comparisons of quality of work life between male and female workers (Bureau of Labor Statistics 2017; Eurofound 2017), measurement invariance between the genders must be established. We expect both male and female workers understand and respond to the
measurement items in a similar way even though they may experience different levels of need satisfaction. As such, we hypothesize that the QWLS is characterized by measurement invariance between Brazil and Portugal and between male and female workers (H3).
The second source of validity focuses on predictive validity by testing the relationship between QWL and other behavioral constructs such as burnout and work engagement. QWL has
been shown to have an impact on burnout (Cetrano et al. 2017; Tuuli and Karisalmi 1999). Furthermore, work engagement has been found to be positively predicted by QWL (Jenaro et al. 2011). As such, we hypothesize that QWLS can significantly explain variation in work
engagement (positively) and burnout (negatively). Thus, our fourth hypothesis (H4) states that QWLS should demonstrate discriminant predictive validity evidence with burnout and
convergent predictive validity evidence with work engagement.
Specifically, for work engagement, we hypothesize that the satisfaction of lower-order needs is positively related to work engagement (H4a). This is because satisfaction of lower-order needs (e.g., satisfying pay, healthy and safe working conditions) should motivate employees to be more engaged on the job. We also hypothesize that the satisfaction of higher-order needs is positively related to work engagement (H4b). This is because self-actualization and progress towards individual goals at work should also motivate employees to be more engaged on the job.
In relation to employee burnout, we hypothesize that the satisfaction of lower-order needs is negatively related to employee burnout (H4c). This is because satisfaction of lower-order needs reflects financial stress and work-family conflict, protection from overwork and safety-related stress. In addition, we hypothesize that satisfaction of higher-order needs is negatively related to employee burnout (H4d). This is because employees with the satisfaction of higher-order needs at work are likely to have emotional and social support from the organization; as such, they are likely to be shielded from work-related stress.
Past research has shown differences between males and females workers in terms of lower-order QWL, which can change depending on the country (Singhapakdi et al. 2014), which again highlights the importance of the country factor (Greenan et al. 2014). As such, H5 states that different QWL dimensions’ and overall mean levels should be observed between male and
female workers and between workers in Brazil and Portugal. Specifically, we hypothesize that male workers are likely to experience higher QWL levels than female workers (Cardoso et al. 2016; Connerley and Wu 2016; Santos and Garibaldi de Hilal 2018) (H5a). Gender disparity is likely to be evident in lower-order need satisfaction (satisfaction of economic and family needs as well as health and safety needs). Women workers in masculine countries are likely to receive lower pay and experience greater role conflict and stress (Lewis 2009; Ollier-Malaterre and Foucreault 2017). Research has shown that work-family conflict has a greater negative impact on job satisfaction, especially for women (Ernst Kossek and Ozeki 1998). We hypothesize that there is no gender differences in satisfaction of higher-order needs such as social need, knowledge need, aesthetics need, and self-actualization needs (H5b). This is because the satisfaction of higher-order needs is likely to be influenced by individual factors rather than cultural norms related to gender. This observation is also consistent with past research--gender differences in relation to lower-order need satisfaction (Singhapakdi et al. 2014).
Method
Sampling and Data Collection
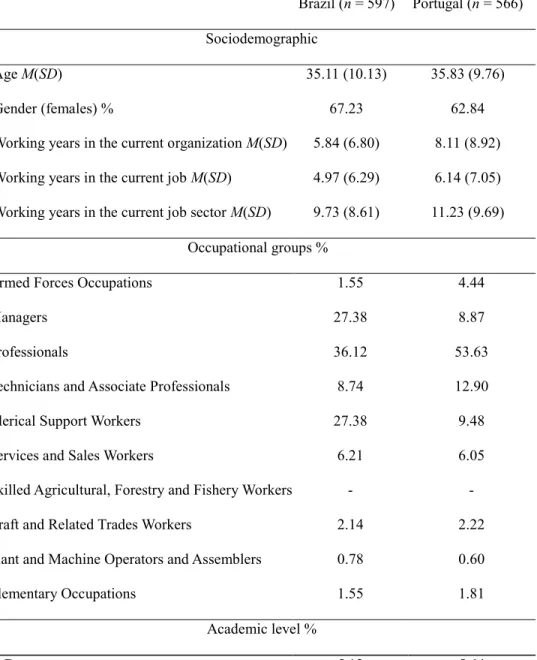
The sample for this study was collected in 2015-2017 in both countries involving 1,163 workers. This overall sample was composed of two samples, the first sample comprised multi-occupational workers in Brazil (n = 597), the second multi-multi-occupational workers in Portugal (n = 566).
In regards to the Brazilian sample, the average age was 35.11 (SD = 10.13), the average working years in current job sector was 9.73 (SD = 8.61), the average number of years working in the current organization was 5.84 (SD = 6.80), the average working years in current job position was 4.97 (SD = 6.29), average working years in past jobs was 3.38 (SD = 3.89), average
number of job promotions in their actual job was 1.85 (SD = 2.06), and 67.23% were females. Furthermore, 60.50% of study participants were identified as working in private firms, 32.77% working in public firms, and 6.73% in other firms. With respect to the work schedule, 65.83% reported working on a regular schedule (65.83%), 28.35% on a rotation schedule, and 5.82% on an irregular schedule. With respect to compensation, 86.41% reported receiving a salary and 13.59% an hourly wage.
With respect to the Portuguese sample, the average age was 35.83 (SD = 9.76), the average working years in the current job sector was 11.23 (SD = 9.69), the average number of years working in the current organization was 8.11 (SD = 8.92), the average working years in current job position was 6.14 (SD = 7.05), average working years in past jobs was 2.34 (SD = 3.03), average number of job promotions in the actual job was 1.34 (SD = 1.90), and 62.84% were females. Furthermore, 49.50% reported working in private firms, 40.04% in public firms, and 10.46% in others. With respect to the work schedule, 55.24% reported that they work on a regular schedule, 37.10% on a rotation schedule, and 7.66% on an irregular schedule. With respect to compensation, 90.52% reported receiving salary and 9.48% an hourly wage.
With respect to the worker’s occupation, according to the International Standard
Classification of Occupations ISCO-08 (International Labour Office 2012), the sample from
Brazil and Portugal involved mostly professionals2 (see Table 2). With respect to education,
74.39% of the Brazilian sample and 83.07% of the Portuguese sample were college graduates.
2 According ISCO-08 (International Labour Office, 2012) this group includes science,
engineering, health, teaching, business and administration, or information and communication technology professionals.
The two samples at large were based on non-probabilistic, convenience sampling, with certain inclusion criteria: all participants have to be workers, are able to read, and have easy access to a PC/smartphone/tablet to access the online platform of the survey questionnaire.
Constructs and Measures
The Quality of Work Life Scale (QWLS). The QWLS measure was originally
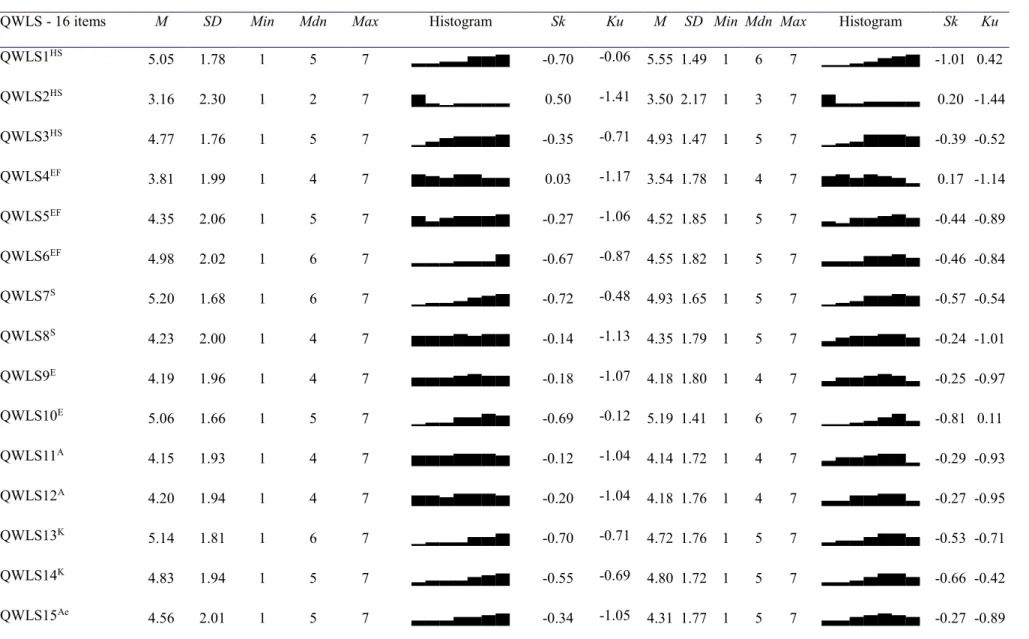
developed by Sirgy et al. (2001). The measure is a self-report instrument involving 16 items scored on Likert-type scales. Subjects are asked to respond to each item by checking a seven-point scale ranging from “1 - Very Untrue” to “7 - Very True” (see Table 3). The measure was designed to capture the extent to which the work environment, job requirements, supervisor behavior, and support programs in an organization are perceived to meet workers' needs.
Specifically, the measure assesses seven major needs: (1) health and safety needs (i.e., job related benefits, safety at work, preventive measures of health care); (2) economic and family needs (i.e., pay, job security and other family needs); (3) social needs (i.e., collegiality at work and leisure time off work); (4) esteem needs (i.e., recognition and appreciation of work within and outside the organization); (5) actualization needs (i.e., realization of one’s potential within the organization and as a professional); (6) knowledge needs (i.e., learning to enhance job and professional skills); and (7) aesthetic needs (i.e., creativity at work as well as personal creativity and general aesthetics).
The first two needs are treated as lower-order needs, while the others are treated as higher-order needs. To develop the Portuguese version (see Table 3), the permission of the original author to adapt the original version was requested (Sirgy et al. 2001). The process of adaptation followed The ITC Guidelines for Translating and Adapting Tests (International Test Commission 2018), adapting the items to the Portuguese language per the Orthographic
Agreement signed by both Portugal and Brazil in 2009. The instrument’s items were discussed with several Brazilian and Portuguese research methodologists to ensure cultural, semantic, and idiomatic equivalence in Brazil and Portugal. A pilot study was conducted using 15 workers from each country. This version had the same items’ wording for both countries.
The Oldenburg Burnout Inventory (OLBI). To assess burnout, the Oldenburg Burnout
Inventory Portuguese version for Brazil and Portugal was used (OLBI; Sinval et al. 2019). The burnout construct is this case was treated as a second-order latent factor. Burnout is considered a syndrome involving feelings of chronic exhaustion and a negative attitude towards one’s job due to occupational stress (Bakker et al. 2014). The OLBI measure includes 15 self-report items scored on a five-point Likert-type scale (1 = Strongly disagree; 5 = Strongly agree). Examples of items in the measure include: “It happens more and more often that I talk about my work in a negative way” (disengagement), and “There are days when I feel tired before I arrive at work” (exhaustion). That is, the measure involves two dimensions: (1) disengagement dimension with seven items, and (2) exhaustion dimension with eight items. The disengagement dimension refers to distancing from work both in terms of object and content, and to the development of cynical and negative attitude towards one’s job and acting unfavorably in work situations (Demerouti and Bakker 2008). Exhaustion refers to feelings of physical fatigue, the need to rest, and feelings of being overtaxed and emptiness at work (Bakker et al. 2004). The OLBI’s Portuguese (Brazil and Portugal) study (Sinval et al. 2019) provided good criterion validity evidence in relation to other measures [i.e. work engagement, rburnout*work engagement(1,102) = -.85, p < .001]. The measure
also showed measurement invariance between Portugal and Brazil, and between male and female workers for the proposed second-order factor dimensionality and good values of the reliability estimates.
Utrecht Work Engagement Scale (UWES). The Portuguese language version for Brazil
and Portugal of the Utrecht Work Engagement Scale (UWES-9; Sinval et al. 2018) was used to assess work engagement through a second-order latent factor. Work engagement has been defined as energetic involvement with work (Schaufeli and Bakker 2010) and it is characterized by three dimensions: vigor, dedication, and absorption (Schaufeli et al. 2002). Vigor reflects mental resilience and high energy in the workplace (Bakker and Demerouti 2008). The
dedication dimension reflects deep involvement with work, feelings of significance, challenge, enthusiasm and pride (Schaufeli and Bakker 2004). Absorption refers to being happily engrossed and fully concentrated at work, whereby the worker perceives time to fly and feeling difficulty to disconnect from work (Bakker and Demerouti 2008). As such, UWES-9 involves nine items, three items for each dimension. Responses were captured on a seven-point frequency scale (0 = never; 6 = always). Examples of items for this construct include: “I feel happy when I am working intensely” (absorption), “I am enthusiastic about my job” (dedication), and “At my work, I feel bursting with energy” (vigor). The Portuguese version (Sinval et al. 2018) is supported by good validity evidence based on the internal structure, namely full-uniqueness second-order measurement invariance between countries, good reliability estimates values and evidence that suggest a second-order latent construct, work engagement. Work engagement was also found to successfully predicted by the QWL (Jenaro et al. 2011).
Procedure
Respondents from both samples completed the QWLS, OLBI and UWES-9
questionnaire. They also answered questions pertaining to demographics and career (i.e. age, gender, working years in the current organization, working years in the current job, working years in the current job sector). The data were collected through an online software LimeSurvey
(LimeSurvey GmbH 2017). The respondents were contacted individually or through the organization where they were working. Those organizations which accepted to disseminate the study to their employees were not provided access to the worker’s survey information. Both samples used a country’s major university (Brazil and Portugal) institutional website to provide study participants access to the survey. Sample 1’s response rate was 58.0% and 63.3% for Sample 2. Before completing the survey, participants were informed about the study, assuring them that this study was a research study and the employing organization would not have access to the responses of individual employees. Informed consent was obtained before survey
completion. The study and the survey instrument were approved by the Ethics Committee of the respective universities where the study was made accessible to the study participants.
Data Analysis
The statistical program R (R Core Team 2018) via the integrated development
environment, RStudio (RStudio Team 2018) was used for all statistical analyses. A confirmatory factor analysis (CFA) tested the factor structure of the QWLS, a second-order factor with seven first-order factors with a total of 16 items. The following indices were used to assess goodness of fit: TLI (Tucker Lewis Index), NFI (Normed Fit Index), χ2/df (ratio Chi-Square and Degrees of
Freedom), CFI (Comparative Fit Index), SRMR (Standardized Root Mean Square Residual), and the RMSEA (Root Mean Square Error of Approximation). Estimates smaller than 5 are
considered good for χ2/df, whereas estimates above .95 are also considered good for CFI, NFI
and TLI (Hu and Bentler 1999). Estimates below .08 are considered good for RMSEA and SRMR (Byrne 2010). The CFA analysis was conducted using the Weighted Least Squares Means and Variances (WLSMV) estimator proposed by Muthén (1983) through the package lavaan (Rosseel 2012). Descriptive statistics were obtained using the skimr package (McNamara et al.
2018). The Mardia’s multivariate kurtosis (Mardia 1970) was assessed to evaluate multivariate normality, and it was generated using the psych package (Revelle 2018). To test for convergent validity evidence, Average Variance Extracted (AVE) was estimated as described in Fornell and Larcker (1981) and Marôco (2014). Values of AVE ≥ .5 are considered indicative of convergent validity (Hair et al. 2014).
Reliability of the various dimensions was assessed through estimates of internal
consistency. Specifically, the αordinal and ωordinal were computed (Jorgensen et al. 2018). Values of
αordinal ≥ .7 andωordinal ≥ .7 are considered indicative of acceptable reliability. The second-order
factor reliability was also assessed using the various ω coefficients with the semTools package (Jorgensen et al. 2018): the proportion of observed variance explained by the second-order factor after controlling for the uniqueness of the first-order factor ωpartial L1, the proportion of the
second-order factor explaining the variance of the first-order factor level ωL2 and the proportion
of the second-order factor explaining the total score ωL1.Measurement invariance was evaluated
with the lavaan package (Rosseel 2012) using theta-parameterization for categorical items to compare a group of seven different models (Millsap and Yun-Tein 2004) and the second-order models’ invariance specifications (Rudnev et al. 2018): (a) configural invariance, (b) first-order factor loadings, (c) second-order structural loadings, (d) thresholds of measured variables (depending of the estimator and assumptions), (e) intercepts of first-order factors, (f)
disturbances of first-order factors, and (g) residual variances of observed variables. The causal SEM models were tested using lavaan to test validity based on relationships with other
constructs. The significance of the differences between model parameters in both groups was assessed using the Wald test (Buse 1982) through the lavaan package (Rosseel 2012) for
ANOVA test, using the ω2 as effect size measure and π as a statistical power indicator (Hays
1963) followed by Tukey’s HSD post-hoc test using the stats package (R Core Team 2018). The composite scores percentiles were computed using the doBy package (Højsgaard and Halekoh 2018).
Results
Validity Evidence Based on the Internal Structure
Dimensionality. We tested the dimensionality of the QWLS by examining the items’
distributional properties and factor-related validity evidence. With respect to the items’
distributional properties, Table 4 provides summary measures, skewness (Sk), kurtosis (Ku) and a histogram for each of the sixteen items of QWLS. The distributional properties and
psychometric sensitivity were analyzed based on these results. Absolute values of Sk smaller than 3, and of Ku smaller than 7 were considered as an indication that there are no severe violations in the normal distribution assumption (Finney and DiStefano 2013). And indeed no severe univariate normality violations were observed in both samples. The values of the Mardia’s multivariate kurtosis suggested that there was no multivariate normality for both samples (38.58, p < .001; 37.76, p < .001, for Brazil and Portugal respectively). All the items in both samples had all possible values, and no outliers were deleted. These distributional properties indicate
psychometric sensitivity, and that an estimator that does not assume multivariate normal distribution should be used. Thus, WLSMV estimator was selected suitably to ordinal scales.
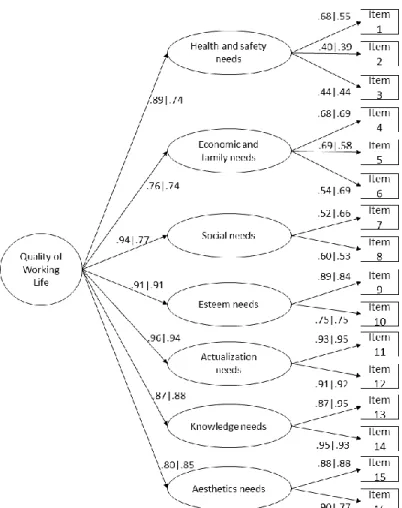
With respect to factor-related validity evidence, the original proposed second-order latent factor with seven first-order latent factors data fit was acceptable for both samples (H1; Figure 1): Sample 1 (Brazil) (χ2(97) = 479.314; χ2/df = 4.94, p < .001; n = 597; CFI = .992; NFI = .990;
Sample 2 (Portugal) (χ2(97) = 673.253; χ2/df = 6.94, p < .001; n = 566; CFI = .989; NFI = .987;
TLI = .987; SRMR = .077; RMSEA = .103; P(rmsea) ≤ .05) < .001, 90% CI ].095; .110[). All the
λ and γ were statistically significant. There were no items removed, however there were items with loadings below .45: two items for Sample 1 (λitem 2 = .40; and λitem 2 = .44), and two items
for Sample 2 (λitem 2 = .39; λitem 2 = .44). The obtained γ from the second-order factor to the
first-order factors were high, being the lowest γEF = 0.76 for Sample 1, γEF = 0.74 and γHS = 0.74 for
Sample 2. These values show that the second-order latent factor clearly captures the different first-order dimensions for both countries (H1).
To assess convergent validity, AVE was estimated for each first-order factor. Regarding Sample 1 (Brazil), the results indicate low values of AVE for three dimensions (AVEHS = .27;
AVEEF = .41; AVES = .32) and four factors with acceptable to high AVE values (AVEE = .67;
AVEA = .85; AVEK = .76; AVEAe = .79). For Sample 2 (Portugal), four dimensions showed
satisfactory AVE values (AVEE = .64; AVEA = .88; AVEK = .90; AVEAe = .69), and three
dimensions were unsatisfactory (AVEHS = .22; AVEEF = .43; AVES = .36). In sum, these results
provide acceptable convergent validity evidence for QWLS (H1).
Reliability of the Scores. To test for reliability, we conducted two tests, namely a test for
internal consistency of the first-order factors and an internal consistency test of the second-order factors. With respect to the internal consistency of the first-order factors, various internal
consistency estimates were generated to assess the evidence of the reliability of the various dimensions. The αordinal and ωordinal values for both samples first-order dimensions ranged from
acceptable to high (see Table 5). For Sample 1 (Brazil), two αordinal and three ωordinal values of the
first-order dimensions had reliability internal consistency values bellow .7, and for Sample 2 (Portugal) two αordinal and two ωordinal first-order dimensions’ values were below .7. The values of
the internal consistency of the first-order dimensions were satisfactory for the two samples. These results suggest an acceptable reliability of the dimensions (H2).
With respect to the internal consistency of the second-order factors, the estimated values were high for the two samples. For Sample 1 (Brazil), the proportion of the variance of the first-order factors explained by the second-first-order factor (ωL2) was .96, the proportion of the
second-order factor explaining the total score (ωL1) was .90, and the proportion of observed variance
explained by the second-order factor after controlling the uniqueness of the first-order factor (ωpartial L1) was .94. Sample 2 (Portugal) had a ωL2 = .95 of the proportion of the variance of the
first-order factors explained by the second-order factor. The ωL1 = .88 for the proportion of the
second-order factor explaining the total score (ωL1) and ωpartial L1 = .93 for the proportion of
observed variance explained by the second-order factor after controlling the uniqueness of the first-order factor. As such, these results suggest that the observed values of internal consistency for the second-order latent factor were acceptable (H2).
Measurement Invariance. To test if the same second-order latent model holds in each
country, and gender, a group of seven nested models with indications of equivalence was needed. The ΔCFI criterion (Cheung and Rensvold 2002) was selected over the Δχ2 criterion (Satorra and Bentler 2001) given the fact that the latter is too restrictive (Marôco 2014). To test measurement invariance between the two countries, Multi-group Confirmatory Factor Analysis (MGCFA) was conducted for the merged samples. Full-uniqueness second-order measurement invariance was obtained among the samples from Brazil and Portugal (H3). The ΔCFI < .01 was achieved in for all constrained models, contrary to the Δχ2. Regarding the measurement invariance for each gender group in two countries, full-uniqueness second-order measurement invariance was
observed (H3; Table 6). The ΔCFI ≤ .010 criterion was achieved for all the comparisons between the established models for invariance between male and female workers in each country.
Validity Evidence Based on Relationships with Other Constructs
The OLBI second-order factor model showed acceptable fit (χ2(85) = 974.653; χ2/df =
11.47; p < .001; n = 1,103; CFI = .986; NFI = .984; TLI = .982; SRMR = .064; RMSEA = .097;
P(rmsea) ≤ .05) < .001; 90% CI ].092; .103 [). The UWES-9 second-order model also obtained
acceptable fit (χ2(25) = 434.518; χ2/df = 17.38; p < .001; n = 1,092; CFI = .998; NFI = .998; TLI
= .997; SRMR = .041; RMSEA = .123; P(rmsea) ≤ .05) < .001; 90% CI ].113; .133[). Both in terms of first- and second-order latent factors the reliability of the scores in terms of internal consistency for UWES-9 (ωvigor = .94; ωdedication = .92; ωabsorption = .88; ωpartial L1 = .97; ωL1 = .93;
ωL2 = .96) and OLBI (ωdisengagement = .87; ωexhaustion = .89; ωpartial L1 = .94; ωL1 = .86; ωL2 = .91)
were considered good evidence.
The causal model of QWL’s lower-needs satisfaction predicting work engagement (H4a) had a good fit (χ2(86) = 593.937; χ2/df = 6.91, p < .001; n = 1,092; CFI = .998; NFI = .987; TLI =
.997; SRMR = .041; RMSEA = .074; P(rmsea) ≤ .05) < .001, 90% CI ].068; .079[), indicating a large and positive effect (βQWL L-N -> WE = .55; p < .001). No statistically significant differences
were found between the Brazilian and the Portuguese samples for this relationship (Δχ2 = 0.33;
Δdf = 1; p = .564; βBrazil = .61; βPortugal = .46).
The causal model of work engagement being predicted by QWL’s higher-needs (H4b) had a good fit (χ2(288) = 917.721; χ2/df = 6.37, p < .001; n = 1,092; CFI = .998; NFI = .997; TLI
= .997; SRMR = .040; RMSEA = .070; P(rmsea) ≤ .05) < .001, 90% CI ].066; .075[) indicating a positive and large effect (βQWL H-N -> WE = .79; p < .001). No statistically significant differences
were found between the Brazilian and the Portuguese samples for this relationship (Δχ2 = 0.31;
Δdf = 1; p = .580; βBrazil = .80; βPortugal = .77).
The causal model of QWL’s lower-needs predicting burnout (H4c) had a good fit (χ2(181) = 1,340.125; χ2/df = 7.40, p < .001; n = 1,103; CFI = .983; NFI = .981; TLI = .981;
SRMR = .058; RMSEA = .076; P(rmsea) ≤ .05) < .001, 90% CI ].072; .080[) indicating a large
and negative effect (βQWL L-N -> B = -.63; p < .001). No statistically significant differences were
found between the Brazilian and the Portuguese samples for this relationship (Δχ2 = 0.40; Δdf =
1; p = .527; βBrazil = -.66; βPortugal = -.57).
The causal model of burnout being predicted by QWL’s higher-needs (H4d) had an acceptable fit (χ2(264) = 2,716.279; χ2/df = 10.29, p < .001; n = 1,103; CFI = .987; NFI = .986;
TLI = .986; SRMR = .066; RMSEA = .092; P(rmsea) ≤ .05) < .001, 90% CI ].089; .095[)
indicating a negative and large effect (βQWL H-N -> B = -.83; p < .001). No statistically significant
differences were found between the Brazilian and the Portuguese samples for this relationship (Δχ2 = 2.29; Δdf = 1; p = .130; β
Brazil = -.82; βPortugal = -.85). QWL Comparisons among Gender and Country Categories
Comparisons of the means of the QWLS’ dimensions and overall mean score between the groups that obtained measurement invariance were performed (see Table 7). The results of two-way ANOVA (gender and country) indicate that the country-gender interaction effect was significant only for actualization needs (H5). The results also show that there are significant gender differences between three QWLS dimensions and the overall mean score and that there are significant country differences in five QWLS dimensions (see Table 7). In terms of
satisfaction of the lower-order needs statistically significant differences were found, being higher in males (Δχ2
higher-order needs, no differences were found among genders (Δχ2
scaled = 3.326, Δdf = 1, p = 0.068, d =
- 0.136). Although not hypothesized, we tested whether there are country differences in
satisfactions of higher-order needs and satisfaction of lower-order needs. The results indicate that there is no significant difference in the satisfaction of lower-order needs (Δχ2
scaled = 1.039, Δdf =
1, p = 0.308, d = 0.089) or satisfaction of higher-order needs (Δχ2
scaled = 2.443, Δdf = 1, p =
0.118, d = - 0.101). For comparative proposes with other studies using the QWLS, the
correspondent means and quartiles of each QWLS’ dimensions and QWLS’ overall composite mean score for gender and country are shown in Table 8.
Discussion
The QWL is an important construct in organizational settings given that it is related to life and job satisfaction, general well-being, organizational and affective commitment, turnover intention, and team spirit (Arndt et al. 2015; Chan and Wyatt 2007; Koonmee and Virakul 2007; Lee et al. 2007). To measure QWL effectively, it is necessary to ensure that the measure is valid across settings, countries, and gender groups. The measurement instrument of QWL is QWLS. Our study findings provide good validity evidence based on the internal structure and based on relationships with other variables (American Educational Research Association et al. 2014). With respect to the H1, the study findings show acceptable goodness-of-fit to the original structure of the QWLS using two samples (Portugal and Brazil), thus supporting H1.
Three previous studies conducted a confirmatory factor analysis on the seven-factor version of QWLS (Afsar and Burcu 2014; Marta et al. 2013; Rastogi et al. 2018). Unlike the second-order structure in this study, Rastogi, Rangnekar, and Rastogi (2018) tested a seven-factor first-order model. Afsar and Burcu (2014) tested the first- and second-order models with a minimum = .56, which is lower than the minimum obtained in our study (HS Portugal = 0.74; and
EF Portugal = 0.74). Marta et al. (2013) tested the QWLS as a second-order model with the lowest being .46 (social needs dimension). That measure used a single item to capture social needs and esteem needs. Overall, the second-order structure of the QWLS measure used in this study provided a good fit to the data.
The results indicate that the QWLS measure in this study has good reliability for both samples, supporting H2. The QWLS had high second-order internal consistency estimates for samples 1 and 2, the first-order dimensions had estimates that varied from unsatisfactory to very good. The study of Afsar and Burcu (2014) was the only one that reported internal consistency estimates for the seven first-order factors separately, however the reliability internal consistency values that were published were only based on Cronbach’s α tests, instead of the more
appropriate ω coefficients, which were used in our study. However, none of the studies provided second-order latent variable estimates (Jorgensen et al. 2018) as was done in our study.
H3 deals with measurement invariance. The results indicate that measurement invariance was achieved across the country and gender. This is the first study that tested measurement invariance across gender and country. The findings confirm the cultural similarities between Portugal and Brazil (Vargas et al. 2017).
H4 deals with the nomological validity of the measure. The results indicate that two dimensions of QWLS are positively related to work engagement and are negative to burnout. These results provide support for H4. The effect size was large in all cases suggesting that the QWLS measure has predictive validity, and that predictive validity is consistent across country samples. The QWLS predictive paths in relation to work engagement and burnout suggested that QWL’s higher-needs play a stronger impact than QWL’s lower-order needs. Energetic
workers. Specifically, we compared the mean of QWLS need satisfaction between the two country samples. The results indicate that the Portuguese sample had a higher mean score for health and safety need satisfaction, whereas the Brazilian sample had a higher mean score for economic and family need satisfaction, knowledge needs satisfaction, aesthetics need satisfaction and social need satisfaction. This is consistent with the importance of creativity and social roles of Brazilian workers as documented by Garibaldi de Hilal (2009). In the Brazilian culture,
personal and friendly treatment of workers is the cultural norm; this social phenomenon is known as jeitinho brasileiro (“the Brazilian way”) (Hofstede et al. 2010).
The importance of social roles is fundamental in Brazilian organizations. Social roles among Brazilian workers are used to help deal with work demand, providing the desired
flexibility and adaptability. This is the reflex of the Cordial Man, which moves the worker by the
ethos of emotion, seeking to suppress “distance” imposed by the hierarchy (Holanda 2012), looking to overcome formalism that marks social relations and applying to them a more personal
form (Rosa et al. 2006) where they look for proximity within society’s hierarchy (Freitas 2007; Motta 2007). As such, having the workers’ social needs and aesthetic needs met should be an important priority for Brazilian firms. In contrast, in Portugal, the formality in work relations seem to be more grounded (Dias et al. 2010).
We compared the mean of QWLS need satisfaction dimensions between gender groups. The results indicate that male workers had higher mean satisfaction scores on lower-order needs, higher-order needs, and overall QWL. These findings show that male workers may feel more satisfied at work than female workers. However, this need satisfaction is limited mainly to lower-order needs (familial and economic needs; health and security needs) for both Brazilian and Portuguese samples. This finding is similar to the study involving Thai and USA workers, where
gender disparities were found between males and females in the sample from Thailand with respect to lower-order needs (Mohan and Suppareakchaisakul 2014). Gender differences observed in the present study can be related to gender-role norms in regards to work and family life. Namely, female workers, when assuming the role of housewife, do not always receive the expected support from organizations to sustain their performance in dual roles — work and family roles (Donnelly et al. 2016). Gender disparities are reported to exist in both countries (Cardoso et al. 2016; Lyonette et al. 2007; Santos and Garibaldi de Hilal 2018).
With respect to the interaction effect between country (Brazil and Portugal) and gender, the study findings show a significant interaction in relation to only one dimension, namely, actualization needs among Brazilian males and females. In Portugal, the actualization dimension did not differ significantly between male and female workers. In contrast, Brazilian female workers do not feel that their potential is realized compared to Brazilian males. This was suggested by a study with Brazilian females which reported that companies give preference to male workers with respect to promotion and opportunities for supervisor roles (Santos and Garibaldi de Hilal 2018). In fact, this study’s findings reveal that QWL differences between male and female workers can change depending on the country. Additionally, Brazilian workers did not score higher on all QWLS’ dimensions. We found that Brazilian workers have higher satisfaction ratings on three specific higher-order needs (i.e., social needs, knowledge needs, aesthetics needs), whereas Portuguese workers have higher satisfaction ratings on a specific lower-order need (i.e., health and safety needs). Although not hypothesized, we found that there is no latent mean difference in higher- and lower-order needs between the two countries. It should be noted that QWL differences between the countries are influenced by a host of country characteristics (economic conditions, political conditions, immigration policy, etc.),
organizational characteristics (company policy, supervisory support, working environment, etc.), as well as employee demographics (age, education, work experience, type of occupation, etc.). As such, it is difficult to reach a firm conclusion at this stage about what causes the QWL difference between the two countries. Future research should be conducted to compare QWL differences with matching samples from the two countries while controlling organizational and individual characteristics. One way of doing so is to compare the QWL of employees working in subsidiaries of the same global company operating in the two countries. In this study Portugal and Brazil were in different moments of socioeconomical transition. Portugal was recovering from the crisis, with the economy growing faster than the European Union average for the first time in 15 years, and the unemployment felling sharply (Reis 2015). While Brazil was entering on a deep political crisis, marked with big scandals of corruption and the President’s
impeachment causing bi instability (Green et al. 2019). An extended crisis in parallel to
socioeconomic problems (i.e., growing inflation) associated with other Brazil’s historic problems (e.g., corruption and violence/crime) (Alban 2018).
Future research can formally test antecedents to QWLS in a nomological network in the two countries. For example, one can argue that higher-order needs of QWL are influenced by cultural values (e.g., creativity, flexibility), whereas lower-order needs of QWL is influenced by the level of economic development (e.g., per capita GDP).
Conclusion
Greater QWL can be achieved if workers’ and organizations’ goals are matched (Ramawickrama et al. 2017). Improving QWL is a goal of the European Union, given that it fosters workplace innovation and sustainable work (e.g., Greenan et al. 2014). Thus, it is important to keep in mind the observed differences between males and females workers in
relation to occupational health and safety (e.g., Stallones 2004), as well as well-being and life satisfaction of workers (e.g., Page and Vella-Brodrick 2012; Sirgy 2001). This study contributes important information about the validity of the QWLS instrument to help researchers use the QWLS measure with greater confidence concerning its internal structure and its relation to other behavioral constructs such as work engagement and burnout.
The present study has its limitations. The study used convenience samples. As such, future research should test the validity of the QWLS using representative samples.
Representative samples should be obtained to reflect the dominant profile of workers in each country including the less-developed states and districts within (Henrich et al. 2010). The
differences among Portuguese and Brazilian workers should also be analyzed with caution, given the timeframe and the specific economic conditions that were in flux both in Brazil and Portugal during the period of the data collection. We hope that future research would continue this line of investigation to further support the use of the QWLS across a more diverse set of countries, cultures, specific occupations and demographic groups.
References
Abdollahzade, F., Asghari, E., Asghari Jafarabadi, M., Mohammadi, F., Rohan, A., & Mardani-Kivi, M. (2016). Predictive factors of quality of work life among operating room nurses in training hospitals. Journal of Guilan University of Medical Sciences, 25(99), 57–68. http://journal.gums.ac.ir/article-1-1285-en.html
Afsar, S. T., & Burcu, E. (2014). The adaptation and validation of Quality of Work Life Scale to Turkish culture. Applied Research in Quality of Life, 9(4), 897–910. doi:10.1007/s11482-013-9276-0
Alban, M. (2018). The degradation of Brazilian socioeconomics. Brazilian Journal of Political
Economy, 38(1), 167–183. doi:10.1590/0101-31572018v38n01a10
American Educational Research Association, American Psychological Association, & National Council on Measurement in Education. (2014). Standards for Educational and
Psychological Testing. Washington, DC, USA: American Psychological Association.
Arndt, A. D., Singhapakdi, A., & Tam, V. (2015). Consumers as employees: the impact of social responsibility on quality of work life among Australian engineers. Social Responsibility
Journal, 11(1), 98–108. doi:10.1108/SRJ-06-2013-0075
Bakker, A. B., & Demerouti, E. (2008). Towards a model of work engagement. Career
Development International, 13(3), 209–223. doi:10.1108/13620430810870476
Bakker, A. B., Demerouti, E., & Sanz-Vergel, A. I. (2014). Burnout and work engagement: The JD–R approach. Annual Review of Organizational Psychology and Organizational
Behavior, 1(1), 389–411. doi:10.1146/annurev-orgpsych-031413-091235
Bakker, A. B., Demerouti, E., & Verbeke, W. (2004). Using the job demands-resources model to predict burnout and performance. Human Resource Management, 43(1), 83–104.
doi:10.1002/hrm.20004
Bureau of Labor Statistics. (2017). Highlights of women’s earnings in 2016 (No. 1069). Washington, DC, USA: Author.
Buse, A. (1982). The Likelihood Ratio, Wald, and Lagrange Multiplier tests: An expository note.
The American Statistician, 36(3a), 153–157. doi:10.1080/00031305.1982.10482817
Byrne, B. M. (2010). Structural Equation Modeling with AMOS (3rd ed.). New York, NY, USA: Routledge. doi:10.4324/9781410600219
Campos, J. A. D. B., Carlotto, M. S., & Marôco, J. (2012). Oldenburg Burnout Inventory - student version: Cultural adaptation and validation into Portuguese. Psicologia: Reflexão e
Crítica, 25(4), 709–718. doi:10.1590/S0102-79722012000400010
Cardoso, A. R., Guimarães, P., & Portugal, P. (2016). What drives the gender wage gap? A look at the role of firm and job-title heterogeneity. Oxford Economic Papers, 68(2), 506–524. doi:10.1093/oep/gpv069
Cavalcanti, L., Oliveira, A. T. de, Araujo, D., & Tonhati, T. (Eds.). (2017). A inserção dos
imigrantes no mercado de trabalho brasileiro: Relatório anual 2017. Brasília, DF, Brazil:
OBMigra. http://obmigra.mte.gov.br/index.php/ relatorio-anual
Cetrano, G., Tedeschi, F., Rabbi, L., Gosetti, G., Lora, A., Lamonaca, D., et al. (2017). How are compassion fatigue, burnout, and compassion satisfaction affected by quality of working life? Findings from a survey of mental health staff in Italy. BMC Health Services Research,
17(1), 1–11. doi:10.1186/s12913-017-2726-x
Chan, K. W., & Wyatt, T. A. (2007). Quality of work life: A study of employees in Shanghai, China. Asia Pacific Business Review, 13(4), 501–517. doi:10.1080/13602380701250681 Cheung, G. W., & Rensvold, R. B. (2002). Evaluating goodness-of-fit indexes for testing
measurement invariance. Structural Equation Modeling: A Multidisciplinary Journal, 9(2), 233–255. doi:10.1207/S15328007SEM0902_5
Connerley, M. L., & Wu, J. (Eds.). (2016). Handbook on well-being of working women. Dordrecht, Netherlands: Springer. doi:10.1007/978-94-017-9897-6
Costa, H. A., & Costa, E. S. (2017). Precariousness and call centre work: Operators’ perceptions in Portugal and Brazil. European Journal of Industrial Relations, 1–17.
Danna, K., & Griffin, R. W. (1999). Health and well-being in the workplace: A review and synthesis of the literature. Journal of Management, 25(3), 357–384.
de Jong, M., de Boer, A. G. E. M., Tamminga, S. J., & Frings-Dresen, M. H. W. (2015). Quality of working life issues of employees with a chronic physical disease: A systematic review.
Journal of Occupational Rehabilitation, 25(1), 182–196. doi:10.1007/s10926-014-9517-6
Demerouti, E., & Bakker, A. B. (2008). The Oldenburg Burnout Inventory: A good alternative to measure burnout and engagement. In J. R. B. Halbesleben (Ed.), Handbook of stress and
burnout in health care (pp. 65–78). New York, NY, USA: Nova Science.
http://www.beanmanaged.com/doc/pdf/arnoldbakker/articles/articles_arnold_bakker_173.p df
Dias, S., Queirós, C., & Carlotto, M. S. (2010). Burnout syndrome and associated factors among health professionals: A comparative study between Brazil and Portugal. Aletheia, 32, 4–21. Donnelly, K., Twenge, J. M., Clark, M. A., Shaikh, S. K., Beiler-May, A., & Carter, N. T.
(2016). Attitudes toward women’s work and family roles in the United States, 1976–2013.
Psychology of Women Quarterly, 40(1), 41–54. doi:10.1177/0361684315590774
Easton, S. A., & Van Laar, D. L. (2018). User manual for the Work-Related Quality of Life
(WRQoL) scale: A mesure of quality of working life (2nd ed.). Portsmouth, UK: University
of Portsmouth All. doi:10.17029/EASTON2018
Easton, S. A., Van Laar, D. L., & Marlow-Vardy, R. (2013). Quality of working life and the police. Management, 3(3), 135–141. doi:10.5923/j.mm.20130303.01
Efraty, D., & Sirgy, M. J. (1990). The effects of quality of working life (QWL) on employee behavioral responses. Social Indicators Research, 22(1), 31–47. doi:10.1007/BF00286389 Elizur, D., & Shye, S. (1990). Quality of work life and its relation to quality of life. Applied
Psychology: An International Review, 39(3), 275–291.
doi:10.1111/j.1464-0597.1990.tb01054.x
Ernst Kossek, E., & Ozeki, C. (1998). Work-family conflict, policies, and the job-life satisfaction relationship: A review and directions for organizational behavior-human resources research.
Eurofound. (2017). Sixth European Working Conditions Survey - Overview report (2017 update). Luxembourg, Luxembourg: Publications Office of the European Union.
doi:10.2806/422172
Finney, S. J., & DiStefano, C. (2013). Non-normal and categorical data in structural equation modeling. In G. R. Hancock & R. O. Mueller (Eds.), Structural equation modeling: A
second course (2nd ed., pp. 439–492). Charlotte, NC, USA: Information Age Publishing.
Fornell, C., & Larcker, D. F. (1981). Evaluating structural equation models with unobservable variables and measurement error. Journal of Marketing Research, 18, 39–50.
doi:10.2307/3151312
Freitas, A. B. de. (2007). Traços brasileiros para uma análise organizacional. In F. C. P. Motta & M. P. Caldas (Eds.), Cultura organizacional e cultura brasileira (pp. 38–54). São Paulo, SP, Brazil: Atlas.
Garibaldi de Hilal, A. V. (2009). Cultural mythology and global leadership. (E. H. Kessler & D. J. Wong-MingJi, Eds.). Cheltenham, UK: Edward Elgar.
Green, J. N., Langland, V., & Schwarcz, L. M. (Eds.). (2019). The Brazil reader: History,
culture, politics (2nd ed.). Durham, NC, USA: Duke University Press.
Greenan, N., Kalugina, E., & Walkowiaky, E. (2014). Has the quality of working life improved in the EU-15 between 1995 and 2005? Industrial and Corporate Change, 23(2), 399–428. doi:10.1093/icc/dtt012
Hair, J. F., Black, W. C., Babin, B. J., & Anderson, R. E. (2014). Multivariate data analysis:
Pearson new international edition (7th ed.). Harlow, England: Pearson.
http://www.pearsonhighered.com/educator/product/Multivariate-Data-Analysis/9780138132637.page
Hays, W. L. (1963). Statistics for psychologists. New York, NY, USA: Holt, Rinehart, Winston. Henrich, J., Heine, S. J., & Norenzayan, A. (2010). The weirdest people in the world?
Behavioral and Brain Sciences, 33(2–3), 61–83. doi:10.1017/S0140525X0999152X
Comparing regional cultures within a country: Lessons from Brazil. Journal of
Cross-Cultural Psychology, 41(3), 336–352. doi:10.1177/0022022109359696
Højsgaard, S., & Halekoh, U. (2018). doBy: Groupwise statistics, LSmeans, linear contrasts, utilities (R package version 4.6-2) [Computer software].
https://cran.r-project.org/package=doBy
Holanda, S. B. de. (2012). O homem cordial. São Paulo, SP, Brazil: Penguin & Companhia das Letras.
Horst, C., Pereira, S., & Sheringham, O. (2016). The impact of class on feedback mechanisms: Brazilian migration to Norway, Portugal and the United Kingdom. In O. Bakewell, G. Engbersen, M. L. Fonseca, & C. Horst (Eds.), Beyond networks: Feedback in international
migration (pp. 90–112). London, UK: Palgrave Macmillan. doi:10.1057/9781137539212_5
Hsu, M.-Y. (2016). A quality of working life survey instrument for hospital nurses. Journal of
Nursing Research, 24(1), 87–99. doi:10.1097/jnr.0000000000000098
Hu, L., & Bentler, P. M. (1999). Cutoff criteria for fit indexes in covariance structure analysis: Conventional criteria versus new alternatives. Structural Equation Modeling: A
Multidisciplinary Journal, 6(1), 1–55. doi:10.1080/10705519909540118
International Labour Office. (2012). International Standard Classification of Occupations.
Isco-08 (Vol. I). Geneva, Switzerland: International Labour Organization.
doi:10.13140/RG.2.1.1419.3126
International Organization for Migration (Ed.). (2017). World migration report 2018. Geneva, Switzerland: Author. https://www.iom.int/wmr/world-migration-report-2018
International Test Commission. (2018). ITC Guidelines for Translating and Adapting Tests (second edition). International Journal of Testing, 18(2), 101–134.
doi:10.1080/15305058.2017.1398166
Jenaro, C., Flores, N., Orgaz, M. B., & Cruz, M. (2011). Vigour and dedication in nursing professionals: Towards a better understanding of work engagement. Journal of Advanced
Jorge, M. R. (1998). Adaptação transcultural de instrumentos de pesquisa em saúde mental.
Revista de Psiquiatria Clínica, 25(5), 233–239.
Jorgensen, T. D., Pornprasertmanit, S., Schoemann, A. M., & Rosseel, Y. (2018). semTools: Useful tools for structural equation modeling (R package version 0.5-1) [Computer software]. https://cran.r-project.org/package=semTools
Kanten, S., & Sadullah, O. (2012). An empirical research on relationship quality of work life and work engagement. Procedia - Social and Behavioral Sciences, 62, 360–366.
doi:10.1016/j.sbspro.2012.09.057
Knox, S., & Irving, J. A. (1997). An interactive quality of work life model applied to organizational transition. The Journal of Nursing Administration, 27(1), 39–47. doi:10.1097/00005110-199701000-00009
Koonmee, K., Singhapakdi, A., Virakul, B., & Lee, D.-J. (2010). Ethics institutionalization, quality of work life, and employee job-related outcomes: A survey of human resource managers in Thailand. Journal of Business Research, 63(1), 20–26.
doi:10.1016/j.jbusres.2009.01.006
Koonmee, K., & Virakul, B. (2007). Ethics, quality of work life, and employee job-related outcomes: A survey of HR and marketing managers in Thai business. NIDA Development
Journal, 47(4), 67–97. doi:10.14456/ndj.2007.3
Lau, R. S. M., & May, B. E. (1998). A win-win paradigm for quality of work life and business performance. Human Resource Development Quarterly, 9(3), 211–226.
doi:10.1002/hrdq.3920090302
Lee, D.-J., Singhapakdi, A., & Sirgy, M. J. (2007). Further validation of a need-based Quality-of-Work-Life (QWL) measure: Evidence from marketing practitioners. Applied Research in
Quality of Life, 2(4), 273–287. doi:10.1007/s11482-008-9042-x
Lewis, J. (2009). Work–family balance, gender and policy. Northampton, MA, USA: Edward Elgar. doi:10.4337/9781848447400
LimeSurvey GmbH. (2017). LimeSurvey: An open source survey tool [Computer software]. Hamburg, Germany: Author. http://www.limesurvey.org
Louis, K. S. (1998). Effects of teacher quality of work life in secondary schools on commitment and sense of efficacy. School Effectiveness and School Improvement, 9(1), 1–27.
doi:10.1080/0924345980090101
Lyonette, C., Crompton, R., & Wall, K. (2007). Gender, occupational class and work-life conflict: A comparison of Britain and Portugal. Community, Work & Family, 10(3), 283– 308. doi:10.1080/13668800701456245
Mardia, K. V. (1970). Measures of multivariate skewness and kurtosis with applications.
Biometrika, 57(3), 519–530. doi:10.1093/biomet/57.3.519
Marôco, J. (2014). Análise de equações estruturais: Fundamentos teóricos, software &
aplicações (2nd ed.). Pêro Pinheiro, Portugal: ReportNumber.
Marôco, J., Campos, J. A. D. B., Vinagre, M. da G., & Pais-Ribeiro, J. L. (2014). Adaptação transcultural Brasil-Portugal da Escala de Satisfação com o Suporte Social para estudantes do ensino superior. Psicologia: Reflexão e Crítica, 27(2), 247–256. doi:10.1590/1678-7153.201427205
Marta, J. K. M., Singhapakdi, A., Lee, D.-J., Sirgy, M. J., Koonmee, K., & Virakul, B. (2013). Perceptions about ethics institutionalization and quality of work life: Thai versus American marketing managers. Journal of Business Research, 66(3), 381–389.
doi:10.1016/j.jbusres.2011.08.019
Martel, J.-P., & Dupuis, G. (2006). Quality of work life: Theoretical and methodological problems, and resentation of a new model and measuring instrument. Social Indicators
Research, 77(2), 333–368. doi:10.1007/s11205-004-5368-4
McNamara, A., Arino de la Rubia, E., Zhu, H., Ellis, S., & Quinn, M. (2018). skimr: Compact and flexible summaries of data (R package version 1.0.3) [Computer software].
https://cran.r-project.org/package=skimr
Millsap, R. E., & Yun-Tein, J. (2004). Assessing factorial invariance in ordered-categorical measures. Multivariate Behavioral Research, 39(3), 479–515.
doi:10.1207/S15327906MBR3903_4
life among university teachers in Thailand and Malaysia. International Journal of
Behavioral science, 9(2), 1–16.
https://www.tci-thaijo.org/index.php/IJBS/article/view/20099/pdf
Motta, F. C. P. (2007). Cultura e organizações no Brasil. In F. C. P. Motta & M. P. Caldas (Eds.),
Cultura organizacional e cultura brasileira (pp. 25–37). São Paulo, SP, Brazil: Atlas.
Muthén, B. O. (1983). Latent variable structural equation modeling with categorical data.
Journal of Econometrics, 22(1–2), 43–65. doi:10.1016/0304-4076(83)90093-3
Nimalathasan, B., & Ather, S. M. (2010). Quality of work life (QoWL) and job satisfaction (JS): A study of academic professionals of private universities in Bangladesh. In Annual
Research Conference (ARC)-2010. Jaffna, Sri Lanka: University of Jaffna.
OECD. (2018). International migration outlook 2018. Paris, France: Author. doi:10.1787/migr_outlook-2018-en
Ollier-Malaterre, A., & Foucreault, A. (2017). Cross-national work-life research: Cultural and structural impacts for individuals and organizations. Journal of Management, 43(1), 111– 136. doi:10.1177/0149206316655873
Page, K. M., & Vella-Brodrick, D. A. (2012). From nonmalfeasance to beneficence: Key criteria, approaches, and ethical issues relating to positive employee health and well-being. In N. P. Reilly, M. J. Sirgy, & C. A. Gorman (Eds.), Work and quality of life: Ethical practices in
organizations (pp. 463–489). Dordrecht, Netherlands: Springer.
doi:10.1007/978-94-007-4059-4_25
R Core Team. (2018). R: A language and environment for statistical computing (version 3.5.1) [Computer software]. Vienna, Austria: R Foundation for Statistical Computing.
https://www.r-project.org/
Ramawickrama, J., Opatha, H. H. D. N. P., & Pushpakumari, M. D. (2017). Quality of work life, job satisfaction, and the facets of the relationship between the two constructs. International
Business Research, 10(4), 167–182. doi:10.5539/ibr.v10n4p167
Rastogi, M., Rangnekar, S., & Rastogi, R. (2018). Psychometric evaluation of need-based quality of work life scale in an Indian sample. Industrial and Commercial Training, 50(1), 10–19.
doi:10.1108/ICT-06-2017-0041
Reis, R. (2015). Looking for a success in the Euro crisis adjustment programs: The Case of Portugal. Brookings Papers on Economic Activity, 458, 433–458.
doi:10.1353/eca.2015.0010
Revelle, W. (2018). psych: Procedures for psychological, psychometric, and personality research (R package version 1.8.12) [Computer software]. Evanston, IL: Northwestern University. https://cran.r-project.org/package=psych
Rosa, A. R., Tureta, C., & Brito, M. J. de. (2006). Cultura organizacional e cultura brasileira revisitadas: Uma atualização hermenêutica do dilema brasileiro. Revista Eletrônica de
Gestão Organizacional, 4(3), 3–17.
https://periodicos.ufpe.br/revistas/gestaoorg/article/view/21482
Rosseel, Y. (2012). lavaan: An R package for structural equation modeling. Journal of Statistical
Software, 48(2), 1–21. doi:10.18637/jss.v048.i02
RStudio Team. (2018). RStudio: Integrated development for R (version 1.1.463) [Computer software]. Boston, MA, USA: RStudio, Inc. http://www.rstudio.com/
Rudnev, M., Lytkina, E., Davidov, E., Schmidt, P., & Zick, A. (2018). Testing measurement invariance for a second-order factor. A cross-national test of the Alienation Scale. Methods,
Data, Analyses, 12(1), 47–76. doi:10.12758/mda.2017.11
Saha, S., & Kumar, S. P. (2016). Empirical validation of dimensionality of quality of work life in India. International Journal of Applied Business and Economic Research, 14(6), 4253– 4266. http://www.serialsjournals.com/serialjournalmanager/pdf/1499751958.pdf
Santos, C., & Garibaldi de Hilal, A. V. (2018). Same, same but different? Women’s experiences with gender inequality in Brazil. Employee Relations, 40(3), 486–499. doi:10.1108/ER-04-2017-0094
Satorra, A., & Bentler, P. M. (2001). A scaled difference chi-square test statistic for moment structure analysis. Psychometrika, 66(4), 507–514. doi:10.1007/BF02296192
with burnout and engagement: A multi-sample study. Journal of Organizational Behavior,
25(3), 293–315. doi:10.1002/job.248
Schaufeli, W. B., & Bakker, A. B. (2010). Defining and measuring work engagement: Bringing clarity to the concept. In A. B. Bakker & M. P. Leiter (Eds.), Work engagement: A
handbook of essential theory and research (pp. 10–24). New York, NY: Psychology Press.
http://psycnet.apa.org/psycinfo/2010-06187-002
Schaufeli, W. B., Salanova, M., González-Romá, V., & Bakker, A. B. (2002). The measurement of engagement and burnout: A two sample confirmatory factor analytic approach. Journal
of Vocational Behavior, 3(1), 71–92. doi:10.1023/A:1015630930326
Serviço de Estrangeiros e Fronteiras. (2018). Relatório de imigração, fronteiras e asilo 2017. Lisbon, Portugal: Author. http://sefstat.sef.pt/Docs/Rifa_2014.pdf
Singhapakdi, A., Sirgy, M. J., Lee, D.-J., Senasu, K., Yu, G. B., & Nisius, A. M. (2014). Gender disparity in job satisfaction of Western versus Asian managers. Journal of Business
Research, 67(6), 1257–1266. doi:10.1016/j.jbusres.2013.04.004
Sinval, J., Pasian, S. R., Queirós, C., & Marôco, J. (2018). Brazil-Portugal transcultural adaptation of the UWES-9: Internal consistency, dimensionality, and measurement invariance. Frontiers in Psychology, 9. doi:10.3389/fpsyg.2018.00353
Sinval, J., Queirós, C., Pasian, S. R., & Marôco, J. (2019). Transcultural adaptation of the Oldenburg Burnout Inventory (OLBI) for Brazil and Portugal. Frontiers in Psychology, 9. doi:10.3389/fpsyg.2019.00338
Sirgy, M. J. (2001). Handbook of quality-of-life research: An ethical marketing perspective. Dordrecht, The Netherlands: Springer. doi:10.1007/978-94-015-9837-8
Sirgy, M. J., Efraty, D., Siegel, P., & Lee, D.-J. (2001). A new measure of quality of work life (QWL) based on need satisfaction and spillover theories. Social Indicators Research, 55(3), 241–302. doi:10.1023/A:1010986923468
Souza, J. C., Paiva, T., & Reimão, R. (2008). Sleep, quality of life and accidents in the lives of Brazilian and Portuguese truck drivers. Psicologia em Estudo, 13(3), 429–436.