Assessment of ultrafine particles in Portuguese pre-schools: levels and exposure doses
Jimmy Fonsecaa, Klara Slezakovaa,b, Simone Moraisb, Maria do Carmo Pereiraa* a
LEPABE, Departamento de Engenharia Química, Faculdade de Engenharia, Universidade do Porto, Rua Dr. Roberto Frias, 4200-465 Porto, Portugal
b
REQUIMTE, Instituto Superior de Engenharia do Porto, Instituto Politécnico do Porto, Rua Dr. António Bernardino de Almeida 431, 4200-072 Porto, Portugal
*Corresponding author: Tel.: +351 22 508 1590, Fax: +351 22 508 1449 E-mail: mcsp@fe.up.pt
Practical implications
This study reports information on ultrafine particles in various indoor and outdoor micro-environments (canteens, classrooms, gymnasiums, outdoor) of urban and rural pre-schools. It identifies the potential sources and origins; characterize the influence of meteorological parameters on UFP levels and perform a comparison with other existing international studies. To this date relatively few studies have investigated ultrafine particles (UFP) in pre-schools (none in Portugal) and none assessed exposure dose for different age-groups. The obtained findings showed that levels of UFP in various microenvironments of schools differed significantly. Therefore, in order to obtain an accurate representation of child’s overall school exposure profiles, the exposures occurring in these different microenvironments should be always accounted for.
2 3 4 5 6 7 8 9 10 11 12 13 14 15 16 17 18 19 20 21 22 23 24 25 26 27 28 29 30 31 32 33 34 35 36 37 38 39 40 41 42 43 44 45 46 47 48 49 50 51 52 53 54 55 56 57
This article was published in Indoor Air, 24 (1), 618-628, 2014 http://dx.doi.org/10.1111/ina.12114
PROOF
Abstract 23
The aim of this work was to assess ultrafine particle (UFP) number concentrations in 24
different microenvironments of Portuguese pre-schools and to estimate the respective 25
exposure doses of UFP for 3-5 years old children (in comparison to adults). UFP were 26
sampled both indoors and outdoors in two urban (US1, US2) and one rural (RS1) pre-27
school located in north of Portugal for 31 days. Total levels of indoor UFP were 28
significantly higher at the urban pre-schools (mean of 1.82×10⁴ and 1.32×10⁴ particles 29
cm-3 at US1 an US2, respectively) than at the rural one (1.15×10⁴ particles cm-3). 30
Canteens were the indoor microenvironment with the highest UFP (mean of 5.17×10⁴, 31
3.28×10⁴, and 4.09×10⁴ particles cm-3 at US1, US2, and RS1) whereas the lowest 32
concentrations were observed in classrooms (9.31×10³, 11.3×10³, and 7.14×10³ 33
particles cm-3 at US1, US2, and RS1). Mean indoor/outdoor ratios (I/O) of UFP at three 34
pre-schools were lower than 1 (0.54–0.93), indicating that outdoor emissions 35
significantly contributed to UFP indoors. Significant correlations were obtained 36
between temperature, wind speed, relative humidity, solar radiation and ambient UFP 37
number concentrations. The estimated exposure doses were higher in children attending 38
urban pre-schools; 3-5 years old children were exposed to 4-6 times higher UFP doses 39
than adults with similar daily schedules. 40
Keywords (6): ultrafine particles; pre-schools; indoor/outdoor air; children, exposure 41 dose; 42 2 3 4 5 6 7 8 9 10 11 12 13 14 15 16 17 18 19 20 21 22 23 24 25 26 27 28 29 30 31 32 33 34 35 36 37 38 39 40 41 42 43 44 45 46 47 48 49 50 51 52 53 54 55 56 57
Introduction 43
Up to this date various studies have reported the health risks caused by exposure to 44
particulate matter (Brunekreef et al., 2009; Cassee et al., 2013). In the last years the 45
scientific attention focused on ultrafine particles (UFP), i.e. particles with aerodynamic 46
diameter smaller than 0.1 µm, because evidence indicates that UFP may have a greater 47
potency to cause adverse health effects than large particles (Kumar et al., 2013, 2014; 48
Diapouli et al., 2007). UFP contribute very little to overall particle mass, but they 49
dominate the number concentrations (Morawska et al., 2008). When compared to larger 50
particles, UFP have higher particle number concentration, surface area and larger 51
concentrations of adsorbed (or condensed) toxic pollutants per unit mass (Sioutas et al., 52
2005). Due to their smaller sizes, UFP can penetrate cell membranes and deposit in the 53
brain tissues and secondary organs (Donaldson et al., 2001; Semmler et al., 2004; 54
Unfried et al., 2007). Combined effects of UFP high surface area and potentially toxic 55
composition may promote physical and chemical reactions inside the organisms that can 56
further result in adverse health outcomes (Kumar et al., 2011; Stone et al., 2007). 57
Studies have shown that exposures to UFP are associated to impaired lung function and 58
pulmonary defense mechanisms, inflammatory responses, asthma, worsening of 59
respiratory diseases and allergic conditions, cardiovascular problems, and even with 60
carcinogenic and genotoxic consequences (Ferreira et al., 2013; Stanek et al., 2011, 61
Terzano et al., 2010). 62
UFPs are emitted to atmosphere by combustion processes (associated mostly 63
with emission from traffic or industrial sources; Kumar at al., 2010), formed by 64
nucleation and condensation of hot supersaturated vapours while being cooled to 65
ambient temperatures (Sioutas et al., 2005), and by chemical reactions in the 66
atmosphere (Morawska et al., 2008). In addition, indoor UFP may be emitted from 67 2 3 4 5 6 7 8 9 10 11 12 13 14 15 16 17 18 19 20 21 22 23 24 25 26 27 28 29 30 31 32 33 34 35 36 37 38 39 40 41 42 43 44 45 46 47 48 49 50 51 52 53 54 55 56 57
indoor combustions (cooking, smoking, candle use) and or result from occupant-related 68
activities (consumer products, paining, cleaning) (Long et al., 2000; Morawska et al., 69
2003; Wallace, 2006; Bhangar et al., 2011). 70
The complexity of UFP exposure (spatial variability, indoor sources, infiltration 71
of UPF from various outdoor emission sources, seasonal variability in concentrations 72
and composition; Sioutas et al., 2005) indicates the need to further study this pollutant 73
in order to fully comprehend its impacts on human health. This is especially relevant for 74
sensitive groups. Young children in particular are very susceptible to air pollution 75
(Schwartz, 2004) because they receive a higher dose of airborne particles relative to 76
lung size compared with adults while at the same time their physiological and 77
immunological systems are still developing (Burtscher and Schüepp, 2012; Morawska 78
et al., 2013). In Portugal young children spend approximately 30% of their time (7-8 h 79
per day) at pre-schools, which raises interest in understanding of air pollution in these 80
environments. Nevertheless, as the importance of UFP has been recognized recently, 81
there have been only few studies on UFP levels in schools (Buonanno et al., 2012, 82
2013a; Clausen et al., 2012; Diapouli et al., 2008; Fromme et al., 2007; Guo et al., 83
2010; Kim et al., 2011; Morawska et al., 2009; Mullen et al., 2011; Norbäck et al., 84
2011; Rumchev et al., 2007; Weichenthal et al., 2008; Zhang and Zhu, 2012) and only 85
some of these studies investigated the correlation with outdoor traffic or indoor 86
processes; as far it is known no study was published on UFP levels in Portuguese 87
schools. In addition, during the school time children move between different 88
microenvironments (classroom, gyms, outdoor playgrounds, and etc.) where levels of 89
UFP may vary greatly (Zhang and Zhu, 2012). Therefore, quantification of UFP in these 90
specific microenvironments is essential in order to correctly assess child overall school 91 exposure to UFP. 92 2 3 4 5 6 7 8 9 10 11 12 13 14 15 16 17 18 19 20 21 22 23 24 25 26 27 28 29 30 31 32 33 34 35 36 37 38 39 40 41 42 43 44 45 46 47 48 49 50 51 52 53 54 55 56 57
The aim of this work was to study UFP levels in urban and rural pre-schools in 93
the north of Portugal. The specific objectives of this work were: (i) to quantify UFP 94
number concentrations in different microenvironments of urban and rural pre-schools, 95
and to compare the attained results with other international studies; (ii) to assess the 96
impacts of outdoor UFP to indoor air quality in pre-schools; and (iii) to estimate 97
exposure doses of UFP for 3-5 years old children (in comparison to adults). 98
99
Materials and Methods 100
Characterization of sampling sites 101
UFP were consecutively measured at three pre-schools in Portugal for 31 days (May-102
June) of 2013. Pre-schools are educational establishments that provide education for 3-5 103
old children, prior to the beginning of compulsory attendance at primary schools. 104
Specifically in Portugal “pre-schools” referred to institutions that are directly operated 105
by primary schools. In this work the pre-schools were selected in order to represent 106
different environments. Two pre-schools (US1 and US2) were situated in Oporto 107
Metropolitan Area in Paranhos district (north of Portugal); previously it was 108
demonstrated that vehicular traffic emissions are the main pollution source in this area 109
(Slezakova et al., 2011, 2013). The third pre-school RU1 was located in Xisto also in 110
the north of Portugal but in a rural zone. The detailed characteristic of all three pre-111
schools are presented in Table 1. 112
In all three pre-schools, UFP were simultaneously measured at different micro-113
environments, namely in classrooms (2-3) situated on ground and first floor, and in 114
canteen (1). UFP were also measured in gymnasium or playroom, if existent (Table 1). 115
The characteristics of each studied micro-environment (volume, area, occupancy 116
patterns, number of individuals) as well construction properties (construction materials, 117 2 3 4 5 6 7 8 9 10 11 12 13 14 15 16 17 18 19 20 21 22 23 24 25 26 27 28 29 30 31 32 33 34 35 36 37 38 39 40 41 42 43 44 45 46 47 48 49 50 51 52 53 54 55 56 57
ventilation mechanisms, and temperature and relative humidity) are summarized in 118
Tables 1S-3S of the Supplementary material. 119
In order to better understand the impacts of outdoor UFP emissions to indoor 120
pre-school environments, the levels of UFP were concurrently measured in ambient air 121
(i.e. outdoor). 122
The traffic densities were estimated for each pre-school (Table 1). During two 123
consecutive days (avoiding Mondays and Fridays) the number of road vehicles was 124
manually counted between 5 a. m. to 12 p. m. during 10 minutes of each hour. These 125
data were used in order to better describe the surroundings of selected pre-schools. 126
127
Sample collection 128
UFP number concentrations in size range 0.02-1 µm were measured by condensation 129
particle counters – TSI P-Trak™ (UPC 8525; TSI Inc., MN, USA). The instrument 130
operates on the principle of condensing 100% grade isopropyl alcohol (Sigma-Aldrich, 131
Steinheim, Germany) onto ultrafine particles in order to increase their dimensions to the 132
size that can be detected. UFP were measured daily between 8:30 a.m. to 5:30 p.m. 133
which corresponded to the period that children were at pre-schools. Intake flow of 0.7 134
L.min-1 was used and UFP logging interval was 60 s accordingly to previous studies 135
(Diapouli et al., 2007; Norbäck et al., 2011; Zhang and Zhu, 2012). Instruments were 136
mounted onto supports so that air was sampled from a height of 0.8 to 1.1 m (in order to 137
simulate children breathing zone). In each micro-environment, the particles counters 138
were placed as far as possible from windows or doors, and from other probable sources 139
of UFP (heating equipment, blackboards, printers, etc.) in order to minimize direct 140
influence of any source; in canteens the equipment was always positioned in the eating 141
area, as far as possible from the serving area and kitchen where cooking was done. Over 142 2 3 4 5 6 7 8 9 10 11 12 13 14 15 16 17 18 19 20 21 22 23 24 25 26 27 28 29 30 31 32 33 34 35 36 37 38 39 40 41 42 43 44 45 46 47 48 49 50 51 52 53 54 55 56 57
the sampling period, the cooking process included boiling, frying and baking; each meal 143
consisted of soup, main dish and desert (typically fruit). All requirements to maintain 144
child safety were fulfilled. During sample collection a researcher was present in order to 145
keep a record of classroom occupancy, ventilation systems (door and window 146
positions), and potential source activities. In addition, teachers and staff were daily 147
inquired regarding the occurrence of additional UFP sources and activities. 148
The UFP in ambient air were measured at pre-school yards in a safe distance 149
from areas with children intense activity. The samplers were always positioned in open 150
area avoiding any obstacles and barriers (trees, bushes walls, and fences) that could 151
interfere with data collection. The equipment were mounted on support (sampling inlets 152
height at 1.2 m above the ground) and protected from rain. The distance from the main 153
street was 8–42 m. 154
Indoor temperature and relative humidity were measured by using Testo mini 155
data-logger (174H, Testo; Germany) which operated continuously with a logging 156
interval of 10 min. Information on outdoor meteorological conditions, namely 157
temperature (T), relative humidity (RH), wind speed (WS), and precipitation (P) were 158
retrieved from the local meteorological stations and are summarized in Table 1. 159
160
Dose rate exposure analysis 161
UFP dose rates from inhalation exposure were calculated using Equation 1 (Kalaiarasan 162
et al. 2009, Castro et al., 2009): 163
Dose rate (D) = (BRWA/BW) ×CWA × OF × N (1) 164
where D is the age-specific dose rate (particle number kg-1); BRWA is the age-specific 165
weighted average breathing rate (L min-1); BW is age-specific body weight (kg); CWA is 166
the age-specific weighted average concentration (particles L-1); OF is the occupancy 167 2 3 4 5 6 7 8 9 10 11 12 13 14 15 16 17 18 19 20 21 22 23 24 25 26 27 28 29 30 31 32 33 34 35 36 37 38 39 40 41 42 43 44 45 46 47 48 49 50 51 52 53 54 55 56 57
Supplementary material. As the information concerning the Portuguese population is not available, the age-specific factors were retrieved from U.S. EPA data (U.S. EPA, 2011) considering the mixed population (both male and females). BW of 18.6 kg for 3-5 years old children was used. The BR were selected as the followings: 4.3 L.min-1 for rest or sleep; 4.5 L min-1 for sedentary or passive activities; 11.0 L min-1 for light intense activity, and 37.0 L min-1 for highly intense activities (running, etc.). BRWA was estimated then as weighted average, i.e. considering the intensity of performed activities in each microenvironment and the amount of time spent there. The exposure doses were estimated using the UFP average concentrations (weighted by the real time that children spent in each microenvironment). Table 5S of the Supplementary material shows examples of UFP exposure doses calculation. For comparison, dose rates of inhalation exposure to UFP were also estimated for the teachers and pre-school staff (aged 25-64 years). Time schedules of teachers and pre-school staff (i.e. period spent in each micro-environment) were considered the same as of children. Age specific parameters BRWA (12 L min-1; i.e. light physical activity) and BW (77 kg) were used (U.S. EPA, 2011).
PROOF
factor (considered 1, as children kept their schedules and associated locations tightly); N 168
is the total time per day spent by age-specific children in the pre-school (min day-1). 169
UFP dose rates were estimated for 3-5 years old children that were the common age 170
group in all three pre-schools (Table 1). The daily activity patterns of children were 171
analyzed during each day. Locations in which the different activities happened during 172
the day were identified. Total daily residence time of children spent in each micro-173
environment and the types of performed activities were registered. Each activity was 174
characterized in terms of intensity level in order to assess the corresponding BR. An 175
example of children timetable and activity patterns is shown in Table 4S of the 176 177 178 179 180 181 182 183 184 185 186 187 188 189 190 191 192 2 3 4 5 6 7 8 9 10 11 12 13 14 15 16 17 18 19 20 21 22 23 24 25 26 27 28 29 30 31 32 33 34 35 36 37 38 39 40 41 42 43 44 45 46 47 48 49 50 51 52 53 54 55 56 57
Statistical methods 193
t Student’s test was applied (p < 0.05; two tailed) in order to establish the statistical 194
significance of the existing differences between the calculated averages. In order to 195
assess the impact of outdoor UFP on indoor environments, the associations between 196
indoor and outdoor UFP number concentrations were estimated by a bivariate linear 197
regression, assuming a linear relationship. Spearman’s rank correlation coefficient (rs) 198
(p < 0.05) was also calculated to assess the influence of meteorological parameters on 199
UFP number concentrations. 200
201
Results and discussion 202
UFP number levels 203
The UFP number concentrations measured in various micro-environments of the three 204
pre-schools are presented in Table 2, which shows the mean and ranges obtained for 205
each micro-environment, as well as, the total UFP concentrations. 206
At all three pre-schools, canteens were the micro-environment with the highest 207
levels of UFP particle number concentrations. Examples of representative daily profiles 208
of UFP concentrations in canteens are shown in Figure 1S of the Supplementary 209
material. During the morning UFP concentrations were increasing. When meals were 210
served, typically between 11:30 and 14:00 (i.e. the highest room occupancy), UFP 211
reached the maximal levels. After that, cooking activities stopped, children and staff left 212
the eating area (canteens were vacant for the rest of day), and consequently UFP levels 213
continuously decreased. In all three pre-schools the canteens were directly connected 214
through serving areas (i.e. open spaces) to kitchens equipped with gas fueled stoves. 215
Therefore, cooking emissions could easily penetrate to the eating area and seem to 216
represent the main emission source of UFP in these micro-environments (Buonanno et 217 2 3 4 5 6 7 8 9 10 11 12 13 14 15 16 17 18 19 20 21 22 23 24 25 26 27 28 29 30 31 32 33 34 35 36 37 38 39 40 41 42 43 44 45 46 47 48 49 50 51 52 53 54 55 56 57
al., 2013b). The highest levels of UFP were found at canteen of US1 (1.6 and 1.3 times 218
higher than at US2 and RS1, respectively), which was the one with the highest number 219
of enrolled students (Table 1). Similarly, lowest UFP levels were observed at US2 (pre-220
school with the smallest number of enrolled students). 221
In all three pre-schools, classrooms were the micro-environment with lower UFP 222
number concentrations. This finding is somewhat reassuring, given that it is the micro-223
environment where children spend most of their school time. Out of the three pre-224
schools, classrooms at RS1 exhibited the lowest levels of UFP which might be due to 225
the lack of urbanization and/or anthropogenic sources of this site. At US1 and US2 the 226
concentrations of UFP in classrooms were, approximately 30 and 60% higher, 227
respectively than at RS1; the differences between the means of UFP in classrooms of 228
rural and urban pre-schools were statistically significant (p < 0.05). Specifically, the 229
highest mean of UFP was found at classrooms of US2, probably due to the room 230
organizations, sizes and characteristics; classrooms at US2 were the smallest and most 231
cluttered (Table 2S). Furthermore, within each pre-school, the levels of UFP were 232
significantly different in classrooms on 0 and 1 floor (p < 0.05). In addition, it is 233
necessary to point out that temporarily (3 up to 120 minutes) UFP concentrations 234
reached high levels in classrooms of all three pre-schools. These increases were 235
associated with specific indoor sources registered in the classrooms of the three pre-236
schools which included children activities during classes (i.e. painting, sculpturing, and 237
other arts and crafts activities), combustion sources (candles on birthday cake), and 238
classroom cleaning (dusting and wood polishing) (Morawska et al., 2009). Ventilation 239
by open windows and consequent penetration of UFP from outdoors was also identified 240
as an important source of UFP indoors. This specific source was identified based on the 241
comparisons of the daily activity observations (a research and/or teacher registered open 242 2 3 4 5 6 7 8 9 10 11 12 13 14 15 16 17 18 19 20 21 22 23 24 25 26 27 28 29 30 31 32 33 34 35 36 37 38 39 40 41 42 43 44 45 46 47 48 49 50 51 52 53 54 55 56 57
windows) and temporarily increases of UFP. The highest maximal levels of UFP were 243
measured at US1 (up to 13 times higher than estimated mean) during candle burning on 244
birthday cake (Figure 2S of the Supplementary material) and during activity that 245
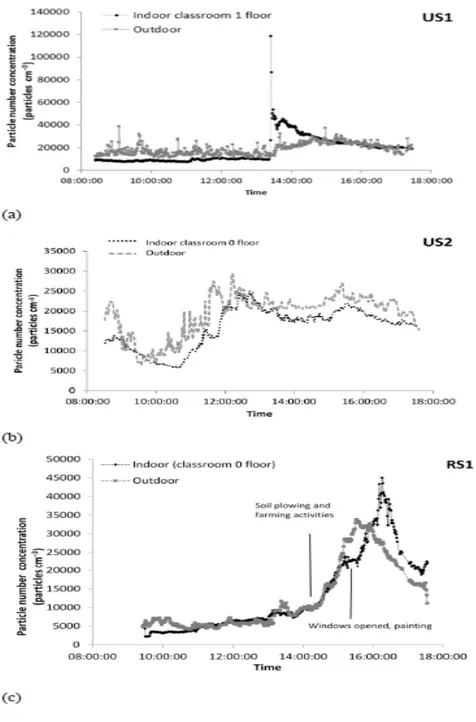
included clay grinding (Figure 1a). 246
Gymnasium and playroom exist only at one pre-school (US2 and US1, 247
respectively). The levels of UFP in gymnasium were similar to those at classrooms of 248
the respective pre-school. Playroom exhibited approximately twice higher levels of UFP 249
number concentrations than the classrooms. This room was used for multiple purposes: 250
waiting area to drop off and pick up of children (before, during and after school hours), 251
for extra-curricular activities, to eat snacks, or even as classroom or gymnasium for 3-5 252
years old children. Consequently, levels of UFP varied greatly and concentration 253
profiles exhibited considerable variances every day. Among the identified sources were: 254
children physical activities (dancing, exercising), painting, cleaning and use of chemical 255
products, and ventilations (opened windows and doors). 256
Total mean UFP concentrations were determined using all measured data for 257
each school despite the inexistence of some micro-environments in some pre-258
schools (gymnasium, playroom), association with highly specific indoor sources 259
(canteen), and small occupancy times. The highest total mean levels of UFP were found 260
at US1 being 1.4 and 1.6 higher than at US2 and RS1, respectively; the results showed 261
that the total means of UFP at urban pre-schools were statistically different (p < 0.05) 262
than at rural one. Nevertheless, these findings need to be interpreted with care once UFP 263
were measured at three pre-schools consequently. The comparisons of UFP particles 264
with other studies are shown in Table 3. The total levels of UFP in the three 265
characterized Portuguese pre-schools were similar to those of Southern Europe, namely 266
Italy (Buonanno et al., 2012, 2013), Greece (Diapouli et al., 2008), Australia (Rumchev 267 2 3 4 5 6 7 8 9 10 11 12 13 14 15 16 17 18 19 20 21 22 23 24 25 26 27 28 29 30 31 32 33 34 35 36 37 38 39 40 41 42 43 44 45 46 47 48 49 50 51 52 53 54 55 56 57
et al., 2007) and South Korea (Kim et al., 2011). Other studies from Europe (Germany, 268
Sweden, France), North America (USA and Canada), and Australia reported levels of 269
UFP in pre-schools 3-17 times lower than in the present work. Seasonal influences, 270
meteorological conditions, level of urbanization and overall development of area where 271
the pre-schools were located could account for some of these differences (Morawska et 272
al., 2009; WHO 2006). Other study design (sampling period, duration, number of pre-273
schools) could also contribute to the obtained differences (Morawska et al., 2013). In 274
addition, differences in the measured particle range, especially in terms of lower cut off 275
size could also account for some of the existent results (Kumar et al., 2010). Finally, 276
with exception to the study by Zhang and Zhu (2012) and Diapouli et al. (2007, 2008) 277
all other works assessed UFP only in classrooms. The total concentrations in the present 278
study also considered various other micro-environments of pre-schools. In that regard, 279
canteens were especially relevant indoor places (Table 2). The levels of UFP in canteens 280
were 3-6 times higher than in classrooms which consequently contributed to higher 281
overall average in the studied schools; absence of these special micro-environments in 282
other studies could also justify the differences between UFP levels. 283
284
Indoor/ outdoor UFP 285
The statistical parameters of average UFP number concentrations outdoors (i.e. pre-286
school yard) and indoors (in classrooms) at three pre-schools are presented in Figure 2. 287
Examples of UFP concentration profiles in ambient air and in the classrooms of three 288
pre-schools are shown at Figure 1a–c. At the urban pre-schools the mean of UFP 289
concentrations in outdoor air was 1.72×10⁴ and 1.21×10⁴ particles cm-3 at US1 and 290
US2, respectively. The statistical analysis of these results indicated that they are 291
significantly different (p < 0.05). The previously conducted study has shown that 292 2 3 4 5 6 7 8 9 10 11 12 13 14 15 16 17 18 19 20 21 22 23 24 25 26 27 28 29 30 31 32 33 34 35 36 37 38 39 40 41 42 43 44 45 46 47 48 49 50 51 52 53 54 55 56 57
PROOF
emissions from vehicular traffic are the main pollution source to ambient air in this area 293
(Slezakova et al., 2013) and the higher traffic density nearby US1 (Table 1) may 294
account for some of the observed differences. At pre-school situated in rural area, mean 295
concentration UFP in ambient air (1.02×10⁴ particles cm-3) was significantly lower (p < 296
0.05) in comparisons with urban ones, probably due to much lower traffic density and 297
lower influence of anthropogenic sources (Table 1); the mean of UFP was at RS1 70 298
and 20% lower than at US1 and US2, respectively. Natural sources of UFP, namely 299
atmospheric formations and emissions from vegetation (plantations, forests) (Diapouli 300
et al., 2007; Morawska et al., 2008) that surrounded the vicinity of rural pre-school 301
might account for these levels. It is necessary to repeat that UFP at three schools were 302
sampled during different dates, which could also account for some of the observed 303
differences. Furthermore, during the UFP sampling at RS1 soil plowing and other 304
farming activities were registered during three days at several plantations which might 305
contribute to observed levels of UFP in ambient air (Figure 1c). In addition, the results 306
in Figure 2 show that overall levels of UFP in the classrooms of RS1 were lower than in 307
ambient air; this pattern was also observed in the urban pre-schools. On the contrary, 308
maximal levels of UFP outdoors were lower than indoors ones. These occurrences were 309
due to the presence of specific indoor sources (combustion, indoor activities) in the 310
classrooms of three pre-schools that caused during relatively short periods of time high 311
levels of UFP, especially high maxima of UFP were observed at US1. 312
In order to further evaluate the influence of outdoor emissions to indoor air 313
quality, I/O ratios between the concentrations of UFP in classrooms and in outdoor air 314
were calculated. At US1 the values of I/O ratios ranged between 0.13 and 9.77 (mean of 315
0.54) whereas it was between 0.31 and 4.72 at US2 (mean of 0.93); the respective ratio 316
range was between 0.35 and 2.59 at RS1 (mean of 0.70). Overall, the mean I/O ratios 317 2 3 4 5 6 7 8 9 10 11 12 13 14 15 16 17 18 19 20 21 22 23 24 25 26 27 28 29 30 31 32 33 34 35 36 37 38 39 40 41 42 43 44 45 46 47 48 49 50 51 52 53 54 55 56 57
regression, assuming a linear relationship (Figure 3a-c). It is possible to observe that at US2 and RS1 (Figure 3 b-c) indoor and outdoor UFP were relatively well associated (with R2 of 0.82 and 0.58, respectively) which further supports the previous findings concerning the impacts of outdoor air. At US1 (Figure 3a) the linear regression between the indoor and outdoor UFP concentrations was poorer (R2 of 0.14) due to the much high variance of indoor UFP levels (temporal contribution from specific indoor sources).
Influence of meteorological parameters
The potential influence of indoor (T, RH) and ambient parameters (T, SR, RH, and WS) on indoor and outdoor UFP number concentrations were analyzed through the calculation of Spearman’s correlation coefficient (Table 4). For the analysis of indoor UFP, classrooms were the only considered indoor micro-environment (due to their existence in all three pre-schools); canteens were not considered in order to avoid the specificity of cooking emissions. Positive correlations were found between T and UFP number concentrations both indoors and outdoors. In addition, SR was positively correlated with outdoor UFP number concentrations so the positive correlation between UFP, SR and outdoor T might be due to photochemical activity, leading to an increase
PROOF
were similar to those previously reported (Buonanno et al, 2013a; Weichenthal et al., 318
2008). At all three pre-schools, the mean values of I/O ratios were lower than 1 which 319
indicates that outdoor emissions may influenced UFP levels in classrooms. It is 320
necessary to point out that high values of maximal I/O ratios (9.77 for US1, 4.72 for 321
US2 and 2.59 for RS1) probably indicate contribution of UFP from indoor sources with 322
RS1 being the least influenced by those sources. 323
The influence of air quality to indoors was also analyzed by bivariate linear 324 325 326 327 328 329 330 331 332 333 334 335 336 337 338 339 340 341 342 2 3 4 5 6 7 8 9 10 11 12 13 14 15 16 17 18 19 20 21 22 23 24 25 26 27 28 29 30 31 32 33 34 35 36 37 38 39 40 41 42 43 44 45 46 47 48 49 50 51 52 53 54 55 56 57
in the concentration of UFP (Park et al., 2008). Evaluating different fractions of 343
ultrafine particles, Wang et al. (2010) reported that nucleation mode particles (4–10 nm, 344
10–30 nm in diameter) are more affected by SR and T, whereas Aitken mode fractions 345
(30–50 nm and 50–70 nm) corresponded closely to RH. The results of this study are 346
somewhat inconclusive concerning RH. Whereas outdoor UFP and RH were inversely 347
correlated at all three pre-schools, the correlation coefficients for indoors were only 348
significant for US2. Finally, WS showed significant inverse correlations with outdoor 349
UFP as reported also by Wang et al. (2011). In agreement with these findings, 350
Weichenthal et al. (2008) also reported inverse correlations of WS and UFP number 351
concentration. High WS might influence the observed UFP number concentration 352
profiles during the sampling, promoting a higher instantaneous variability and 353
oscillation of UFP number concentrations. It is necessary to point out that although the 354
obtained results appear to be consistent with the finding of previous studies, the 355
observed associations between the meteorological parameters and UFP may be 356
influenced by unmeasured confounding factors between these parameters. 357
358
Exposure dose analysis 359
The inhalation exposure dose rates of UFP were estimated for 3-5 years old children 360
that were the common age group at all three schools (Table 5). At both urban pre-361
schools, 3-5 years old children were divided into the classes according to their age 362
(though differently at both pre-schools). These age-classes had different daily schedules 363
and activities. For example the youngest rested (i.e. napped) after lunch for 2-2.5 hours 364
whereas older children spent daily more times outdoors (0.75-1.75 h). The organization 365
structure of the rural pre-school was simpler and all children between 3-5 years were 366
joined to the same class and they all had the same daily schedule and/or activity 367 2 3 4 5 6 7 8 9 10 11 12 13 14 15 16 17 18 19 20 21 22 23 24 25 26 27 28 29 30 31 32 33 34 35 36 37 38 39 40 41 42 43 44 45 46 47 48 49 50 51 52 53 54 55 56 57
patterns. The highest exposure doses of UFP were found for children of US1. At both 368
urban pre-schools, classrooms were the micro-environment where children spend 369
majority of their school time (approximately 70-75% for young ones and 57%-70% for 370
older ones). As previously shown (Table 2) overall levels of UFP in classrooms were 371
the highest at US2. Still, for all age categories the exposure doses of UFP were at US1 372
1.5 times higher than at US2, mostly due to the exposure to higher levels of UFP in 373
canteen of US1. Although children spend in canteens rather limited period of school 374
time (18 and 19% of their school time at US1 and US2, respectively) the contribution to 375
the total exposure of UFP is relevant. In addition, these findings clearly show that when 376
assessing children exposure to UFP in pre-schools, all potential micro-environments 377
should be considered. 378
The total estimated dose rates between the different age-groups at the two urban 379
pre-schools were also compared. The results in Table 5 clearly show that at both urban 380
schools exposure doses of UFP were approximately 1.5 times for older children (namely 381
5 years old at US1 and 4-5 years old at US2) than for younger ones (3-4 years and 3 382
years at US1 and US2, respectively). At each urban pre-school older children spent 383
approximately twice more outdoors (25 and 7% of their school time at US1 and US2, 384
respectively) than young ones (11% at US1 and 4% at US2). Older children also 385
performed more frequently physical activities such as exercising, running, and playing 386
(both indoors and outdoors) which were associated with the highest breathing rates and 387
consequently led to higher inhalation doses of UFP. In agreement with these findings, 388
the dose rates due to outdoor exposure contributed for older children 48 and 27% of the 389
total UFP school dose at US1 and US2 respectively, whereas for younger ones it was 390
33% at US1 and 19% at US2. In addition, UFP dose rates due to outdoor exposure were 391
higher at US1 where children spent more time outdoors. On the contrary young children 392 2 3 4 5 6 7 8 9 10 11 12 13 14 15 16 17 18 19 20 21 22 23 24 25 26 27 28 29 30 31 32 33 34 35 36 37 38 39 40 41 42 43 44 45 46 47 48 49 50 51 52 53 54 55 56 57
spend more time indoors where overall UFP levels were lower that outdoors which 393
might cause the lower total dose rates of UFP (Table 5). In addition, at both pre-schools 394
the younger children napped (in the classrooms) after the lunch which was an activity 395
with the lowest breathing rates. 396
The estimated total dose rates of UFP at RS1 were similar to those of US1 (3-4 397
years old) and US2 (4-5 years old). These exposure doses were higher than expected (in 398
a view of lower indoor UFP concentrations at this pre-school; Table 2) probably due to 399
the considerably longer period spent outdoors. At rural pre-school children spent 400
approximately 40% of their school times outdoors and the UFP dose rates due outdoor 401
exposure accounted for 60% of the total school exposure, thus being at RS1 the highest 402
proportion of all three pre-schools. These findings show that daily activity patterns at 403
the respective schools influenced significantly the overall child exposure dose rates to 404
UFP. 405
Finally, in order to better understand the magnitude of UFP exposures at the 406
three characterized pre-schools, the dose rates of children were compared to those of 407
adults. The results in Table 5 show that exposure doses for 3-5 years old children in the 408
respective pre-schools were 3.6 to 6.4 times higher than those of adults. Considering the 409
high susceptibility of young children, these results demonstrate that pre-schools are an 410
important environment for child overall particles exposure. Finally, the information on 411
the exposure to UFP in children is limited and therefore the findings on UFP dose rates 412
of 3-5 years old children obtained within this work could not be compared with other 413 studies. 414 415 Conclusions 416 2 3 4 5 6 7 8 9 10 11 12 13 14 15 16 17 18 19 20 21 22 23 24 25 26 27 28 29 30 31 32 33 34 35 36 37 38 39 40 41 42 43 44 45 46 47 48 49 50 51 52 53 54 55 56 57
This study fills a gap providing information on the UFP levels and exposure 417
doses in Portuguese pre-schools. The results demonstrated that levels of UFP in various 418
microenvironments of pre-schools differed significantly with the lowest levels of UFP 419
observed in the classrooms (where children spend 70-75% of their school time) and the 420
highest ones found in canteens. Therefore, future population-based studies focusing on 421
the health effects of airborne pollutants need to account for the exposures occurring in 422
these different microenvironments in order to obtain a representation of child’s overall 423
pre-school exposure profiles. Furthermore, the results of the present study suggested 424
that children attending urban pre-schools are potentially exposed to higher 425
concentrations of UFP in air, mainly due to the contribution of outdoor traffic-related 426
sources and extra cooking activities (usually due to higher number of enrolled students). 427
Nevertheless, the daily activity patterns at the respective schools influenced 428
significantly the overall child exposure dose rates to UFP. 429
Children represent one of the most vulnerable groups in society. However, in 430
comparison to adults, the exposure doses for 3-5 years old children in the respective 431
pre-schools were 4 to 6 times higher than those of adult. Therefore, in order to provide 432
information for the protection of public health, the future work should focus on the 433
individual exposure of children. 434
435
Acknowledgments 436
This work was supported by Fundação para Ciência e Tecnologia through 437
fellowship SFRH/BPD/65722/2009 and by the IJUP project PP_IJUP2011 121. It also 438
received financial support from the European Union (FEDER funds through 439
COMPETE) and National Funds (Fundação para a Ciência e Tecnologia) through 440 project Pest-C/EQB/LA0006/2013. 441 2 3 4 5 6 7 8 9 10 11 12 13 14 15 16 17 18 19 20 21 22 23 24 25 26 27 28 29 30 31 32 33 34 35 36 37 38 39 40 41 42 43 44 45 46 47 48 49 50 51 52 53 54 55 56 57
References 442
Bhangar, S., Mullen, N.A., Hering, S.V., Kreisberg, N.M. and Nazaroff, W.W. (2011) 443
Ultrafine particle concentrations and exposures in seven residences in northern 444
California, Indoor Air, 21(2) , 132-144. 445
Brunekreef, B., Beelen, R., Hoek, G., Schouten, L., Bausch-Goldbohm, S., Fischer, P., 446
Armstrong, B., Hughes, E., Jerrett, M. and van den Brandt, P. (2009) Effects of long-447
term exposure to traffic-related air pollution on respiratory and cardiovascular mortality 448
in the Netherlands: the NLCS-AIR study, Res Rep Health Eff Inst., 139:5-71; discussion 449
73-89. 450
Buonanno, G., Fuoco, F.C., Morawska, L. and Stabile L. (2013a) Airborne particle 451
concentrations at schools measured at different spatial scales, Atmos. Environ., 67, 38-452
45. 453
Buonanno, G., Marini, S., Morawska, L and Fuoco, F.C. (2012) Individual dose and 454
exposure of Italian children to ultrafine particles, Sci. Total Environ., 438, 271-277. 455
Buonanno, G., Stabile, L., Morawska, L. and Russi, A. (2013b) Children exposure 456
assessment to ultrafine particles and black carbon: The role of transport and cooking 457
activities, Atmos. Environ., 79, 53-58. 458
Burtscher, H. and Schüepp, K. (2012) The occurrence of ultrafine particles in the 459
specific environment of children, Paediatr. Respir. Rev., 13(2), 89-94. 460
Cassee, F.R., Héroux, M.-E., Gerlofs-Nijland, M.E. and Kelly, F.J. (2013) Particulate 461
matter beyond mass: Recent health evidence on the role of fractions, chemical 462
constituents and sources of emission, Inhal. Toxicol., 25(14), 802-812. 463
Castro, D., Slezakova, K., Delerue-Matos, C., Alvim-Ferraz, M.D.C., Morais, S. and 464
Pereira, M.D.C. (2009) Polycyclic aromatic hydrocarbons in gas and particulate phases 465 2 3 4 5 6 7 8 9 10 11 12 13 14 15 16 17 18 19 20 21 22 23 24 25 26 27 28 29 30 31 32 33 34 35 36 37 38 39 40 41 42 43 44 45 46 47 48 49 50 51 52 53 54 55 56 57
of indoor environments influenced by tobacco smoke: Levels, phase distributions, and 466
health risks, Atmos. Environ., 45 (10), 1799-1808. 467
Clausen, G., Høst, A., Toftum, J., Bekö, G., Weschler, C., Callesen, M., Buhl, S., 468
Ladegaard, M.B., Langer, S., Andersen, B., Sundell, J., Bornehag, C.G. and Sigsgaard, 469
T. (2012) Children's health and its association with indoor environments in Danish 470
homes and daycare centres – methods, Indoor Air, 22(6), 467-475. 471
Diapouli, E., Chaloulakou, A., Mihalopoulos, N. and Spyrellis, N. (2008) Indoor and 472
outdoor PM mass and number concentrations at schools in the Athens area, Environ. 473
Monit. Assess., 136(1-3), 13-20.
474
Diapouli, E., Chaloulakou, A., Spyrellis, N. (2007) Levels of ultrafine particles in 475
different microenvironments--implications to children exposure, Sci. Total Environ., 476
388(1-3), 128-136. 477
Donaldson. K., Stone, V., Clouter, A., Renwick, L. and MacNee W. (2001) Ultrafine 478
particles, Occup. Environ. Med., 58 (3), 211–216. 479
Ferreira, A. J., Cemlyn-Jones, J. and Robalo Cordeiro, C. (2013) Nanoparticles, 480
nanotechnology and pulmonary nanotoxicology, Rev Port. Pnemol., 19(1): 28-37. 481
Fromme, H., Twardella, D., Dietrich, S., Heitmann, D., Schierl, R., Liebl, B. and 482
Rüden, H. (2007) Particulate matter in the indoor air of classrooms-exploratory results 483
from Munich and surrounding area, Atmos. Environ., 41 (4) , 854-866. 484
Guo, H., Morawska, L., He, C., Zhang, Y.L., Ayoko, G. and Cao, M (2010) 485
Characterization of particle number concentrations and PM2.5 in a school: Influence of 486
outdoor air pollution on indoor air, Environ. Sci. Pollut. Res., 17, 1268–1278. 487
Kalaiarasan, M. R., Balasubramanian, K. W. D. Cheong and Tham, K. W. (2009) 488
Traffic-generated airborne particles in naturally ventilated multi-storey residential 489 2 3 4 5 6 7 8 9 10 11 12 13 14 15 16 17 18 19 20 21 22 23 24 25 26 27 28 29 30 31 32 33 34 35 36 37 38 39 40 41 42 43 44 45 46 47 48 49 50 51 52 53 54 55 56 57
buildings of Singapore: Vertical distribution and potential health risks, Build. Environ., 490
44(7), 1493-1500. 491
Kim, J.-L., Elfman, L., Wieslander, G., Ferm, M., Torén, K. and Norbäck, D. (2011) 492
Respiratory health among Korean pupils in relation to home, school and outdoor 493
environment, Journal of Korean Medical Science, 26 (2), 166-173 494
Kumar, P., Morawska, L., Birmili, W., Paasonen, P., Hu, M., Kulmala, M., Harrison, 495
R.M., Norford, L. and Britter, R. (2014) Ultrafine particles in cities, Environ. Int., 66, 1-496
10. 497
Kumar, P., Robins, A., Vardoulakis, S. and Britter, R. (2010) A review of the 498
characteristics of nanoparticles in the urban atmosphere and the prospects for 499
developing regulatory controls, Atmos. Environ., 44 (39), 5035-5052. 500
Kumar, P., Robins, A., Vardoulakis, S. and Quincey, P. (2011) Technical challenges in 501
tackling regulatory concerns for urban atmospheric nanoparticles, Particuology, 9(6): 502
566-571. 503
Kumar, S., Verma, M.K. and Srivastava, A.K. (2013) Ultrafine particles in urban 504
ambient air and their health perspectives, Rev. Environ. Health., 28(2-3), 117-128. 505
Long, C.M., Suh, H.H. and Koutrakis, P. (2000) Characterization of indoor particle 506
sources using continuous mass and size monitors, J. Air Waste Manag. Assoc., 50, 507
1236–1250. 508
Morawska, .L, He, C., Johnson, G., Guo, H., Uhde, E. and Ayoko, G. (2009) Ultrafine 509
particles in indoor air of a school: possible role of secondary organic aerosols, Environ. 510
Sci. Technol., 43(24), 9103-9109.
511
Morawska, L., Afshari, A., Bae, G.N., Buonanno, G., Chao, C.Y.H., Hänninen, O., 512
Hofmann, W., Isaxon, C., Jayaratne, E.R., Pasanen, P., Salthammer, T., Waring M. and 513 2 3 4 5 6 7 8 9 10 11 12 13 14 15 16 17 18 19 20 21 22 23 24 25 26 27 28 29 30 31 32 33 34 35 36 37 38 39 40 41 42 43 44 45 46 47 48 49 50 51 52 53 54 55 56 57
Wierzbicka A. (2013) Indoor aerosols: from personal exposure to risk assessment, 514
Indoor Air, 23(6), 462-487.
515
Morawska, L., He, C.R., Hitchins, J., Mengersen, K. and Gilbert, D. (2003) 516
Characteristics of particle number and mass concentrations in residential houses in 517
Brisbane, Australia, Atmos. Environ., 37, 4195–4203. 518
Morawska, L., Ristovski, Z., Jayaratne, E.R., Keogh, D.U. and Ling, X. (2008) Ambient 519
nano and ultrafine particles from motor vehicle emissions: characteristics, ambient 520
processing and implications on human exposure, Atmos. Environ., 42(35), 8113–8138. 521
Mullen, N.A., Bhangar, S., Hering, S.V., Kreisberg, N.M. and Nazaroff, W.W. (2011) 522
Ultrafine particle concentrations and exposures in six elementary school classrooms in 523
northern California, Indoor Air, 21(1), 77-87. 524
Norbäck, D., Wieslander, G., Zhang, X. and Zhao, Z. (2011) Respiratory symptoms, 525
perceived air quality and physiological signs in elementary school pupils in relation to 526
displacement and mixing ventilation system: an intervention study, Indoor Air, 21(5), 527
427-437. 528
Park, K., Park, J.Y., Kwak, J.-H., Cho, G.N. and Kim, J.-S. (2008) Seasonal and diurnal 529
variations of ultrafine particle concentration in urban Gwangju, Korea: Observation of 530
ultrafine particle events, Atmos. Environ., 42(4), 788–799. 531
Rumchev, K., Ourangui, R., Bertolatti, D. and Spickett, J. (2007) Indoor air quality in 532
old and new schools, WIT Transactions on Biomedicine and Health 11, 25-32. 533
Schwartz, J. (2004) Air pollution and children´ health, Pediatrics, 113, 1037–1043. 534
Semmler, M., Seitz, J., Erbe, F., Mayer, P., Heyder, J., Oberdorster, G. and Kreyling, 535
W.G. (2004) Long-term clearance kinetics of inhaled ultrafine insoluble iridium 536
particles from the rat lung, including transient translocation into secondary organs, 537 Inhal. Toxicol., 16(6-7), 453–459. 538 2 3 4 5 6 7 8 9 10 11 12 13 14 15 16 17 18 19 20 21 22 23 24 25 26 27 28 29 30 31 32 33 34 35 36 37 38 39 40 41 42 43 44 45 46 47 48 49 50 51 52 53 54 55 56 57
Shi, Z., He, K., Yu, Z., Yao X., Yang, F., Ma, Y., Ma, R., Jia, Y. and Zhang, J. (2007) 539
Diurnal variation of number concentration and size distribution of ultrafine particles in 540
the urban atmosphere of Beijing in winter, J. Environ. Sci., 19, 933–938. 541
Sioutas, C., Delfino, R. and Singh, M. (2005) Exposure assessment for atmospheric 542
ultrafine particles (UFPs) and implications in epidemiologic research, Environ. Health 543
Perspect., 113 (89, 947-955.
544
Slezakova, K., Castro, A. Begonha, Delerue-Matos, C., Alvim-Ferraz, M.C.M., Morais, 545
S. and Pereira, M.C. (2011) Air pollution from traffic emissions in Oporto, Portugal: 546
Health and environmental implications, Microchem. J., 99(1), 51-59. 547
Slezakova, K., Pires, J.C.M., Castro, D., Alvim-Ferraz, M.C.M., Delerue-Matos, C., 548
Morais, S. and Pereira, M.C. (2013) PAH air pollution at a Portuguese urban area: 549
Carcinogenic risks and sources identification, Environ. Sci. Pollut. Res., 20(6), 3932-550
3945. 551
Stanek, L.W., Sacks, J.D., Dutton, S.J. and Dubois, J.J.B. (2011) Attributing health 552
effects to apportioned components and sources of particulate matter: An evaluation of 553
collective results, Atmos. Environ., 45(32), 5655-5663. 554
Stone, V., Johnston, H. and Clift, M.J.D. (2007) Air pollution, ultrafine and 555
nanoparticle toxicology: Cellular and molecular interactions, IEEE Trans. 556
Nanobioscience, 6(4), 331-340.
557
Terzano, C., Di Stefano, F., Conti, V., Graziani, E. and Petroianni, A. (2010) Air 558
pollution ultrafine particles: toxicity beyond the lung, Eur. Rev. Med. Pharmacol. Sci., 559
14(10), 809-821. 560
U.S. Environmental Protection Agency (2011) Exposure Factors Handbook 2011 561
Edition (Final). Washington, DC, U.S. Environmental Protection Agency.
562 2 3 4 5 6 7 8 9 10 11 12 13 14 15 16 17 18 19 20 21 22 23 24 25 26 27 28 29 30 31 32 33 34 35 36 37 38 39 40 41 42 43 44 45 46 47 48 49 50 51 52 53 54 55 56 57
Unfried, K., Albrecht, C., Klotz, L.O., Von Mikecz, A., Grether-Beck, S. and Schins 563
R.P.F. (2007) Cellular responses to nanoparticles: Target structures and mechanisms, 564
Nanotoxicology, 1, 52–71.
565
Wallace, L. (2006) Indoor sources of ultrafine and accumulation mode particles: size 566
distributions, size-resolved concentrations, and source strengths, Aerosol Sci. Technol., 567
40, 348–360. 568
Wang, F., Costabileb, F., Li, H., Fang, D. and Alligrini, I. (2010) Measurements of 569
ultrafine particle size distribution near Rome, Atmos. Res., 98(1), 69-77. 570
Wang, Y., Hopke, P. K., Chalupa, D. C. and Utell, M. J. (2011) Long-term study of 571
urban ultrafine particles and other pollutants. Atmos. Environ., 45(40), 7672-7680. 572
Weichenthal, S., Dufresne, A., Infante-Rivard, C. and Joseph, L. (2008) Characterizing 573
and predicting ultrafine particle counts in Canadian classrooms during the winter 574
months: model development and evaluation, Environ. Res., 106(3), 349-360. 575
World health orhanization (2006) Air Quality Guidelines Global Update 2005: 576
Particulate Matter, Ozone, Nitrogen Dioxide, and Sulfur Dioxide. Copenhagen,
577
Danemark, World Health Organization Regional Office for Europe. 578
Zhang, Q., Zhu, Y. (2012) Characterizing ultrafine particles and other air pollutants at 579
five schools in South Texas. Indoor Air, 22(1), 33-42. 580 2 3 4 5 6 7 8 9 10 11 12 13 14 15 16 17 18 19 20 21 22 23 24 25 26 27 28 29 30 31 32 33 34 35 36 37 38 39 40 41 42 43 44 45 46 47 48 49 50 51 52 53 54 55 56 57
Figure 1. Examples of indoor and outdoor UFP concentrations profiles at three schools: 582
(a, b) urban (US1 and US2), (c) rural (RS1). At urban school US1 the increase of UFP 583
was associated with clay material that was being grinded by teacher for afternoon 584
classes. Concentration trend of UFP at urban school US2 shows the similarity of indoor 585
and outdoor profiles. 586 2 3 4 5 6 7 8 9 10 11 12 13 14 15 16 17 18 19 20 21 22 23 24 25 26 27 28 29 30 31 32 33 34 35 36 37 38 39 40 41 42 43 44 45 46 47 48 49 50 51 52 53 54 55 56 57
14.9-19.3xl0 (2.23x10³-l.93x 105)
Gennany 6.5xl03 (2.6-12.lx103) 10-487 !Ull 64 prima1y anel seconcl
ary schools; Fronuue et ai., 2007 36 classrooms;
Sampling both in winter and smmuer:
Greece 24xl03 (n.r. -52xl03) 0.01-1 fllll Sample collection cluring 1 day for 5 h: 7 primmy schools: Diapouli et al., Differeut indoor microenvironments; 2007,2008
Samples collected in 2 winter periocls;
Demnark 1.6 X 10³ª ( 2.2-36.4x10³) n.a. 150 d8 hour sample collection (8:00 to 16:00); ay-care facilities ( children 1-5 years Clausen et ai.. 2012
Italy 12-40xl03 (n.r.) 10-300 !Ull old) 3 schools (2 prima1y and 1 secouda1y); Buonanno et ai..
Sample collection for two days; 2012
Personal exposure assessment: 100
children aged 8-11 years:
Various microenvironments/activities:
Italy 19.5-20.4xl03 (n.a.) < 100nm 3 schools; Buonanno et ai..
2-3 classrooms in each school; 2013a
2 weeks sampling in each schools; Sample collection during school hours
Sweden 0.7-4.4 xl03 (n.a.) 0.01-1 fllll 1 element(8:30 to 13:30 or to 16:30) aiy school; No1·back et ai.. 2011
Total of61 classrooms;
Sampling repeatedly during 3 weeks;
5.4xl03 (1.1-10.4xl03) 3 h sample collection:
North Canada 0.02-1 µ111 2 schools: 1 elementmy Weichenthal et ai..