Escola de Engenharia
Joana Filipa Torres Pinheiro da Cunha
E
NGINEERING YEAST TOLERANCE TO
INHIBITORY LIGNOCELLULOSIC BIOMASS
Dissertação de Mestrado
Mestrado em Bioengenharia
Trabalho efectuado sob a orientação de:
Professora Doutora Lucília Domingues
e co-orientação de:
Doutora Carla Oliveira
É autorizada a reprodução parcial desta tese apenas para efeitos de investigação, mediante declaração escrita do interessado, que a tal se compromete,
Universidade do Minho, ___/___/_____
iii
Agradecimentos
Em primeiro lugar gostaria de agradecer às minhas orientadoras, Professora Doutora Lucília Domingues e Doutora Carla Oliveira, pela orientação, apoio, partilha de saber e pela disponibilidade.
À Tatiana e ao Francisco por toda a ajuda, disponibilidade, pelo acompanhamento incansável ao longo de todo o trabalho e por todas as palavras de incentivo.
Aos restantes colegas do grupo LD, Sofia M., Sofia C., Fred, Claúdia, Diana, Maikon, Alóia, Eduardo e Daniel, por toda a ajuda e companheirismo.
Aos colegas da PBMS, principalmente à Carla, à Débora, à Ana e ao Franklin, por estarem sempre disponíveis a ajudar, por proporcionarem um excelente ambiente de trabalho e por todos os momentos de descontracção.
A todas as moradoras do 50, principalmente Jé, Pobeira, Mika, Su e Analuce, por toda a amizade e alegre companhia, e por durante 5 anos fazerem com que viver em Braga se tornasse um verdadeiro “sentir em casa”.
A todos os amigos da “Happy Family” que durante estes anos encheram de alegria e boa disposição a vida académica, e a menos académica também. À Cat, ao Pontinho e ao Nuno, porque a vossa companhia torna cada dia melhor que o anterior, e porque esta universidade sem vós estaria praticamente vazia. À Joaninha, porque mesmo à distância o “contacto visual” mantém-se. À Ana, pela ajuda e por ser a prova de que “amigos de intervalo” se podem tornar em amigos para a vida. À Mika, pela grande amizade, alegria contagiante, por toda a ajuda e partilha, e basicamente por teres tornado estes 6 anos “altaméiintes”.
À Ju, ao Eduardo, à Marta, ao Hugo, à Rita, ao Paulo e ao Tiago por toda a vossa amizade e por fazerem com que voltar à terra seja sempre um prazer.
À minha família, principalmente à minha mãe e ao meu irmão, sem vós nada disto seria possível.
iv
Financial support:
This work was funded by Fundação para a Ciência e a Tecnologia (FCT), Portugal: project GlycoCBMs FCT PTDC/AGR-FOR/3090/2012 – FCOMP-01-0124-FEDER-027948.
v
Abstract
The progressive depletion of fossil fuels reserves in the last years led to the necessity for biotechnological manufacturing based on lignocellulosic feedstocks. Lignocellulosic biomass, such as straw, is an abundant low-cost source for production of biofuels, such as bioethanol, that does not compete for food needs. However, lignocellulose-to-ethanol process involves pre-treatment of biomass to obtain readily fermentable sugars, which leads to the accumulation of inhibitory by-products (e.g. furan derivatives, phenolic compounds, organic acids). Significant progress has been made in the understanding of the determinants of yeast tolerance to lignocellulose biomass-derived inhibitors, as well as to high ethanol concentrations. Nevertheless, further knowledge at the genetic level is of essential importance for the improvement of second generation bioethanol conversion technology.
In a previous work, 5 genes, ERG2, PRS3, RAV1, RPB4 and VMA8, were found to contribute to the maintenance of cell viability and/or for maximal fermentation rate in wheat straw hydrolysate. Taking into account the negative effects reported from single overexpression of ERG2, RAV1 and VMA8 under non-stressful conditions, these genes were not considered as good targets for genetic engineering in the present work. Furthermore, ZWF1, a gene essential for yeast response to the presence of acetic acid, was added to the set of genes considered in the present study. To attempt to overcome the fermentation hurdles resultant from the inhibitory load mentioned above, molecular biology tools were used to: (1) unravel HAA1, PRS3 and RPB4 role in adaptation to toxic biomass hydrolysates, evaluating their expression levels, by qRT-PCR, in the outstanding-fermenting Saccharomyces cerevisiae PE-2 when exposed to acetic acid, HMF and furfural, and (2) improve yeast tolerance and adaptation by overexpressing these genes in the auxotrophic S. cerevisiae BY4741, using multi-copy vectors, and assessing the effects in Eucalyptus globulus wood hydrolysate.
Increased HAA1, PRS3 and RPB4 expression levels were observed at the late lag and/or initial stationary phases of the fermentation in the presence of inhibitors. However, the overexpression of these genes under the control of the strong constitutive ScPGK1 promoter has not resulted in improved growth and fermentation profiles. On the other hand, the overexpression of HAA1 and PRS3 genes under the regulation of their native promoters resulted in fermentations profiles with a reduced lag-phase. These results indicate that PRS3 and principally HAA1 overexpression play an important role in the adaptation to lignocellulosic-based stress, and are good candidates for yeast engineering to improve bioethanol production.
vii
Resumo
A diminuição progressiva das reservas de combustíveis fósseis nestes últimos anos levou à necessidade de uma indústria biotecnológica baseada em matérias-primas lenhocelulósicas. A biomassa lenhocelulósica, tal como a palha, é uma fonte abundante de baixo preço para a produção de biocombustíveis, como o bioetanol, que não compete com as necessidades alimentares. Contudo, o processo de conversão de biomassa lenhocelulósica a etanol envolve um pré-tratamento da biomassa para obtenção imediata de açúcares fermentescíveis, levando à acumulação de produtos inibitórios (ex. derivados de furano, compostos fenólicos, ácidos orgânicos). Avanços significativos têm sido efectuados no que concerne à compreensão de determinantes da tolerância de leveduras a inibidores derivados da biomassa lenhocelulósica, tal como a concentrações elevadas de etanol. No entanto, um maior conhecimento a nível genético é essencial para o melhoramento de tecnologias para a conversão de bioetanol de segunda geração.
Num trabalho anterior, 5 genes, ERG2, PRS3, RAV1, RPB4 e VMA8 foram identificados como importantes para a manutenção da viabilidade celular e/ou para maximizar a taxa de fermentação em hidrolisados de palha de trigo. Considerando os efeitos negativos reportados da sobre-expressão singular dos genes ERG2, RAV1 e VMA8 na ausência de stress, estes genes foram considerados, neste trabalho, como não sendo bons alvos para engenharia genética.
Adicionalmente, o gene HAA1, essencial na resposta à presença de ácido acético em leveduras, foi acrescentado ao conjunto de genes considerado neste estudo. Na tentativa de ultrapassar os problemas fermentativos acima referidos, ferramentas de biologia molecular foram usadas para: (1) desvendar o papel dos genes HAA1, PRS3 e RPB4, na adaptação a hidrolisados de biomassa tóxicos, avaliando os seus níveis de expressão por qRT-PCR, no excepcional organismo fermentativo Saccharomyces cerevisiae PE-2 quando exposto a ácido acético, HMF e furfural, e (2) melhorar a tolerância e adaptação da levedura através da sobre-expressão destes genes na estirpe auxotrófica S. cerevisiae BY4741, usando vectores multi-cópia, e avaliar os efeitos em hidrolisado de madeira de Eucalyptus globulus.
Níveis de expressão aumentados dos genes HAA1, PRS3 e RPB4 foram observados no final da fase de adaptação e/ou no inicio da fase estacionária da fermentação na presença de inibidores. Todavia, a sobre-expressão destes genes sob o controlo do promotor constitutivo e forte ScPGK1 não demonstrou um melhoramento dos perfis de crescimento e fermentativos. Em contrapartida a sobre-expressão dos genes HAA1 e PRS3 sob a regulação dos seus promotores nativos resultaram em perfis de fermentação com reduzida fase de adaptação. Estes resultados indicam que a sobre-expressão do PRS3 e principalmente do HAA1 tem um papel importante na adaptação ao stress derivado de biomassa lenhocelulósica, sendo bons candidatos para a engenharia genética de leveduras, de modo a obter melhorias na produção de bioetanol.
ix
Table of contents
Agradecimentos ... iii
Abstract ... v
Resumo ... vii
List of figures ... xiii
List of tables ... xix
List of abbreviations ... xxi
Aims ...1
1. Introduction ...5
1.1. Biofuels ...7
1.2. Bioethanol ...7
1.2.1. Second generation bioethanol ...8
1.2.2. Bioethanol production from lignocellulosic biomass ...8
1.3. Genes associated with S. cerevisiae tolerance to ethanol, acetic acid, vanillin, furfural and HMF...12
1.3.1. Genes associated with S. cerevisiae tolerance to the simultaneous presence of ethanol, acetic acid, vanillin, furfural and HMF in Wheat Straw Hydrolysate ...14
2. Materials and methods ...19
2.1. Sterilization of material, solutions and culture media ...21
2.2. Strains ...21
2.3. Bacteria and yeast cells storage ...22
2.4. Media ...22
2.5. Vectors ...22
2.6. Primers ...23
2.7. Plasmid DNA preparation from E. coli strains...25
2.7.1. Rapid plasmid DNA extraction ...25
2.7.2. Commercial kit ...25
2.8. Genomic DNA extraction ...26
2.9. DNA quantification ...26
2.10. DNA Storage ...26
2.11. Amplification of DNA fragments by Polymerase Chain Reaction (PCR) ...27
x
2.11.2. Colony PCR ...27
2.12. DNA Electrophoresis ...28
2.12.1. Agarose gel ...28
2.12.2. DNA molecular weight marker ...28
2.13. DNA purification of PCR products ...29
2.14. DNA purification from agarose gel ...29
2.15. Enzymatic modification of DNA ...30
2.15.1. Digestion with restriction endonucleases ...30
2.15.2. Plasmid DNA dephosphorylation ...30
2.15.3. Ligation reactions ...30
2.16. Transformation of E. coli cells ...30
2.16.1. Heat-shock method ...31
2.16.2. Electroporation ...31
2.17. Transformation of S. cerevisiae ...32
2.18. Aerobic growth in microplates...33
2.19. Shake-flask fermentations ...33
2.20. HPLC quantification ...34
2.21. Quantitative Reverse Transcriptase PCR (qRT-PCR) ...34
2.21.1. RNA purification ...34
2.21.2. cDNA synthesis ...35
2.21.3. Quantitative PCR ...36
3. Results and discussion ...37
3.1. Study of PRS3, RPB4 and HAA1 expression in a robust S. cerevisiae industrial strain during fermentations in control and inhibitory media ...39
3.1.1. RNA quality ...39
3.1.2. Quantitative Reverse Transcriptase PCR ...40
3.2. Construction of recombinant S. cerevisiae BY4741 overexpressing ZWF1, PRS3, RPB4 and HAA1 genes under the control of the ScPGK1 promoter ...44
3.2.1. Growth characterization of the overexpressing S. cerevisiae strains ...49
3.2.2. Effect of ZWF1, PRS3, RPB4 and HAA1 overexpression in lignocellulosic-based fermentations ...51
xi
3.3.1. Effect of HAA1 overexpression under the regulation of its native promotor ...53
3.3.2. Effect of HAA1 overexpression under the regulation of the ScPGK1 promoter ...54
3.4. Study of the effect of ZWF1, PRS3 and RPB4 overexpression under the regulation of the native promoters ...55
3.4.1. Construction of recombinant S. cerevisiae BY4741 overexpressing ZWF1, PRS3 and RPB4 genes under the regulation of the native promoters ...55
3.4.2. Effect of ZWF1, PRS3 and RPB4 overexpression under the regulation of their native promoters in lignocellulosic-based fermentations ...57
4. Conclusions and future perspectives ...59
5. References ...63
xiii
List of figures
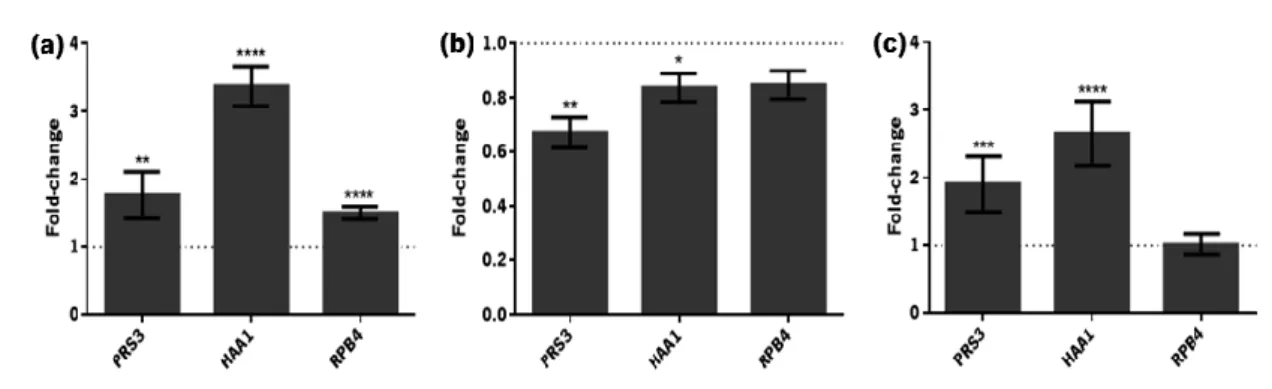
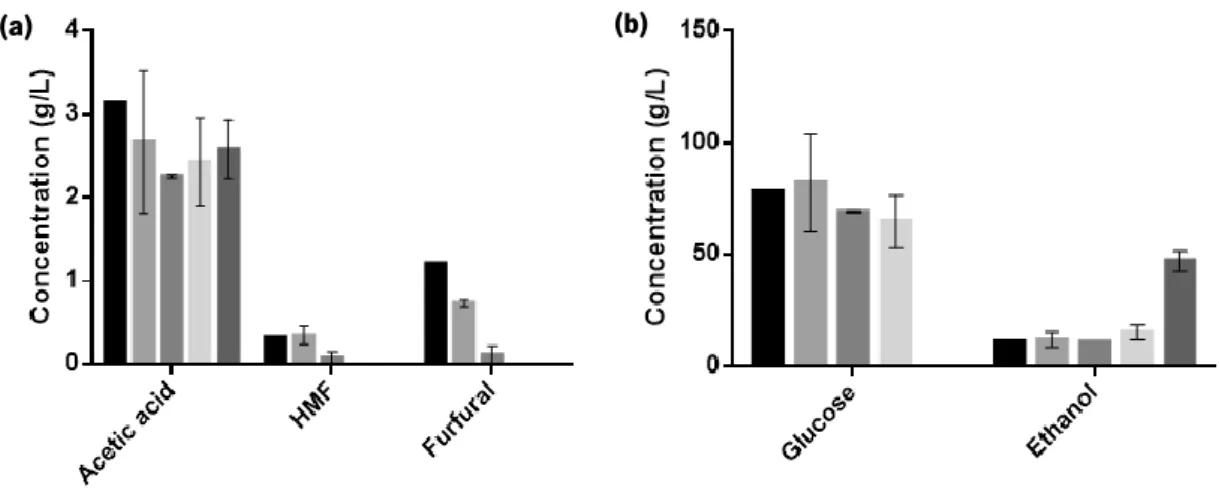
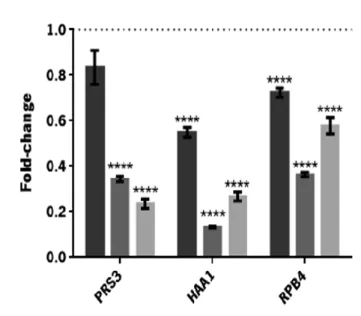
Figure 1.1. Reactions occurring during pre-treatment and hydrolysis of lignocellulosic materials. Adapted from Palmqvist and Hahn-Hagerdal [17]. ...9 Figure 1.2. Main raw materials and processes used for ethanol production. Reproduced from Mussatto et al. [6]. ...10 Figure 1.3. Comparison of the yeast genes described as determinants of resistance to inhibitory concentrations of ethanol, acetic acid and furfural or vanillin. Adapted from Pereira et al, 2011 [58]. ...14 Figure 1.4. Roles played by the RPB4/7 sub-complex in stress and non-stress related phenotypes. Reproduced from Sampath and Sadhale, 2005 [78]. ...17 Figure 3.1. Profile of CO2 production of S. cerevisiae PE-2 in YPD (▲) and in YPD supplemented with acetic acid (3 g/L), HMF (0.3 g/L) and furfural (1.66 g/L) (●). Data represents average ± standard deviation obtained from two biological replicates. Samples were collected at the time-points indicated with black arrows. ...39 Figure 3.2. Verification of RNA integrity. Samples from the duplicate control fermentations: lag-phase, initial exponential lag-phase, initial stationary phase (lanes 1-6). Samples from the duplicate inhibitory medium fermentations: early lag-phase, late lag-phase, initial exponential phase, initial stationary phase (lanes 7-14). The 18S:28S intensity ratio (calculated using the Image Lab 4.0 software) is indicated in each lane. ...40 Figure 3.3. Differential expression of PRS3, HAA1 and RPB4 during different phases of S. cerevisiae PE-2 fermentation in inhibitory medium: (a) late lag-phase, (b) initial exponential phase and (c) initial stationary phase. Results are shown as the fold-change in expression relative to that on the same phase of S. cerevisiae PE-2 fermentation in the absence of stress (represented by the dotted line). Data represents average ± SEM obtained from two biological replicates and at least two experimental replicates. The statistical significance of the results was quantified using multiple t-tests. *P ≤ 0.05; **P ≤ 0.01; ***P ≤ 0.001; **** P ≤ 0.0001. ...41 Figure 3.4. Variation of the concentration of the inhibitors, acetic acid, HMF and furfural (a), as well as glucose and ethanol (b), during the fermentation of S. cerevisiae PE-2 in inhibitory media: fermentation start ( ), early lag-phase ( ), late lag-phase ( ), initial exponential phase ( ) and
xiv
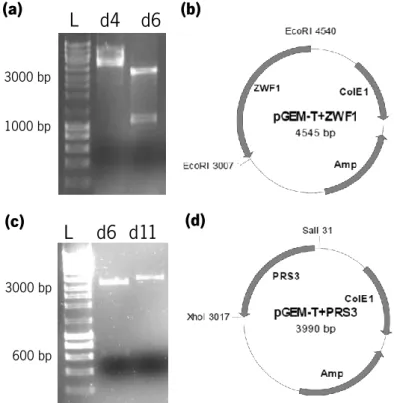
initial stationary phase ( ). Data represents average ± SEM obtained from two biological replicates. ...42 Figure 3.5. Differential expression of PRS3, HAA1 and RPB4 along a fermentation in inhibitory medium: late lag-phase ( ), initial exponential phase ( ) and initial stationary phase ( ). Results are shown as the fold-change in expression relative to that on the early lag-phase of the same fermentation (represented by the dotted line). Data represents average ± SEM obtained from two biological replicates and at least two experimental replicates, and the statistical significance of the results was quantified using multiple t-tests. *P ≤ 0.05; **P ≤ 0.01; ***P ≤ 0.001; **** P ≤ 0.0001. ...43 Figure 3.6. PCR amplifications of the coding sequence of the genes of interest from S. cerevisiae CEN.PK113-7D. Lane 1: ZWF1 PCR product; lane 2: PRS3 PCR product; lane 3: RPB4 PCR product. ...45 Figure 3.7. Confirmation of insertion of ZWF1 (a and b) and PRS3 (c and d) genes into pGEM-T Easy Vector. (a) Resulting pattern of digestion of pGEM-T+ZWF1 with PstI (expected patterns were 4057 and 488 bp or 3451 and 1094 bp). (b) Representation of the pGEM-T Easy vector with ZWF1 (c) Resulting pattern of digestion of pGEM-T+PRS3 with SacI (expected patterns were 3569 and 421 bp or 3342 and 648 bp). (d) Representation of the pGEM-T Easy vector with PRS3. ...45 Figure 3.8. Confirmation of insertion of RPB4 into pGEM-T Easy Vector. (a) Colony PCR of 18 white colonies using ScRPB4 primers (Table 2.3). An amplicon of 678 bp was expected. (b) Representation of the pGEM-T Easy vector with RPB4. ...45 Figure 3.9. Restriction enzyme digestion of the different constructs in pGEM-T Easy Vector and of pMI516MCS Vector. (a) pGEM-T+ZWF1 (1) and pMI516_ MCS (2) were digested with EcoRI. (b) pGEM-T+PRS3 (1) and pMI516MCS (2) were digested with SalI and XhoI. (c) pGEM-T+RPB4 (1) and pMI516_ MCS (2) were digested with BamHI and XhoI. ...46 Figure 3.10. Confirmation of correct insertion of ZWF1, PRS3 and RPB4 genes into pMI516MCS vector. Representation of the pJCZ (b), pJCP (d) and pJCR (f) vectors. (a) Colony PCR of 14 colonies using ScZWF1_fw and PGK_rv primers (Table 2.3), with an expected amplicon of 1758 bp. (c) Colony PCR of 18 colonies using ScPRS3_fw and PGK_rv primers (Table 2.3), with an expected amplicon of 1150 bp. (d) Colony PCR of 18 colonies using ScRPB4_rv and PGK_fw primers (Table 2.3), with an expected amplicon of 878 bp. ...46
xv
Figure 3.11. Section of the sequencing chromatogram of pGEM-T+ZWF1 showing the mutation on the expected restriction site for XhoI (CTCGAG). ...47 Figure 3.12. PCR amplification of the coding sequence of HAA1 from S. cerevisiae CEN.PK113-7D. ...47 Figure 3.13. Confirmation of insertion of HAA1 genes into pGEM-T Easy Vector. (a) Colony PCR of 12 white colonies using ScHAA1 primers (Table 2.3) with an expected amplicon of 2103 bp. (b) Representation of the pGEM-T Easy vector with HAA1. ...48 Figure 3.14. Restriction enzyme digestion of pGEM-T+HAA1 (1) and pMI516MCS (2) with EcoRI e XhoI. ...48 Figure 3.15. Confirmation of correct insertion of HAA1 into pMI516MCS vector. (a) Colony PCR of 14 colonies using ScHAA1_rv and PGK_fw primers (Table 2.3) with an expected amplicon of 2294 bp. (b) Representation of the pJCH vector. ...48 Figure 3.16. Confirmation of transformation of S. cerevisiae with pJCZ, pJCP and pJCR. (a) Colony PCR of 8 colonies using ScZWF1_fw and PGK_rv primers (Table 2.3), with an expected amplicon of 1758 bp. (b) Colony PCR of 2 colonies using ScPRS3_fw and PGK_rv primers (Table 2.3), with an expected amplicon of 1150 bp. (c) Colony PCR of 6 colonies using ScRPB4_rv and PGK_fw primers (Table 2.3), with an expected amplicon of 878 bp. ...49 Figure 3.17. Confirmation of transformation of S. cerevisiae with pJCH. Colony PCR of 17 colonies using ScHAA1_rv and PGK_fw primers (Table 2.3) with an expected amplicon of 2294 bp...49 Figure 3.18. Confirmation of transformation of S. cerevisiae with pMI516MCS. Colony PCR of 8 colonies using PGK_fw and PGK_rv primers (Table 2.3) with an expected amplicon of 419 bp. 49 Figure 3.19. Aerobic growth of S. cerevisiae BY4741 (♦) (in YPD medium) and of the transformants pMI516MCS (■), pJCZ (▲), pJCP (●) and pJCR (■) in YPD with G418. Data represents average ± standard deviation from three biological replicates. ...50 Figure 3.20. Aerobic growth of S. cerevisiae BY4741 (♦) (in YPD with 3 g/L of acetic acid, 0.3 g/L of HMF and 1.6 g/L of furfural) and of the transformants: pMI516MCS (■), pJCZ (▲), pJCP (●) and pJCR (■) in YPD medium with G418 and supplemented with the same quantities of the referred inhibitors. Data represents average ± standard deviation from three biological replicates. ...50
xvi
Figure 3.21. Aerobic growth of S. cerevisiae BY4741 (♦) (in YPD with 1.89 g/L of HMF and 2.88 g/L of furfural) and of the transformants: pMI516MCS (■), pJCZ (▲), pJCP (●) and pJCR (■) in YPD medium with G418 and supplemented with the same quantities of the referred inhibitors. Data represents average ± standard deviation from three biological replicates. ...51 Figure 3.22. Profile of CO2 production of S. cerevisiae BY4741 transformants: pMI516MCS (■), pJCZ (▲), pJCP (●), pJCR (■) and pJCH (♦) in EWH (70%) fermentations. Data represents average ± standard deviation obtained from two biological replicates. ...52 Figure 3.23. Profile of CO2 production of the deletion mutant S. cerevisiae BY4741 Δhaa1 (♦) and of S. cerevisiae BY4741 transformants: YEplac195 (■), BHUM1737 (■), pMI516MCS (●) and pJCH (●) in EWH (70%) fermentations. Data represents average ± standard deviation obtained from two biological replicates. ...53 Figure 3.24. PCR amplifications of the genes of interest from S. cerevisiae CEN.PK113-7D with native promotor and terminator sequences. Lane 1: ZWF1 PCR product; lane 2: PRS3 PCR product; lane 3: RPB4 PCR product. ...55 Figure 3.25. Confirmation of insertion of ZWF1, PRS3 and RPB4 with native regulatory regions into pGEM-T Easy Vector. Representation of pGEM-T Easy with ZWF1 (b), PRS3 (d) and RPB4 (e). (a) Colony PCR of 8 colonies using ScZWF1_V1 and ScZWF1_rv primers (Table 2.3) and an amplicon of 1081 bp was expected; and of 7 colonies using ScPRS3 primers (Table 2.3) and an amplicon of 975 bp was expected. (c) Colony PCR of 8 colonies using ScRPB4_nat primers (Table 2.3) and an amplicon of 1322 bp was expected. ...56 Figure 3.26. Restriction enzyme digestion of the different constructs in pGEM-T Easy Vector and of YEplac195 vector. pGEM-T+ZWF1nat (1), pGEM-T+RPB4nat (2) and YEplac195 (3) were digested with SacI and SphI. pGEM-T+PRS3nat (4) and YEplac195 (5) were digested with EcoRI. ...56 Figure 3.27. Confirmation of insertion of ZWF1, PRS3 and RPB4 with native regulatory regions into YEplac195 vector. (a) Resulting pattern of digestion of YEpJCZ (1 and 2) and YEpJCR (3 and 4) with HindIII. (b) Resulting pattern of digestion of YEpJCP with XbaI. ...56 Figure 3.28. Confirmation of transformation of S. cerevisiae with YEpJCZ, YEpJCP and YEpJCR. Colony PCR of 2 colonies using ScZWF1 primers (Table 2.3; lanes 1-4) and an amplicon of 1530 bp was expected.. Colony PCR of 2 colonies using ScPRS3_nat primers (Table 2.3; lanes 5-8)
xvii
and an amplicon of 1538 bp was expected.. Colony PCR of 2 colonies using ScRPB4_nat primers (Table 2.3; lanes 9-12) and an amplicon of 1322 bp was expected. ...57 Figure 3.29. Profile of CO2 production of S. cerevisiae BY4741 transformants: YEplac195 (■), YEpJCZ (▲), pJCP (●), pJCR (■) and BHUM1737 (♦) in EWH (60%) fermentations. The smaller graphic focus on the initial 40 hours of the fermentation. Data represents average ± standard deviation obtained from two biological replicates. ...57
xix
List of tables
Table 1.1. List of genes, that, when overexpressed, are reported to play a protective role against inhibitory concentrations of furfural and/or HMF. ...13 Table 1.2. Cellular function of the 11 genes required to provide tolerance to ethanol, acetic acid and vanillin or furfural. The cellular function was obtained from Saccharomyces Genome Database (http://www.yeastgenome.org). ...15 Table 2.1. Microbial strains used during this work. ...21 Table 2.2. Vectors used during this work...22 Table 2.3. Primers used during this work. Underlined are the recognition sites of the restriction enzymes used in the cloning procedures. ...24 Table 2.4. NZYDNA Ladder III bands molecular weight. ...29 Table 3.1. Effect of the overexpression of ZWF1, PRS3 and RPB4 genes in EWH fermentations. Data represents average ± standard deviation of two independent experiments and the absence of statistical significance of the results was determined by one-way ANOVA. ...52 Table 3.2. Effect of the HAA1 gene in EWH fermentation. Data represents average ± standard deviation of two biological replicates and the absence of statistical significance of the results was determined by one-way ANOVA. ...53 Table A1. Composition of solutions and media used for different strains growth……….……..73
xxi
List of abbreviations
°C degree Celsius µg microgram µl microliter µM micromolarADH1 alcohol dehydrogenase I
Ag Ashbya gossypii
amp ampicillin
bp base pairs
cDNA complementary deoxyribonucleic acid
DNA deoxyribonucleic acid
dNTPs deoxyribonucleotide triphosphates
DTT Dithiothreitol
EDTA ethylenediamine tetraacetic acid
EWH Eucalyptus globulus wood hydrolysate
G Gram
G relative centrifugal force
G418 Geneticin h Hour HMF 5-hydroxymethyl furfural IPTG β-D-1-thiogalactopyranoside K kilo (103) kV Kilovolt L Liter LB Luria-Bertani medium
LiOAc Lithium Acetate
M molar concentration
min Minute
Ml Mililiter
mM Milimolar
mRNA messenger ribonucleic acid
ms Millisecond
Ng nanogram
Nm nanometer
OD optical density
PCR Polymerase Chain Reaction
PEG Polyethylene Glycol
PGK1 3-phosphoglycerate kinase
RNA ribonucleic acid
xxii
Rpm revolutions per minute
rRNA ribosomal ribonucleic acid
S second
SAP Shrimp Alkaline Phosphatase
Sc Saccharomyces cerevisiae
SD Synthetic Defined
SHF Separate Hydrolysis and Fermentation
SOC Super Optimal broth with Catabolite repression
SSCF Simultaneous Saccharification and Co-Fermentation
SSF Simultaneous Saccharification and Fermentation
TAE Tris-Acetate-EDTA
TE Tris-EDTA
TEF Translation elongation factor 1 α
Tris tris(hydroxymethyl)aminomethane
tRNA transfer ribonucleic acid
WSH Wheat Straw Hydrolysate
WT Wild Type
X-gal 5-bromo-4-chloro-indolyl-β-D-galactopyranoside
1
AIMS
3
In recent years the necessity for biotechnological manufacturing based on lignocellulosic feedstocks has become evident. However, the required pre-treatment in the production of lignocellulosic bioethanol leads to the accumulation of by-products inhibitory to yeast growth. A set of genes required for tolerance to stress induced by sole inhibitors was already identified, however, little is known about tolerance to multi-stress induced by multiple inhibitors. Based on genome-wide results, 5 genes, ERG2, PRS3, RAV1, RPB4 and VMA8, were previously found to contribute to the maintenance of cell viability in wheat straw hydrolysate and/or for maximal fermentation rate in this substrate. However, there are no studies describing the outcome in ethanol productivity of lignocellulosic-based fermentations using recombinant S. cerevisiae overexpressing these genes.
Taking into account that single overexpression of ERG2, RAV1 and VMA8 under non-stressful conditions was found to result in a negative effect on ergosterol biosynthesis, toxicity for the yeast cell and in a diminished growth rate, respectively, these genes were not considered as good targets for genetic engineering. Furthermore, HAA1, a gene essential for yeast response to the presence of acetic acid [1, 2] and which overexpression was found to enhance tolerance to this inhibitor, was equally studied. Therefore, to expand our understanding of the underlying molecular mechanisms involved in yeast response to the multiple stresses occurring during lignocellulose fermentations under industrially relevant conditions, we specifically aimed to:
1. study HAA1, PRS3 and RPB4 expression in S. cerevisiae PE-2 by qRT-PCR during fermentation in the presence of lignocellulose-related inhibitors;
2. create S. cerevisiae strains overexpressing HAA1, PRS3 and RPB4 genes under the control of their native promoters or of the strong constitutive ScPGK1 promoter;
3. evaluate the effect of these genes’ overexpression in terms of bioethanol production, in fermentations of Eucalyptus globulus wood hydrolysate.
5
INTRODUCTION
7
1.1. Biofuels
The world faces the progressive depletion of its fossil fuels reserves, the most important of the available energetic resources, resulting in a constant rise of the oil prices. Also, the excessive consumption of these fuels during the last decades has greatly contributed to generating high levels of pollution, mostly in large urban areas, associated with elevated greenhouse gas emissions. This allied with the growing demand for energy for transportation, heating, industrial processes, among others, have denoted the need for a substitute for the fossil fuels [3].
The renewable energy industry is currently well developed, however it is mostly focused in the production of electrical energy (wind, solar, and tidal energy, hydro- and geo-energy). Liquid fuels are the basis of more than half of the energy consumed at the present, instigating the necessity to exploit other energy resources, such as biofuels [4].
Biofuel is any fuel that is produced from biomass, which consists of biological matter from dead or even living organisms (being, in this context, usually plant-based). The principal fuels produced from biomass are ethanol, methanol, biodiesel and hydrogen [5]. This work will focus on biomass-based ethanol (or bioethanol) production.
1.2. Bioethanol
Bioethanol is considered as a good alternative to substitute gasoline. Although its energy equivalent is 68% lower than petroleum-based fuel, it has a cleaner combustion [6], which results in a lower emission of toxic substances [7]. The replacement of gasoline by ethanol results in a reduction of more than 80% of carbon emissions, and completely eliminate the release of acid-rain-causing sulfur dioxide [8].
Currently, the leader country on the production of bioethanol is the United States of America (USA), followed by Brazil [9]. In 2012, the worldwide bioethanol production for the fuel market was over 82 thousand millions liters, of which 62% were produced in USA and 25% in Brazil [10]. The principal biomasses sources used in the process of ethanol production are corn (in USA) and sugar cane (in Brazil), among others. The ethanol produced from the easily obtained sugars from feedstocks is denominated first generation bioethanol. However, the utilization of these sources directly compete with the food and animal feed industry, and may not be sufficient to meet the increasing demand for fuel ethanol [11]. Moreover, the utilization of this bioethanol results in a greenhouse gases production not as low as desirable [11].
INTRODUCTION
8
1.2.1. Second generation bioethanol
The concerns regarding the feedstocks depletion, led to the necessity of a new generation of bioethanol produced from non-food biomass. This is called second generation bioethanol and is based in lignocellulosic biomass, the most abundant and sustainable raw material worldwide, which occurs as a byproduct, thus eliminating the competition with food and feed industry [12]. Such lignocellulosic biomass consists of agricultural (e.g. cereal straw, sugar cane bagasse), industrial (e.g., glycerol from biodiesel production by transesterification), municipal (organic components of solid wastes) and forestry (e.g. wood residues) wastes, and similar sources [13, 14].
As already denoted, the establishment of the second generation bioethanol eliminates the potential conflict between the use of land for food and for bioethanol production[15]. Moreover, the lignocellulosic material is geographically more evenly distributed than the fossil fuels, providing security of supply, and that fact might also provide employment in less-developed regions, especially in rural areas[15]. Another advantage of this lignocellulose-based bioethanol is the low greenhouse gas emission, and consequently low environmental impact [15].
Whereas the first generation bioethanol industry is well settled, the technology for bioethanol production based on lignocellulosic biomass is still developing. Furthermore, the process of conversion of lignocellulosic biomass is more complex than that of sugar- and starch-based sources, as a result of the rigid and complex molecular polymeric structure of cellulosic biomass (lignocellulose is highly resistant to chemical attack, solubilisation and bioconversion) [12]. The fact that cellulosic materials contain five different sugar monomers (glucose, galactose, mannose, xylose, arabinose), while starch is only composed of glucose [16], is another factor of complexity. Several biotechnological companies and government-funded laboratories have already engineered enzymes and microorganisms to optimize the technology to produce bioethanol from lignocellulose sources, and many are working to increase the efficiency of this process.
1.2.2. Bioethanol production from lignocellulosic biomass
Lignocellulosic biomass is mostly comprised of lignin, hemicellulose and cellulose. Pre-treatment and hydrolysis procedures results in the formation and liberation of a large range of compounds (Figure 1.1). Hemicellulose degradation liberates xylose, mannose, acetic acid, galactose, and glucose. Cellulose is hydrolysed to glucose. Furfural and 5-hydroxymethyl furfural
INTRODUCTION
9
(HMF) are formed from dehydration of pentoses and hexoses, respectively. Phenolic compounds are generated from the partial breakdown of lignin [17, 18].
Figure 0.1. Reactions occurring during pre-treatment and hydrolysis of lignocellulosic materials. Adapted from Palmqvist and Hahn-Hagerdal [17].
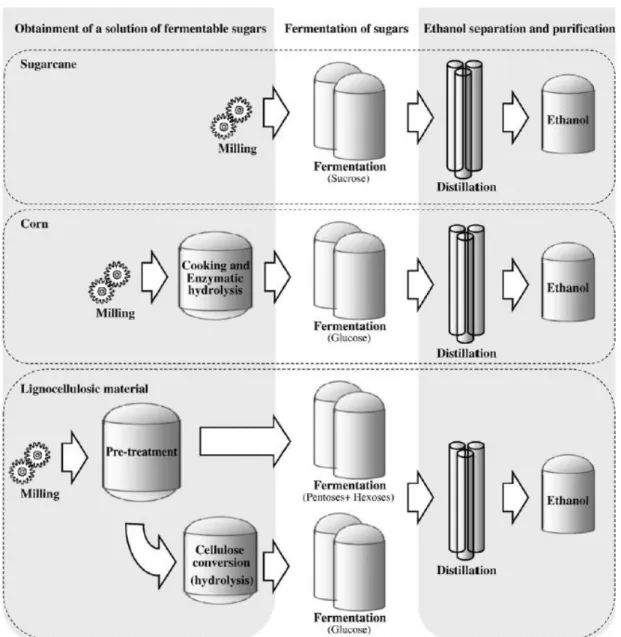
The method for ethanol production generally consists of three steps: (1) formation of a solution of fermentable sugars, (2) fermentation of these sugars into ethanol, and (3) separation and purification of the produced ethanol, usually by distillation (Figure 1.2) [19]. Production of ethanol from lignocellulosic material mainly differs from sugar- and starch-based production in the step of obtainment of fermentable sugars, being of a greater complexity. The extraction of sugars from sugar crops is a relatively simple procedure, consisting only in a milling step. Starch cannot be used directly for ethanol production, so, in processes that use starch-based materials (e.g. corn, wheat), a step of saccharification is necessary after milling. This saccharification step basically consists of an enzymatic hydrolysis, with α-amylase and amyloglucosidase, resulting in a total breakdown of starch into glucose[6].
INTRODUCTION
10
Figure 0.2. Main raw materials and processes used for ethanol production. Reproduced from Mussatto et al. [6].
When using lignocellulosic biomass an additional step is necessary before hydrolysis (Figure 1.2)[6]. This step is denominated pre-treatment and generally involves a milling process and a chemical pre-treatment (e.g. diluted acid, alkaline, solvent extraction, steam explosion) to make cellulose and hemicellulose more accessible to the subsequent steps [20]. It should be performed with a minimum formation of compounds capable of inhibiting fermenting microorganisms [18].
In 1976, Gauss et al. [21] presented the idea of simultaneously performing the enzymatic hydrolysis and fermentation. The main advantage of this process, later on denominated Simultaneous Saccharification and Fermentation (SSF), is the avoidance of the end-product inhibition of the hydrolysis step. Furthermore, with this process glucose does not need to be separated from the lignin fraction after the hydrolysis, avoiding the potential loss of sugar. This
INTRODUCTION
11
combination of steps also decreases the number of vessels needed and consequently the investment costs (estimated to be more than 20% reduced). However some drawbacks are present when comparing to the Separate Hydrolysis and Fermentation (SHF) process, where fermentation takes place subsequently, and independently from, the saccharification step [22]. The SSF process operates at non-optimal conditions for hydrolysis, as the optimum temperature for enzymatic hydrolyses is generally higher than that of fermentation (at least when yeast is the fermenting organism in use). Therefore a compromise between fermentation and hydrolysis must be found in order to optimize the temperature parameter and consequently, higher dosages of hydrolytic enzymes are required. In addition, the enzyme reutilization is difficult, as they strongly bind to the substrate. Considering that these cellulases account for an important part of production costs, it is necessary to reduce the enzyme doses to be utilized, e.g. by the addition of surfactants [23, 24].
S. cerevisiae is the most used organism in industrial processes involving alcoholic fermentation. This preference is result of: its GRAS (generally regarded as safe) status; its good fermentable capacity and ethanol tolerance, which allows high ethanol production (up to 20% (v/v)) [25, 26]; its rapid growth under anaerobic condition, important for the oxygenation problem in large-volume industrial fermentations [27]; being one of the best studied organisms, in terms of scientific and industrial knowledge. Furthermore, its easily genetic manipulation and fully sequenced genome, makes S. cerevisiae the ideal organism for improvement by genetic engineering.
Even though S. cerevisiae is one of the most effective ethanol-producing microorganism, it is unable to utilize pentose sugars for growth or fermentation [22]. The necessity to create a recombinant S. cerevisiae strain with the ability to ferment both hexose and pentose sugars emerged, and was already obtained in some studies [28-30] allowing the possibility of a Simultaneous Saccharification and Co-Fermentation (SSCF).
One of the major challenges faced in the production of lignocellulosic bioethanol is the generation of inhibitory compounds during the biomass pre-treatment and hydrolysis steps. These inhibitors of microbial growth comprise furan derivatives (furfural and HMF), several phenolic compounds (e.g. vanillin) and organic acids (e.g. acetic acid) (Figure 1.1). The success of lignocellulosic biomass utilization is necessarily dependent on the development of recombinant S. cerevisiae strains capable of withstand, survive, and function in the different stresses imposed
INTRODUCTION
12
during the bioethanol production processes, including inhibition by the above mentioned compounds, as well as by increasing ethanol concentration, wide pH and osmotic shifts.
1.3. Genes associated with S. cerevisiae tolerance to ethanol, acetic acid, vanillin, furfural and HMF
Genome-wide screenings for deletion mutants of S. cerevisiae with differential susceptibility to stress induced by ethanol[31], acetic acid[32], vanillin[33] and furfural and/or HMF[34] are described in the literature. These disruptome analyses allowed the registration of phenotypes showing susceptibility (growth inhibition) to the induced-stresses, leading to the identification of genes required for yeast tolerance to the referred stressors. A set of mutants were identified as having increased sensitivity to ethanol (254 genes), to acetic acid (648 genes), to vanillin (76 genes) and to furfural/HMF (62 genes) [31-34].
Gene expression analysis techniques, such as microarray or quantitative real-time PCR (qRT-PCR), are of great importance for understanding the molecular mechanisms of acquired tolerance to inhibitors stress. Using these tools, several studies have reported the identification of key genes related to the genomic adaptation to: acetic acid [35, 36], HMF [35, 37], furfural [35, 36], both furfural and HMF [38, 39], and lignocellulosic-based hydrolysates [35].
Furfural and HMF are considered the most potent inhibitors of yeast growth and fermentation [40-42]. These furans inhibit central enzymes, such as pyruvate dehydrogenase, acetaldehyde dehydrogenase, and alcohol dehydrogenase [43]. Moreover, exposure to high levels of furfural may cause cellular membrane, chromatin, and actin damage [44]. The yeast capacity to reduce these compounds appears to play a major role in tolerance to hydrolysates inhibition [42, 45]. A broad set of genes possibly playing a role in tolerance to/reduction of furfural/HMF have been identified (e.g. alcohol dehydrogenase (ADH), aldehyde dehydrogenase (ALD) and pyruvate dehydrogenase genes (PDH) [43, 46]). Furthermore, overexpression of some genes have been proved to be associated with improved growth, fermentation rate and/or ethanol production in the presence of inhibitory concentrations of furfural and/or HMF (Table 1.1) [34, 45, 47-52]. However, the overexpression of some other genes (GND1, RPE1, TKL1, GRE3, ALD4 - that had been described as potential determinants of resistance to these inhibitors), resulted in no benefit in terms of growth, ethanol production or fermentation rate in the presence of furfural/HMF inhibitory concentrations [34, 48, 49].
INTRODUCTION
13
Table 0.1. List of genes, that, when overexpressed, are reported to play a protective role against inhibitory concentrations of furfural and/or HMF.
Gene Cellular function Inhibitor Effect Author
ZWF1 Involved in pentose phosphate pathway and in adaptation to oxidative stress
Furfural and HMF
Improved growth and ethanol production
Gorsich et al. [44]; Park et al.
[48] MSN2 Involved in stress response (including oxidative stress) Furfural fermentation rate and Improved
ethanol production
Sasano et al. [47] ALD6 Aldehyde dehydrogenase required for conversion of acetaldehyde to
acetate
Furfural
and HMF Improved growth and ethanol production Park et al. [48]
ADH6
NADPH-dependent alcohol dehydrogenase; may be involved in
fusel alcohol synthesis or in aldehyde tolerance
HMF Improved growth and ethanol production; reduction of HMF Park et al. [48]; Peterson et al. [45]; Liu et al. [49]; Almeida et al. [50] ADH1 for the reduction of acetaldehyde Alcohol dehydrogenase required
to ethanol HMF Improved ethanol production; reduction of HMF Almeida et al. [50] ARI1 reductase, utilizes aromatic and NADPH-dependent aldehyde
alophatic aldehyde substrates
Furfural
and HMF Improved growth
Liu and Moon [51] GRE2 Involved in stress response (including oxidative stress) HMF Improved growth; reduction of HMF Moon and Liu [52]
Acetic acid is one of the principal yeast inhibitors in lignocellulosic hydrolysates [53]. It inhibits specific growth and significantly increases the lag-phase of yeast and reduces ethanol production [54]. Stress related with the presence of this weak acid affects many pathways, such as fatty acid biosynthesis, alternative electron transport chain, and lactate, formate, and ethanol fermentation pathways [55]. Additionally acetic acid is also capable of inducing apoptosis through TOR pathway in yeast [56]. The HAA1 gene has been described to be essential for the S. cerevisiae response to the presence of acetic acid [1, 2], and its overexpression has been proved to enhance acetic acid tolerance [57].
INTRODUCTION
14
1.3.1. Genes associated with S. cerevisiae tolerance to the simultaneous presence of ethanol, acetic acid, vanillin, furfural and HMF in Wheat Straw Hydrolysate
Even though a large range of genes have already been described to play a role in the yeast tolerance to stress induced by one inhibitor, there are no information in the literature about how the expression of these genes can affect the yeast tolerance to the stresses present during lignocellulosic fermentation (environment with multi-stress induced by different inhibitors).
Among the genes identified as required for tolerance to ethanol, acetic acid, vanillin and furfural, none have been found to provide simultaneous protection to the 4 inhibitors[58]. However, 11 genes have been found that confers resistance to ethanol, acetic acid and vanillin (6 genes: ERG2, ERG24, END3, GCS1, RAV1 and TPS1) or furfural (5 genes: NAT3, PPA1, PRS3, RPB4 and VMA8) (Figure 3, Table 1.2).
Figure 0.3. Comparison of the yeast genes described as determinants of resistance to inhibitory concentrations of ethanol, acetic acid and furfural or vanillin. Adapted from Pereira et al, 2011 [58].
To understand if these 11 genes are able to confer tolerance in the presence of multiple stressors, and not only in the presence of one, fermentations with single deletion mutants were performed in wheat straw hydrolysate (WSH; containing ethanol, acetic acid, vanillin and furfural) [58]. The results showed impaired growth of the Δerg2, Δprs3, Δrpb4 and Δvma8 mutants [58], i.e., from the set of 11 genes mentioned, only ERG2, PRS3, RPB4 and VMA8 were required for yeast growth in WSH. The fermentation profiles of all of the 11 mutants were analysed and, consistently, the Δerg2, Δprs3, Δrpb4 and Δvma8 mutants were the ones with the lowest ethanol production, exhibiting also the lowest fermentation rates [58]. The Δrav1 mutant, which showed no impairment in growth in the hydrolysate and generated the same final concentration of ethanol as the wild type strain, exhibited a significant lower fermentation rate [58]. From the 11 genes identified as required for tolerance to ethanol, acetic acid, vanillin or furfural, only five genes, ERG2, PRS3, RAV1, RPB4 and VMA8, were found to contribute to the fermentation rate and/or to the maintenance of cell viability in WSH [58].
INTRODUCTION
15
Table 0.2. Cellular function of the 11 genes required to provide tolerance to ethanol, acetic acid and vanillin or furfural. The cellular function was obtained from Saccharomyces Genome Database (http://www.yeastgenome.org).
Gene Cellular function
Stressors: Ethanol, acetic acid and vanillin
END3 Protein involved in endocytosis, actin cytoskeletal organization and cell wall morphogenesis ERG2 Sterol isomerase involved in ergosterol biosynthesis
ERG24 Sterol reductase involved in ergosterol biosynthesis
GCS1 ADP-ribosylation factor GTPase activating protein, involved in ER-Golgi transport RAV1 Subunit of the RAVE complex which promotes assembly of the V-ATPase holoenzyme TPS1 Synthase subunit of trehalose-6-phosphate synthase/phosphatase complex necessary for trehalose biosynthesis
Stressors: Ethanol, acetic acid and furfural
NAT3 Catalytic subunit of the NATB N-terminal acetyltransferase involved in protein acetylation PPA1 Proteolipid subunit of the membrane domain of the vacuolar H+-ATPase (V-ATPase)
RPB4 RNA polymerase II subunit
PRS3 5-phospho-ribosyl-1(alpha)-pyrophosphate synthetase required for nucleotide, histidine and tryptophan biosynthesis VMA8 Subunit of peripheral membrane domain of the vacuolar H+-ATPase (V-ATPase)
ERG2 encodes C-8 sterol isomerase, one of the key enzymes involved in ergosterol biosynthesis. The ability to synthesize ergosterol (the major sterol in the plasma membrane of S. cerevisiae) has been reported as an important factor in the ethanol tolerance of yeast cells [59-61] indicating a prominent role of this sterol in stabilizing membrane lipids and proteins against the negative effects of ethanol. Consistently with this fact, a S. cerevisiae strain overexpressing ergosterol biosynthesis genes was found to have higher growth ability under high ethanol concentration than a laboratory yeast strain [62]. Under non-stressful conditions ERG2 overexpression or deletion have no effect on growth rate [63]. Also, during bioethanol production processes, a reduction in the transcript levels of ergosterol biosynthetic genes was reported [64],
INTRODUCTION
16
possibly as a response to the lack of oxygen (this decrease also occurs in winemaking processes [65]). However, studies have shown that overexpression of ERG2 alone has a negative effect on ergosterol biosynthesis [66, 67].
PRS3 encodes 5-phosphoribosyl-1-pyrophosphate synthetase, responsible for the synthesis of 5-phosphoribosyl-1-pyrophosphate (PRPP), which is required for nucleotide, histidine, and tryptophan biosynthesis. Studies have reported that altering the capacity of the yeast cell for synthesizing PRPP (i.e. using ∆prs3 strains) causes the cell to display cell wall damage-related phenotypes and interferes with signaling in the cell integrity pathway, suggesting that PRS3 may have a supporting role in the maintenance of cell integrity [68-70].
RAV1 and VMA8 are both involved in the assembly and function of the vacuolar membrane H+-ATPase (V-ATPase): RAV1 encodes a subunit of the RAVE complex (Rav1p, Rav2p, Skp1p), which promotes assembly of the V-ATPase holoenzyme [71] and VMA8 encodes a subunit of peripheral membrane domain of the vacuolar H+-ATPase (V-ATPase) [72]. This last enzyme plays a crucial role in the maintenance of the internal pH within physiological values, especially under stress conditions that result in intracellular acidification, as is the case of stress caused by acetic acid and ethanol [31, 73]. Therefore V-ATPase was identified as a crucial determinant of resistance to these two stressors [31, 32]. Consistently, ∆rav1 mutants exhibited a substantial reduction in growth on media with low pH value [74], and also a decreased resistance to ethanol [75]. However, overexpression of RAV1 has been described as toxic for the yeast cell [76]. Regarding the VMA8 gene, it has been shown that, under non-stressful conditions, overexpression of this gene results in a diminished growth rate, and its deletion has no effect on growth [63].
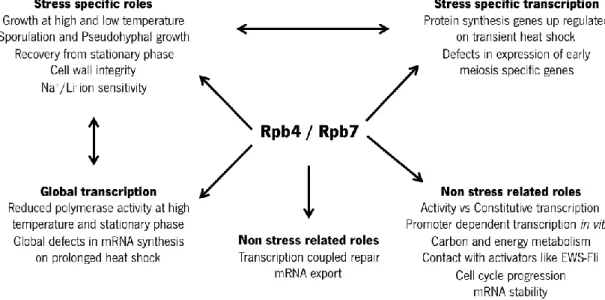
RPB4 encodes a RNA polymerase II subunit, which interacts with the subunit encoded by RPB7 (a smaller essential subunit) forming a subcomplex [77] that plays important roles in stress and non-stress related phenotypes (Figure 2) [78]. Deletion of the RPB4 gene has been found to result in a RNA polymerase II with reduced activity, in impaired growth rate (principally under extreme temperatures) [79-81], and in defective cell wall integrity [82]. It was discovered that this gene plays an important role in the activation of many genes (some of them involved in specific pathways of stress response) [83, 84], and that in its absence, RNA polymerase II cannot transcribe some genes [85]. Farago and collaborators [86] established that RPB4 is required during temperature, starvation or ethanol stresses. However, this gene has no important role in
INTRODUCTION
17
osmotic or oxidative stresses [87]. Furthermore, under stress conditions, RPB4 has been shown to be required for efficient mRNA export to the cytoplasm [86].
Figure 0.4. Roles played by the RPB4/7 sub-complex in stress and non-stress related phenotypes. Reproduced from Sampath and Sadhale, 2005 [78].
Taking into account that single overexpression of ERG2, RAV1 and VMA8 under non-stressful conditions was found to result in a negative effect on ergosterol biosynthesis, toxicity for the yeast cell and in a diminished growth rate, respectively, these genes were not considered as good targets for genetic engineering. Therefore PRS3 and RPB4 genes were selected to be studied, by overexpression and evaluation of their expression levels under inhibitory conditions.
19
MATERIALS AND METHODS
21
2.1. Sterilization of material, solutions and culture media
All the glass material and culture media for bacteria and yeast were sterilized in autoclave at 121 °C during 20 min. Thermolabile solutions were sterilized by filtration with 0.2 µm filters.
2.2. Strains
Microbial strains used during this work are listed in Table 2.1.
Table 0.1. Microbial strains used during this work.
Strain Genotype Source
Escherichia coli TOP10
F– mcrA, Δ(mrr-hsdRMS-mcrBC), Φ80lacZΔM15,ΔlacX74, recA1,
araD139,Δ(ara-leu)7697, galU, galK, rpsL(StrR), endA1, nupG
Invitrogen
E. coli NZ5α
fhuA2Δ(argF-lacZ)U169, phoA, glnV44,Φ80lac ZΔM15, gyrA96,
recA1, relA1, endA1, thi-1, hsdR17
Nzytech
S. cerevisiae CEN.PK113-7D MATα, MAL2-8c,SUC2 INSA, Toulouse, France
S. cerevisiae BY4741
MATa,
his3Δ1, leu2Δ0, met15Δ0, ura3 Δ0
EUROSCARF
S. cerevisiae PE-2
Rosane
Schwan (Federal University of Lavras, Brazil)
MATERIALS AND METHODS
22
2.3. Bacteria and yeast cells storage
Bacteria and yeast cultures were maintained for up to 2 weeks at 4 °C, in the appropriate selective medium, on inverted agar plates sealed with parafilm. For long time storage, permanent stocks were prepared. A culture grown overnight in appropriate selective liquid medium was 10 fold diluted in fresh medium and grown for more 5-6 h. Afterwards, 0.3 ml of sterile glycerol were added to 1 ml of the culture, mixed by vortexing and incubated on ice for 10 min. The tubes were stored at -80 °C. For culture recovery, the frozen cells were scrapped and spread on appropriate agar medium plate. The permanent stock was stored and re-used.
2.4. Media
E. coli transformant strains were grown in liquid Luria-Bertani (LB) medium supplemented with ampicillin to a final concentration of 100 μg/ml (LB-amp). S. cerevisiae strains were grown in liquid Yeast extract Peptone Dextrose (YPD) medium or Synthetic Defined (SD) medium. The transformants selection was made in YPD supplemented with G418 (YPD-G418; to a final concentration of 100 μg/ml in liquid media or 200 μg/ml in solid media) or in Synthetic Defined with Uracil Dropout (SD-Ura) medium. All strains were also grown in the corresponding solid media, obtained by the addition of 2% (w/v) Agar. YPD media was used for aerobic growth (2.18) and, when mentioned, was supplemented with inhibitors: 3.00 g/L of acetic acid, 0.30 g/L of HMF and 1.60 g/L of furfural; or 1.89 g/L of HMF and 2.88 g/L of furfural. Shake-flask fermentation (2.19) was generally performed in EWH, supplemented with 100 g/L glucose (pH 4.5). When using S. cerevisiae BY4741, 3% BYauxo Mix was added to the medium to account for the auxotrophies of this strain. Fermentations were also performed in YPD medium and YPD supplemented with 3.11 g/L of acetic acid, 0.33 g/L of HMF and 1.66 g/L of furfural (2.21). The media and solutions mentioned are described in Appendix 1, Table A1.
2.5. Vectors
Vectors used during this work are listed in Table 2.2. All of these vectors contain CoLE1 origin of replication and f1 origin of replication from f1filamentous phage and the gene that confers resistance to ampicillin.
MATERIALS AND METHODS
23
Vector Description Use Source
pGEM-T Easy
T-overhangs to improve ligation of
PCR products generated by Taq DNA
polymerases; LacZ gene for blue-white
screening
Ligation of PCR
products Promega
pMI516MCS
Kan selection marker under thecontrol on AgTEFpromoter and ScADH1terminator; URA3 marker; 2-micron origin of replication; ScPGK1 promoter and terminator Expression of S.
cerevisiae genes Aguiar [88]
YEplac195
URA3 marker; 2-micron origin of replication; LacZ gene
for blue-white screening Expression of S. cerevisiae genes with native promoters and terminators
Gietz and Sugino [89]
BHUM1737
YEplac195 containing the HAA1 gene under the control of its native
promoter and terminator in YEplac195 Expression of S. cerevisiae HAA1 gene Malcher et al. [90] 2.6. Primers
MATERIALS AND METHODS
24
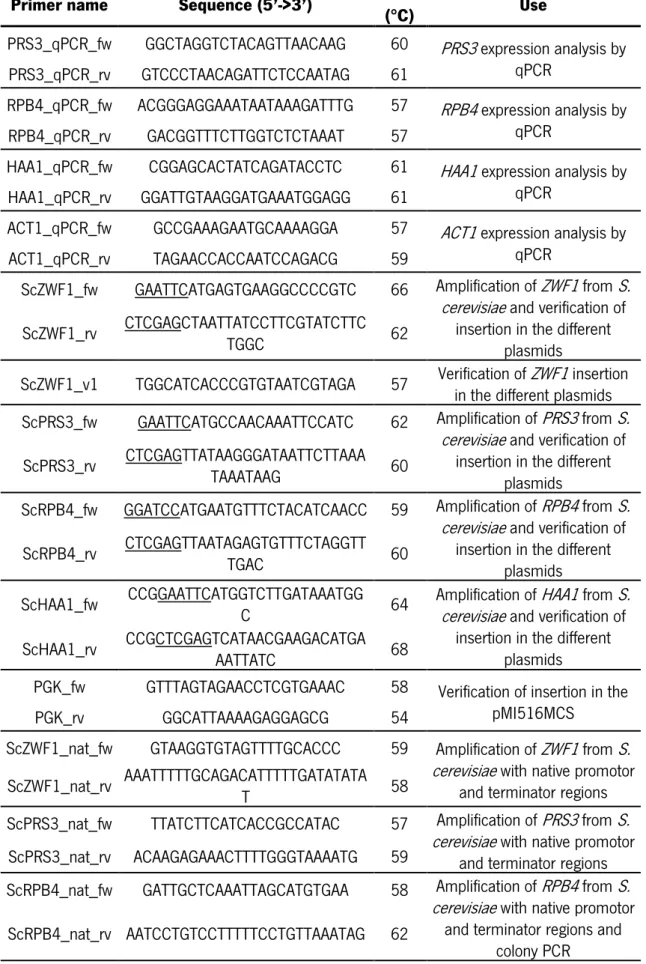
Table 0.3. Primers used during this work. Underlined are the recognition sites of the restriction enzymes used in the cloning procedures.
Primer name Sequence (5’->3’) (°C) Tm Use
PRS3_qPCR_fw GGCTAGGTCTACAGTTAACAAG 60 PRS3 expression analysis by qPCR
PRS3_qPCR_rv GTCCCTAACAGATTCTCCAATAG 61
RPB4_qPCR_fw ACGGGAGGAAATAATAAAGATTTG 57 RPB4 expression analysis by qPCR
RPB4_qPCR_rv GACGGTTTCTTGGTCTCTAAAT 57
HAA1_qPCR_fw CGGAGCACTATCAGATACCTC 61 HAA1 expression analysis by qPCR
HAA1_qPCR_rv GGATTGTAAGGATGAAATGGAGG 61
ACT1_qPCR_fw GCCGAAAGAATGCAAAAGGA 57 ACT1 expression analysis by qPCR
ACT1_qPCR_rv TAGAACCACCAATCCAGACG 59
ScZWF1_fw GAATTCATGAGTGAAGGCCCCGTC 66 Amplification of ZWF1 from S. cerevisiae and verification of
insertion in the different plasmids ScZWF1_rv CTCGAGCTAATTATCCTTCGTATCTTCTGGC 62
ScZWF1_v1 TGGCATCACCCGTGTAATCGTAGA 57 Verification of ZWF1 insertion in the different plasmids ScPRS3_fw GAATTCATGCCAACAAATTCCATC 62 Amplification of PRS3 from S. cerevisiae and verification of
insertion in the different plasmids ScPRS3_rv CTCGAGTTATAAGGGATAATTCTTAAATAAATAAG 60
ScRPB4_fw GGATCCATGAATGTTTCTACATCAACC 59 Amplification of RPB4 from S. cerevisiae and verification of
insertion in the different plasmids ScRPB4_rv CTCGAGTTAATAGAGTGTTTCTAGGTTTGAC 60
ScHAA1_fw CCGGAATTCATGGTCTTGATAAATGGC 64 Amplification of HAA1 from S. cerevisiae and verification of
insertion in the different plasmids ScHAA1_rv CCGCTCGAGTCATAACGAAGACATGAAATTATC 68
PGK_fw GTTTAGTAGAACCTCGTGAAAC 58 Verification of insertion in the pMI516MCS
PGK_rv GGCATTAAAAGAGGAGCG 54
ScZWF1_nat_fw GTAAGGTGTAGTTTTGCACCC 59 Amplification of ZWF1 from S. cerevisiae with native promotor
and terminator regions ScZWF1_nat_rv AAATTTTTGCAGACATTTTTGATATATAT 58
ScPRS3_nat_fw TTATCTTCATCACCGCCATAC 57 Amplification of PRS3 from S. cerevisiae with native promotor
and terminator regions ScPRS3_nat_rv ACAAGAGAAACTTTTGGGTAAAATG 59
ScRPB4_nat_fw GATTGCTCAAATTAGCATGTGAA 58 Amplification of RPB4 from S. cerevisiae with native promotor
and terminator regions and colony PCR
MATERIALS AND METHODS
25
2.7. Plasmid DNA preparation from E. coli strains
Plasmid DNA was extracted from E. coli strains using a rapid plasmid DNA extraction method or alternately, to obtain higher quantities and purity, a commercial kit.
2.7.1. Rapid plasmid DNA extraction
Cells were collected from a fresh LB-amp agar plate, resuspended in 200 µl of Ultra-Pure (UP) H2O and mixed by vortexing. Cellular lysis was obtained by the addition of 200 µl of Solution I followed by 4 times inversion to mix. To neutralize and precipitate cell extracts and other contaminants, 200 µl of the Solution II were added, the tube inverted 4 times to mix and incubated for 5 min on ice. The suspension was centrifuged for 2 min at 13200 rpm. The supernatant was mixed with 500 µl of 100% isopropanol and centrifuged for 2 min. The supernatant was carefully removed and the pellet was air dried and resuspended in 30 µl of UP H2O.
Solution I 1% (w/v) SDS
0.2 M NaOH Solution II 3 M Potassium acetate
11.5% (v/v) Acetic acid
2.7.2. Commercial kit
The GenElute™ Plasmid Miniprep Kit (Sigma-Aldrich) was used according to the manufacturer's protocol. Briefly, cells were collected from a fresh LB-amp agar plate, resuspended in 200 µl of Resuspension Solution and mixed by vortex. Cellular lysis was performed with the addition of 200 µl of Lysis Solution. The sample was gently inverted to mix and allowed to clear for 5 min. Afterwards, 350 µl of Neutralization Solution were added and inverted 4-6 times to mix. The debris were pelleted for 10 min at 13200 rpm. In the meantime, 500 µl of Column Preparation Solution were added to the binding column in a collection tube, spun at 13200 rpm for 1 min and the flow-through discarded. The cleared lysate was transferred into binding column, centrifuged for 1 min and the flow-through discarded. The column was washed with 750 µl of Wash Solution and centrifuged for 1 min. The flow-through was discarded and the column dried by an additional 1 min centrifugation. The column was transferred to a new collection tube and the purified plasmid DNA eluted by addition of 30 µl of Elution Solution followed by 1 min centrifugation.
MATERIALS AND METHODS
26
2.8. Genomic DNA extraction
Genomic DNA was extracted from S. cerevisiae CEN.PK113-7D using the Gentra Genomic DNA Purification Kit (Puregene), according to the manufacturer's protocol. Briefly, a cell suspension (grown overnight and containing approximately 1-2 x 10⁹ cells) was placed on ice and centrifuged at 2000 g for 3 min. The cell pellet was resuspended with 3 ml of Cell Suspension Solution and 15 µl of Lytic Enzyme Solution was added, followed by 25 times inversion to mix. The cell walls were digested by incubation at 37 ⁰C for 30 min followed by centrifugation at 2000 g for 3 min. The cell pellet was resuspended in Cell Lysis Solution and the cells lysed by pipetting. The proteins were precipitated by vigorously vortexing after the addition of 1 ml of Protein Precipitation Solution, followed by centrifugation at 2000 g for 10 min. The supernatant containing the DNA was transferred to a clean tube containing 3 ml of 100% isopropanol. The sample was gently inverted 50 times and centrifuged at 2000 g for 3 min. The DNA, visible as a small white pellet, was washed with 3 ml of 70% ethanol. The ethanol was carefully removed after centrifugation at 2000 g for 1 min and the tube air dried for 15 min. The DNA was rehydrated with 500 µl of DNA Hydration Solution and 15 µl of RNase A solution were added. After mixed, the sample was incubated at 37 °C for 30 min and the hydration was completed by incubation for 1 h at 65 °C, and then overnight at room temperature.
2.9. DNA quantification
Nucleic acid concentration and purity was determined in a NanoDrop 1000 Spectrophotometer (Thermo Scientific) by loading 1.5 µl of sample. The absorbance at 260 nm is used to calculate the concentration, in ng/µl. The sample purity is attained by the ratio of absorbance at 260 nm and 280 nm. A value of ~1.8, for DNA, and 2.0, for RNA, is generally accepted as indicative of pure nucleic acid solution. Lower values may indicate the presence of protein, phenol or other contaminants. A secondary measure of nucleic acid purity is the ratio of absorbance at 260 and 230 nm, which should be in the range of 1.8-2.2 for pure nucleic acid solutions. An appreciably lower ratio may indicate the presence of co-purified contaminants.
2.10. DNA Storage
MATERIALS AND METHODS
27
TE buffer 10 mM Tris/HCl pH 8.0
1 mM EDTA
EB buffer 10 mM Tris/HCl pH 8.5
2.11. Amplification of DNA fragments by Polymerase Chain Reaction (PCR)
DNA amplification by PCR was performed using two different enzymes. Amplification of fragments for subcloning procedures was performed with Phusion High-Fidelity DNA polymerase (Finnzymes), while Taq DNA polymerase (NZYTech) was used for colony PCR.
2.11.1. Amplification with Phusion High-Fidelity DNA polymerase
Genes of interest were amplified by PCR technique with Phusion High Fidelity DNA polymerase (Finnzymes) using the primers listed in Table 2.3. The reaction mixture consisted of 20 µl of 5x Phusion HF buffer, 2.5 µl of 20 µM of each Primer (Table 2.3), 2 µl of 10 mM dNTPs, 2 µl of S. cerevisiae CEN.PK113-7D genomic DNA (2.8), 1 µl of Phusion HF DNA Polymerase and UP H2O to the final volume of 100 µL. The amplification of the genes ZWF1, PRS3 and RPB4 was performed simultaneously, with an initial denaturation step at 98 °C during 1 min, followed by 35 cycles of 10 s denaturation at 98 °C, 30 s annealing at 50 °C and 1 min extension at 72 °C, and with a final extension step of 10 min at 72 °C. The HAA1 amplification was performed with small modifications: the initial denaturation lasted 30 s, the annealing temperature was 59 °C, the extension took 45 s and with the final extension step 5 min. An additional step of 10 min at 72 °C with the addition of 1 µl of NZYTaq DNA Polymerase (NZYTech) was performed, to add A-overhangs on the PCR products, to enable the ligation reaction to the pGEM-T Easy Vector.
2.11.2. Colony PCR
The colony PCR technique was used for the verification of insertion and correct direction of the different genes/fragments of interest into the different plasmids. Using the tip of a sterile toothpick, a small amount of each colony was added to the bottom of a PCR tube. The cells were microwaved for 2 cycles of 45 s at 900 W and immediately placed on ice. A master mix was prepared, per colony, with 2 µl of 10x Reaction buffer, 0.3 µl of 10 mM dNTPs Mix, 0.6 µl of 50 mM MgCl2, 0.3 µl of 20 µM of each Primer (Table 2.3), 0.2 µl of Taq DNA polymerase and UP H2O to the final volume of 20 µL. The master mix was distributed by each tube. The PCR
MATERIALS AND METHODS
28
procedure was performed with an initial denaturation at 95 °C during 5 min, followed by 30 cycles of 30 s denaturation at 95 °C, 30 s annealing at 50 °C and 1 min, per fragment kb, extension at 72 °C, and with a final extension step of 5 min at 72 °C.
2.12. DNA Electrophoresis 2.12.1. Agarose gel
The analysis of DNA fragments was performed by electrophoresis in agarose gels (usually 1%) in horizontal cells. Green Safe Premium (NZYtech) was added to gels for nucleic acid staining. Loading Dye (1x) was mixed with each sample, which allowed the visualization of the running velocity and increased the samples density (making them denser than the running buffer and allowing them to sink into the well). Electrophoretic runs were performed at 70-100 V, in 1x TAE buffer, until the dye migrated as far as 2/3 of the gel length. Gels were visualized and photographed in a Molecular Imager ChemiDocTM XRS + Imaging System (Bio-Rad) and analyzed using the Image Lab 4.0 software.
Agarose gel 1% (w/v) Agarose
0.006% (v/v) Green Safe Premium
50x TAE buffer 2 M Tris-base
50 mM EDTA
pH 8.0 (with acetic acid) 6x Loading Dye 25% (w/v) glycerol
20 mM EDTA
0.25% (w/v) Bromophenol blue
2.12.2. DNA molecular weight marker
The DNA molecular weight marker used in all gels was NZYDNA Ladder III (NZYTech) which produces a pattern of 14 regularly spaced bands, ranging from 200 to 10000 bp (Table 2.4).
MATERIALS AND METHODS
29
Table 0.4. NZYDNA Ladder III bands molecular weight.
Band Size (bp) 1 10000 2 7500 3 6000 4 5000 5 4000 6 3000 7 2500 8 2000 9 1400 10 1000 11 800 12 600 13 400 14 200
2.13. DNA purification of PCR products
PCR products were purified using the QIAquick PCR purification Kit (Qiagen) according to the manufacturer's protocol. Briefly, 5 volumes of buffer PB were added to 1 volume of the PCR reaction. The mixed sample was applied to a QIAquick column, placed on a 2 ml collection tube and centrifuged for 1 min. The flow-through was discarded, the column placed back in the same tube and washed with 750 µl of buffer PE followed by 1 min centrifugation. The flow-through was discarded and the QIAquick column centrifuged once more for 1 min to remove residual wash buffer. The column was placed in a clean 1.5 ml tube and the DNA eluted with 30 µl of buffer EB, which was left to stand in the column for 1 min, before centrifugation for 1 min.
2.14. DNA purification from agarose gel
DNA was recovered from agarose gels using the QIAquick Extraction Gel Kit (Qiagen),
according to the manufacturer's instructions. Briefly, the DNA fragment to be purified was excised from the agarose gel with a clean, sharp scalpel. The gel slice was weighed in a colorless tube and 3 volumes of buffer QG were added to 1 volume of gel (100 mg~100 µl). The tube was incubated at 50 °C for 10 min, and the expected yellow color, after the gel slice complete dissolution, was confirmed. The sample was mixed with 1 gel volume of isopropanol, transferred to a QIAquick column (placed on a 2 ml collection tube) and centrifuged for 1 min. The flow-through was discarded, the QIAquick column placed back in the same tube and washed with 750 µl of buffer PE, followed by 1 min centrifugation. The flow-through was discarded and the