1
Vol.59: e16150116, January-December 2016 http://dx.doi.org/10.1590/1678-4324-2016150116
ISSN 1678-4324 Online Edition
BRAZILIAN ARCHIVES OF BIOLOGY AND TECHNOLOGY A N I N T E R N A T I O N A L J O U R N A L
Antidiabetic Effect of Oleuropein from
Olea europaea
Leaf
against Alloxan Induced Type 1 Diabetic in Rats
Nadir Mustafa Qadir
1, Khabat Anwar Ali
1, Suhailah Wasman Qader
1* 1Department of Biology Collage of Education, Salahaddin University – Hawler, KRG, IraqABSTRACT
This study have been designed to study the effect of extracted pure oleuropein from Oleaeuropaealeaf against alloxan induced type 1 diabetic rats.Diabetic male ratwas induced by injectingsingle subcutaneous injection of 100 mg/kg b.wof alloxan.Respectively, pure oleuropein compound (5, 10, 15 and 20 mg/kg.b.w)was orally administered once per a day during a period of 40 days ofexperiment.Then, the serum blood was collected for the determination of glucose level,haematological analysis, enzymatic and non-enzymatic antioxidant. Further, pancreatic tissue was evaluated for histological examination. Oleuropein showed a significant rolein attenuating the blood glucose levels and elevation of in-vivo antioxidantafter treating diabetic rats with 5 and 10 mg/kg. b.w.The haematologicaltest did not show any significant differences. The histological sections of diabetic rats treated with 5mg/kg/ b.w ofoleuropein showed regularity in size appearance of pancreatic islet with normal distribution of islet cells.Oleuropein as a natural active compound have antioxidant activity to attenuate the effect of alloxan against diabetic disease.Therefore, it can be recommended to use oleuropein as an additive food to cure type 1 diabetic.
Keywords
:
Oleuropein, Type 1 Diabetic, Alloxan, Antioxidant,Blood glucose and HBA1C
1Authors for correspondence: [email protected]
Qader, SW et al.
Braz. Arch. Biol. Technol. v.59: e16150116, Jan/Dec 2016 2
INTRODUCTION
Diabetes mellitus type 1(T1D), known as insulin-dependent diabetes or juvenile diabetes, is a
metabolic disorder that results from
the autoimmune destruction ofβ-cells, the insulin-producer in the pancreas,(1). The subsequent lack of insulin leads to increase blood and urine glucose.In the present study allaoxan,
2,4,5,6-Tetraoxypyrimidine; 2,4,5,6-pyrimidinetetrone,
have been used as diabetogenic substance. It is the most prominent diabetic chemical inducerin animal diabetic research (2). The mechanism of diabetic alloxanhave been reported by Lenzen 2008(3). Briefly, alloxanis affected onpancreatic beta cell via the glucose transporter GLUT2 that causes β-cell toxicity and death through reactive oxygen state, ROS. It will then a state of insulin-dependent diabetes mellitus (T1D)will appear.
Over many years, scientists interested to find out the effect of natural productparticularly phenolic compound for their brilliant biological activity as
antioxidant (4)and anti-inflammatory(5) agents against variety of diseases including diabetes. Olive
tree Oleaeuropaeais documented as a high
antioxidant plant and is considered to be a valuable component in healthy diet all over the world (6) this appreciated healthy diet could be through the composition of phenolic content(7). The main active secondary metabolite in olive leaf extract is oleuropeinas in Fig. 1(8). Studies have reported various pharmacological benefits of oleuropein. It is used as anti-inflammatory agents (9), antioxidant (10), Anti-proliferative and apoptotic on human breast cancer MCF-7 cells(11) and anti- colorectal cancer (12).
In the past decade, various phenolic compounds have been used as immunomodulatoryagentsto suppress autoimmunity against T1D. So far, there is no effective therapeutic researchof oleuropien against T1D. The present study aimed to assess oleuropien as ROS suppresser and β cell protector in alloxan-induced diabetic rats.
Figure 1: Chemical structure of oleuropein
MATERIALS AND METHODS
Experimental Animal
Adult male albino rats Rattus norvegicus were
obtained from animal house of Biology
Department, College of Education, University of Salahaddin. In this study, 48 healthy rats 200-250 g weight were used. Animals were received the humancare according to the criteria outlined in the “Guide for theCareandUseof laboratory Animals” The rats were kept at 25 ± 2°C and 50–60% humidity, with 12 h light/dark cycle.
Diabetic Induction
Alloxan monohydrate (BDH Chemical Ltd. England) was used to induce diabetes as described byAntathan(13).Briefly, animals were injected with single subcutaneous injection of freshly prepared 100 mg /kgbody weightof alloxanin 0.1M citrate
buffer pH = 4.5. The control animals received
citrate buffer only (Nimenibo-Vadia,
2003).Alloxan treated animals were allowed to drink 5% of D-Glucose (Merck KGG , a Darmstadt Germany) overnight to prevent the potentially fatal hypoglycaemia occurring as a result of massive
insulin release following alloxan injection
(Wohaeib and Godin, 1987). Diabetes mellitus was confirmed by testing blood glucose using indicator sticks (Accu-check Roche Diagnostics GmbH, Mannheim, Germany). After 3 days, the diabetes animals were detected based on loss of body
weight, polyuria, glycosuria, polydipsia,
Antidiabetic. 3
Experimental Design
In this experiment, the total of 48 rats (n = 8) were used and they were fed with standard diet and
allowed to drink water ad libitum. The animals were
grouped randomly into six groups as followings: Group I-Normal control: rats of this group received no induction and treatment.
Group II-Diabetic control: diabetic rats of this group received no treatment
Group III- treated diabetic group: diabetic rats of this group received 5 mg/kg of body weight of pure oleuropeincompound.
Group IV- treated diabetic group: diabetic rats of this group received 10 mg/kg of body weight of pure oleuropeincompound.
Group V- treated diabetic group: diabetic rats of this group received 15 mg/kg of body weight of pure oleuropeincompound.
Group VI- treated diabetic group: diabetic rats of this group received 20 mg/kg of body weight of pure oleuropeincompound.
Following 40 days of treatment, prior the fasting the amount of blood glucose was recorded in all experimental groups. Next, all rats were fasted overnight and then the rats were all sacrificed by overdose of ketamine (100 mg/mL) and xylazine (100 mg/mL) in a ratio of 4:1 (v/v) intramuscularly. Blood samples were collected by cardiac puncture for serum biochemical and physiological analysis, the pancreas was taken and preserved in 10%
buffered formalin for histopathological
examination.
Plant preparation
Oleuropein extracted from olive leaves (OL) using steam blanching process at optimum conditions. Briefly, the fresh OL were treated under optimum conditions (10 min steam blanching of 20–21 mm olive leaves fraction). Then, the resultant OL from steam blanched were dried and the amount of 10 g of dried steam blenched were grounded in 80 ml 70% (v/v) ethanol/water at 40 °C for 30 min. Afterward, the extract were stirred at 5000 rpm for 10 min and the pellets were re processed under the same conditions. The extract was then eluted via 0.45-lm syringe filters and chromatographed using reversed-phase HPLC DAD HITACHI equipment coupled to an autosam- pler L-2200, pump L-2130, column oven 2300 and diode array detector L-2455 controlled by Agilent EZChrom Elite software.The column was a Pinnacle II RP C 18 , 3 lm, 150 4.6 mm (Restek), protected by a Kromasil 100 – 5 C 18 guard cartridge starter kit for 3.0 / 4.6
mm id. Column oven was set at 40 ◦C. Eluent (A) and (B) were 0.02 M sodium acetate adjusted at pH 3.2 with acetic acid and pure acetonitrile, respectively. The flow rate was 1 ml/min. The elution gradient profile was as follows: started (A) 90%; 2 min, 85%; 9 min, 75%; 12 min, 65%; 15 min, 55%; 18 min, 40%; 20 min, 90%. The elution was monitored at 280 nm for oleuropein.
Determination of blood glucose and glycosylated haemoglobin (HbA1c)level
Blood samples from all experimental rats were analysedfor glucose level using glucometer (Accu-Chek, Roch diagnostic GmbH, Mannheim,
Germany) (16). Further, Glycosylated
hemoglobinwasdetermined using HbA1c
determination kit (NycoCard® HbA1c - Indea)(17). Briefly, the kit contains test devices with a porous membrane filter and test tubes prefilled with reagent and a washing solution. The reagent contains agents that lyse erythrocytes and precipitate haemoglobin specifically, as well as a blue boronic acid conjugate that binds cis-diols of glacated haemoglobin. When blood is added to the reagent, the erythrocytes immediately lyse and all haemoglobin will precipitate. The boronic acid conjugate binds cis-diolis configuration of glacatedhaemoglobin. Then, aliquot of the reaction mixture is added to the test device and all the precipitated haemoglobin conjugate-bound and un bound remains on top of the filter. The precipitate
wasrecorded by measuring the blue
(glaciatedhaemoglobin) and the red (total
haemoglobin) color intensity by usingNycoCard® READER II.The ratio between them is proportional to the percentage of HbA1c in the sample.
Haematological analysis
Complete blood counts of all blood samples were carried out at Erbil Medical laboratory. The blood parameters were included total white blood cell, red blood cell, haemoglobin, platelet and packed cell volume. The coulter counter measurement has been used (Sysmx K- 1000), TOA Medical Electronics Co., LTD. KOBEW. JAPAN(18).
Determination of reduced glutathione (GSH)
Following the methods described by Al-Zamely et
al, 2001, Ellman's reagent has been used for the
Qader, SW et al.
Braz. Arch. Biol. Technol. v.59: e16150116, Jan/Dec 2016 4
of bis 2-nirtrobenzoic acid. 5-5 dithio (DTNB) in 100 ml of buffer at pH 7.4 was added to 150 µL of supernatant which has been obtained from centrifugation. The mixture allowed for 5 min at room temperature and then the absorbance was measured at 412 nm spectrophotometrically. The GSH concentration was calculated based on the following calculation:
GSH concentration(µmol/L) =
E0: Extinction coefficient= 13600 M-1 cm -1 L = light bath 1cm
Determination of plasma vitamin E (α -tocopherol)
Plasma vitamin E was measured depending on colorimetric method using Emmeric Engel reaction as described by(19). This method was applied based on the reduction by tocopherols of ferric to ferrous ions, which then form a red complex with α,α’ – dipyridyl. Tocopherols and carotenes are then extracted into xylene and the extinction read to 460nm to measure the carotenes. A correction is made for these after adding ferric chloride and reading at 520nm. The concentration of vitamin E was estimated using the following equation:
Tocopherol (mg/L) =
×conc. of standard (10 mg/L)
Histological examination of Pancras
At the end of 40 days of experiment, all animals were dissected then thepancreatic tissues were washed and fixed in10% formalin fixative solution.
Subsequently, the tissue were processed
(Dehydrated, Cleaned and then Infiltrated) automatically using Automated Tissue Processing Leica (TP1020). Then, the tissues were embedded
in paraffin wax using Leica HISTOEMBEDDER. The embedded tissues were sectioned with microtome to produce 5 μm paraffin wax tissue sections. The sections were stained with Haematoxylin & Eosin followed by mounting with DPX mounting media. Next, the mounted sections were evaluated for microscopic examination using light microscope (AmScoop microscope eyepiece camera. China) (20).
Statistical analysis
All the data were analyzed by Statistical Package Social Science (SPSS) version 20.0. Duncan post Hoc test was used to show the mean differences between all samples at p<0.05. Microsoft Excel 2010 was used to illustrate the graphs.
RESULTS
Estimation of serum glucose and glycosylated haemoglobin (HbA1c) level
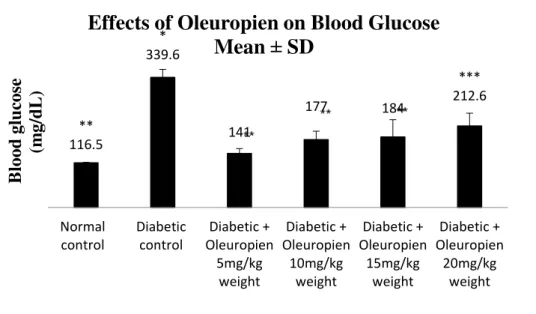
The results of this study illustrated the effects of oleuropein on serum glucose level in experimental animals treated for 40 days. As shown in Figure 1, the mean ± SD of serum glucose levels of normal control rats is about 116.5±1.603mg/dLwhile the mean ± SD of serum glucose levels of diabetic controlrats is about 339.6 ± 21.345 mg/dL. Rats treated with oleuropein significantly p<0.05 showed decreasing in the serum glucose levels. After treating diabetic rats with 5 mg/kg of oleuropein, the serum glucose levels was decreased about 141± 12.751 mg/dLas in Figure 2. The significantly differences p<0.05 has been also illustrated after administration 10 mg/kg and 15 mg/kg of oleuropein (177 ± 22.33 mg/dLand 184 ± 45.118 mg/dL) respectively as compared with diabetic control rats as in Figure 2. Although, the mean ± SD (212.6 ± 33.553 mg/dL) of rats treated with 20 mg/kg of oleuropein did not show significantly differences p<0.05 with the serum glucose levels of diabetic control rats. It’s shown from Figure 2 to be more close to the serum glucose levels of diabetic control rats.
A.
test–
A.
blankL
×
E
0×
10
6A
testat 520 nm- A
testat 460 nm × 0.29
Qader, SW et al. 5
Figure 2: Effects of oleuropein on serum glucose levels in experimental animals for 40 days. Data are presented as mean ± SD (n = 8). P <0.05 are represented as statistically significant different. * p<0.05 significant differences as compared with normal control, **p<0.05 significant differences as compared with diabetic control and ***p<0.05 significant differences as compared with normal control and diabetic control.
Further confirmation has been detected regarding the glucose level by using HbA1c determination kit. The percentage of serum Hba1C of all experimental animals has been illustrated in Figure 3. The mean ± SD of serum HbA1c % of normal control rats is about 4.45 ± 0.61% while the mean ± SD of serum HbA1c % of diabetic control rats is about 7.87 ± 0.8 %. Rats treated with oleuropein significantly p<0.05showed decreasing in the serum HbA1c%.
Same as in the previous test, the diabetic rats treated with 5 mg/kg and 10 mg/kg of oleuropeinare caused decreasing in the serum HbA1c% about 5.43 ± 0.51%and 5.63 ± 0.85% respectively in comparison with diabetic control rats. While diabetic rats
treated with 15 mg/kg and 20 mg/kg
oleuropeinwere not show any significantly differences p<0.05 with the serum HbA1c% of diabetic control rats.
Figure3: Effects of oleuropein on serum Hba1C% in experimental animals for 40 days. Data are presented as mean ± SD (n = 8). P<0.05 are represented as statistical significant different. * P<0.05 significant differences as compared with normal control, **p<0.05 significant differences as compared with diabetic control and ***p<0.05 significant differences as compared with normal control and diabetic control.
** 116.5
* 339.6
141
177 184
*** 212.6
Normal control
Diabetic control
Diabetic + Oleuropien
5mg/kg weight
Diabetic + Oleuropien
10mg/kg weight
Diabetic + Oleuropien
15mg/kg weight
Diabetic + Oleuropien
20mg/kg weight
B
lood
glu
cose
(m
g/d
L
)
Effects of Oleuropien on Blood Glucose
Mean
±
SD
** 4.45
* 7.87
** 5.43
** 5.63
*** 6.13
*** 6.63
Normal control
Diabetic control
Diabetic + Oleuropien
5mg/kg weight
Diabetic + Oleuropien
10mg/kg weight
Diabetic + Oleuropien
15mg/kg weight
Diabetic + Oleuropien
20mg/kg weight
Hb
a1C %
Qader, SW et al.
Braz. Arch. Biol. Technol. v.59: e16150116, Jan/Dec 2016 6
Determination of haematological analysis
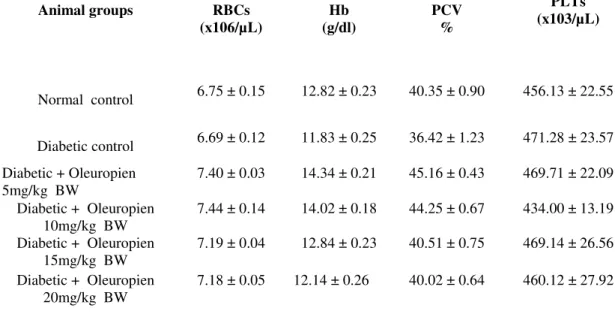
The plasma haematological data as in Table 1, including RBCs, Hb, PCV and PLTs, of all experimental rats did not show any statistical
differences p<0.05 between all the groups in thepresent work. That means neither alloxan nor oleuropien did not affect in this experiment.
Table 1: Effects of oleuropein on hematological analysis including (RBCs, Hb, PCV and PLTs) in plasma of all experimental rats. Data are presented as mean ± SD (n = 8). P <0.05 are represented as significant.
RBCs: red blood cells, Hb: hemoglobin, PCV: Packed cell volume, PLTs: Platelets Count
Determination of reduced glutathione (GSH)
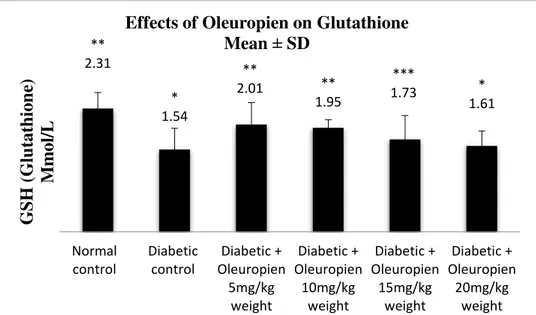
Reduced glutathione have been charted in Figure4. The data presented that mean ± SD of serum GSH in normal control is about 2.31 ± 0.3Mmol/Lwhile mean ± SD of serum GSH in diabetic control rat is about 1.54 ± 0.4. Rats treated with 5 and 10 mg/kg of oleuropien significantly p<0.05 showed elevation of serum GSH about 2.01±0.41and 1.95± 0.15 respectively in comparison with serum GSH in diabetic control. Rats treated with 15 mg/kg of oleuropien did not show any significantly differences p<0.05 with normal control and diabetic
control rat. While, rats treated with 20 mg/kg of oleuropiendid not show any statistical significant p<0.05 elevation in serum GSH.
Both normal rats and oleuropein-treated diabetic with 5 and 10 mg/kg showed a constant augmentation in the serum GSH levels and serum glucose levels. Further, the negative correlation coefficient (R2 = -0.83) have been observed between serum GSH and serum glucose. Meaning that increasing in the serum glucose is lowering the antioxidant ability and vice versa.
Animal groups RBCs (x106/µL)
Hb (g/dl)
PCV %
PLTs (x103/µL)
Normal control 6.75 ± 0.15 12.82 ± 0.23 40.35 ± 0.90 456.13 ± 22.55
Diabetic control 6.69 ± 0.12 11.83 ± 0.25 36.42 ± 1.23 471.28 ± 23.57
Diabetic + Oleuropien 5mg/kg BW
7.40 ± 0.03 14.34 ± 0.21 45.16 ± 0.43 469.71 ± 22.09
Diabetic + Oleuropien 10mg/kg BW
7.44 ± 0.14 14.02 ± 0.18 44.25 ± 0.67 434.00 ± 13.19
Diabetic + Oleuropien 15mg/kg BW
7.19 ± 0.04 12.84 ± 0.23 40.51 ± 0.75 469.14 ± 26.56
Diabetic + Oleuropien 20mg/kg BW
Qader, SW et al. 7
Figure 4: Effects of oleuropein on serum GSH (Glutathione) Mmol/L in experimental animals for 40 days. Data are presented as mean ± SD (n = 8). p<0.05 are represented as statistical significant different. * p<0.05 significant differences as compared with normal control, **p<0.05 significant differences as compared with diabetic control and ***p<0.05 significant differences as compared with normal control and diabetic control.
Determination of serum vitamin E (α -tocopherol)
Serum vitamin E mg/dl has been illustrated in Figure 5. It has shown that mean ± SD of normal control rats is about 1.01 ± 0.1 mg/dl while the mean ± SD of untreated diabetic rats (diabetic control rats) is about 0.5 ± 0.1 mg/dl. In comparison with diabetic control rats, diabetic rats treated with 5 and 10 mg/kg of oleuropien significantly p<0.05 showed increasing of serum vitamin E 0.96 ± 0.2
and 0.83 ± 0.24 mg/dl respectively. Although, diabetic rats treated with 15 mg/kg of oleuropien did not show significantly differences p<0.05 with normal control and diabetic control rats. The diabetic rats treated with 20 mg/kg of oleuropein did not show any elevation of serum vitamin E 0. 63 ± 0.23 mg/dl and the data is not significantly differences p<0.05 with diabetic control rats.
Figure5: Effects of oleuropein on serum vitamin E mg/dlin experimental animals for 40 days. Data are presented as mean ± SD (n = 8). P <0.05 are represented as statistical significant different. * p<0.05 significant differences as compared with normal control, **p<0.05 significant differences as compared with diabetic control and ***p<0.05 significant differences as compared with normal control and diabetic control.
** 2.31
* 1.54
**
2.01 **
1.95
***
1.73 *
1.61
Normal control
Diabetic control
Diabetic + Oleuropien
5mg/kg weight
Diabetic + Oleuropien
10mg/kg weight
Diabetic + Oleuropien
15mg/kg weight
Diabetic + Oleuropien
20mg/kg weight
G
S
H (G
lu
tat
h
ion
e)
M
m
ol/
L
Effects of Oleuropien on Glutathione
Mean
±
SD
** 1.01
* 0.5
** 0.96
**
0.83 ***
0.77 *
0.63
Normal control
Diabetic control
Diabetic + Oleuropien
5mg/kg weight
Diabetic + Oleuropien
10mg/kg weight
Diabetic + Oleuropien
15mg/kg weight
Diabetic + Oleuropien
20mg/kg weight
Vi
tam
in
E
m
g
/d
l
Qader, SW et al.
Braz. Arch. Biol. Technol. v.59: e16150116, Jan/Dec 2016 8
Histological Examination of Pancras
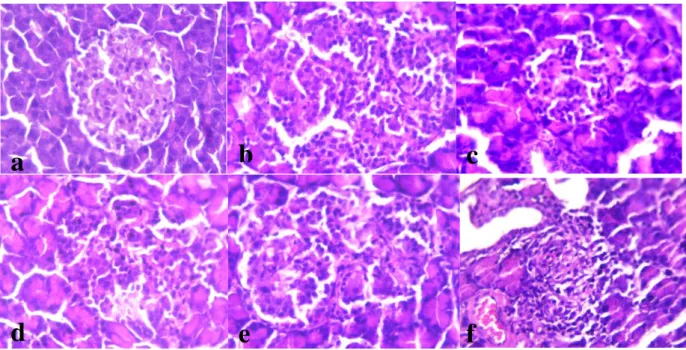
The pancreas tissue from normal group rats,after receiving standard diet with distilled water, were showed normal pattern of pancreatic islet with normal distribution of islet cells as shown in Figure 6a. Pancreas with diabetic control,after injecting 100 mg/kgbwshowed expansion and dilatation of pancreatic islet with irregular distribution of islet cells as in Figure 6b. Diabetic rats treated with
5mg/kg bwoleuropein showed regularity
appearance of islet with normal distribution of islet cells Figure 6c. Treating diabetic rats with 10 mg/kg bw of oleuropeinshowed mild expansion of
pancreatic islet with less haemorrhaged associated with accumulation of zymogene granule in aciniFigure 6d. Expansion of pancreatic islet with prominent hyperplastic islet cells have been seen after treating diabetic rats with 15 mg/kg bwoleuropienas in Figure 6e. Diabetic rats treated with 20 mg/kg bwoleuropein showed irregular patent and prominent hyperplastic of islet cells
associated with lymphatic infiltration and
appearance of vacuoles (H&E 400X).
Figure 6: Photomicrograph of normal architecture, regular in shape and size of pancreatic islet cells (a);alloxan diabetic rats with 100 mg/kg bw (b); treated diabetic rats with5 mg/kg bw ofoleurpoien(c);10 mg/kg bw of oleuropein treated diabetic rat (d); diabetic rats treated with15mg/kg bwof oleuropien (e) and diabetic rats treated with 20mg/kg bw of oleuropein(f) (H&E 400X).
DISCUSSION
Type one diabetic is one of the diseases that correlated with oxidative stress positively. Variety disorders have been reported based on the formation of free radicals in T1D such as
nephropathy, retinopathy, nephropathy and
vascular disorders(13). Further, hyperglycemia manifested to be appeared with the elevation of free radicals in the body(20). In another hand, dietary and supplementary antioxidant are able to decrease the complications accompanied with oxidative stress in T1D(21).
In the present work, alloxan have been used to induce diabetic rats andoleuropein to eliminate the
complications associated with diabetic disorder. Obviously, elevation of glucose levels have been observed in diabetic control rats in comparison with normal control rats in this experiment. This is in agreement with the previous study reported by Khaled Hamden 2009 (22) and (3). The mechanism behind this elevation explained to bethrough the inhibition of insulin secretion and damage to βcells(23). While after treating diabetic rats with oleuropeinparticularly 5mg/kg and 10 mg/kg,the decreasing in the serum glucose levels have been determined.
Further, the negative correlation has been also detected between serum glucose levels with that in serum enzymatic and non-enzymatic antioxidant.
b
a
f
c
Antidiabetic. 9
Previously, oleuropein have been reported as a
good antioxidant in vitro through chelating of Cu
and Fe metallic ions which then catalyse free
radical formation(24)(25)and in vivo through the
inhibition of enzymatic oxidation such as lipoxygenases(10). In agreement with the present experiment, a significant increasing in the serum GSH has shown after treating diabetic rats with 5mg/kg and 10mg/kg of oleuropein. Previous experiment has been observed that GSH capable to prevent the diabetic when it has injected together withalloxan in rats (3). That means GSH is able to decrease the generation of free radicals, formed from alloxan, in the body and then positively protecting the β cell from any destruction(3). Moreover, non-enzymatic antioxidant elevation also has been observed in the present study after treating diabetic rats with5mg/kg and 10mg/kg of
oleuropein. Vitamin Eor α-tocopherol as an
essential antioxidant has been proved to be depressed when glucose level is increased in the body(26). The same results been detected in this study, it has been shown a negative correlation between serum glucose level and serum vitamin E levels of diabetic rats treated with oleuropein. Meaning that oleuropein is able to decrease glucose level and increasing the antioxidant capability. However, oleuropein have also been assessed for haematological analysis there is no any significant changes been detected in this study as presented in Table 1.
Further confirmation has been shown through pancreatic micrographs regarding the protection role of oleuropein as being presented in Figure 6.The damage and irregular distribution of β cells has been observed in diabetic control.While normal appearance and regeneration of β cells been observed in diabetic rats treated with 5mg/kg and 10 mg/kg bwof oleuropein.This protection could be related to the elimination of pancreatic toxicity through the inhibition of free radical activities. As in the previous paragraph, it has been explained that oleuropein is able to scavenge oxidative stress of alloxan diabetic induction. Studyrevealed that regeneration of β cells and reactivation of insulin secretion after treating diabetic rats with phenolic compound could be due to the possibility that some islet β cells are able to be reactivated by phenolic compound to labour its insulin secretion(27).
5. CONCLUSIONS
Eventually, this study proved that oleuropein is a significant hypoglycemic and antioxidant active
compound. This significant role is could be through the antioxidant activity of oleuropein by attenuatingfree radical effect of allaoxan. As well as, the reactivating of β cell and raising the enzymatic and non-enzymatic antioxidant. So that, further study is needed to confirm that oleuropein is a good natural active compound for T1D therapy upon human.
AKNOWLEDGMENTS
We are glad to thanks Biology Department, College of Education, Salahuddin University, Erbil, Iraq for the financial support.
CONFLICT OF INTEREST
No conflict in this work.
REFERENS
1. Hamden K, Allouche N, Damak M, Elfeki A. Hypoglycemic and antioxidant effects of phenolic extracts and purified hydroxytyrosol from olive mill waste in vitro and in rats. Chemico-biological interactions. 2009;180(3):421-32.
2. Shaw Dunn J, McLetchie N. Experimental alloxan diabetes in the rat. The Lancet. 1943;242(6265):384-7.
3. Lenzen S. The mechanisms of alloxan-and streptozotocin-induced diabetes. Diabetologia. 2008;51(2):216-26.
4. Qader SW, Abdulla MA, Chua LS, Najim N, Zain MM, Hamdan S. Antioxidant, total phenolic content and cytotoxicity evaluation of selected Malaysian plants. Molecules. 2011;16(4):3433-43. 5. Schinella G, Tournier H, Prieto J, De
Buschiazzo PM, Rıos J. Antioxidant activity of anti
-inflammatory plant extracts. Life sciences. 2002;70(9):1023-33.
6. Visioli F, Poli A, Gall C. Antioxidant and other biological activities of phenols from olives and olive oil. Medicinal research reviews. 2002;22(1):65-75.
7. El SN, Karakaya S. Olive tree (Olea europaea) leaves: potential beneficial effects on human health. Nutrition reviews. 2009;67(11):632-8.
8. Al-Aboudi A, Afifi FU. Plants used for the treatment of diabetes in Jordan: a review of scientific evidence. Pharmaceutical biology. 2011;49(3):221-39. 9. Somova L, Shode F, Mipando M. Cardiotonic and antidysrhythmic effects of oleanolic and ursolic acids, methyl maslinate and uvaol. Phytomedicine. 2004;11(2):121-9.
Qader, SW et al.
Braz. Arch. Biol. Technol. v.59: e16150116, Jan/Dec 2016 10
11. Han J, Talorete TP, Yamada P, Isoda H. Anti-proliferative and apoptotic effects of oleuropein and hydroxytyrosol on human breast cancer MCF-7 cells. Cytotechnology. 2009;59(1):45-53.
12. Hashim YZ, Eng M, Gill CI, McGlynn H, Rowland IR. Components of olive oil and chemoprevention of colorectal cancer. Nutrition reviews. 2005;63(11):374-86.
13. Ananthan R, Latha M, Ramkumar KM, Pari L, Baskar C, Narmatha Bai V. Modulatory effects of Gymnema montanum leaf extract on alloxan-induced oxidative stress in Wistar rats. Nutrition. 2004 Mar;20(3):280-5. PubMed PMID: 14990269.
14. Ganong WF. Endocrine functions of the pancreas and regulation of carbohydrate metabolism. Review of medical physiology. 2001;22:336-55. 15. Lee C-W, Lee H-S, Cha Y-J, Joo W-H, Kang D-O, Moon J-Y. In vivo Investigation of anti-diabetic properties of ripe onion juice in normal and streptozotocin-induced diabetic rats. Preventive nutrition and food science. 2013;18(3):169.
16. Syiem D, Syngai G, Khup PZ, Khongwir BS, Kharbuli B, Kayang H. Hypoglycemic effects of Potentilla fulgens L in normal and alloxan-induced diabetic mice. Journal of ethnopharmacology. 2002 Nov;83(1-2):55-61. PubMed PMID: 12413707.
17. Ambler J, Janik B, Walker G. Measurement of glycosylated hemoglobin on cellulose acetate membranes by mobile affinity electrophoresis. Clin. Chem. 1983;29(2):340-3.
18. Kang SH, Kim H, Ham C, Lee D, Cho HI. Comparison of four hematology analyzers, CELL‐DYN Sapphire, ADVIA 120, Coulter LH 750, and Sysmex XE‐2100, in terms of clinical usefulness. International journal of laboratory hematology. 2008;30(6):480-6. 19. Varley H, Gowenlock AH, Bell M. Practical clinical biochemistry, vol. 1. William and Helnemann Med. Books Ltd., London, UK. 1980.
20. Ceriello A. Oxidative stress and glycemic regulation. Metabolism. 2000;49(2):27-9.
21. Osawa T, Kato Y. Protective role of antioxidative food factors in oxidative stress caused by hyperglycemia. Annals of the New York Academy of Sciences. 2005;1043(1):440-51.
22. Hamden K, Jaouadi B, Carreau S, Aouidet A,
Elfeki A. Therapeutic effects of soy isoflavones on α
-amylase activity, insulin deficiency, liver–kidney function and metabolic disorders in diabetic rats. Natural product research. 2011;25(3):244-55.
23. Lenzen S, Panten U. Alloxan: history and mechanism of action. Diabetologia. 1988;31(6):337-42. 24. Andrikopoulos NK, Kaliora AC, Assimopoulou AN, Papageorgiou VP. Inhibitory activity of minor polyphenolic and nonpolyphenolic constituents of olive oil against in vitro low-density lipoprotein oxidation. Journal of medicinal food. 2002;5(1):1-7.
25. Gordon MH, Paiva-Martins F, Almeida M. Antioxidant activity of hydroxytyrosol acetate compared with that of other olive oil polyphenols. Journal of Agricultural and Food Chemistry. 2001;49(5):2480-5. 26. Jennings P, McLaren M, Scott N, Saniabadi A, Belch J. The relationship of oxidative stress to thrombotic tendency in type 1 diabetic patients with retinopathy. Diabetic Medicine. 1991;8(9):860-5. 27. Lapidot T, Walker MD, Kanner J. Antioxidant and prooxidant effects of phenolics on pancreatic β-cells in vitro. Journal of agricultural and food chemistry. 2002;50(25):7220-5.