SAVIAN, T. V. et al.
1184
DEGRADABILITY STUDY OF NEUTRAL DETERGENT FIBER OF COAST
CROSS
(Cynodon dactylon x Cynodon nlemfunensis)
1Estudo da degradabilidade da fibra em detergente neutro do Coast Cross
(Cynodon dactylon x Cynodon nlemfunensis)
Taciana Villela Savian2, Joel Augusto Muniz3, Luiz Henrique de Aquino4, Vera Lúcia Banys5, Daniel Furtado Ferreira6
ABSTRACT
The objective of this work was to fit the degradation model proposed by Orskov & McDonald (1979) to data of an in situ
degradability trial.Neutral detergent fiber degradations (NDF) of coast cross grass (Cynodon dactylon x Cynodon nlemfunensis) were
submitted to twelve cutting ages (30, 60, 90, 120, 150, 180, 210, 240, 270, 300, 330 and 360 days) in a complete block design. At each cutting age, NDF degradation was investigated using nine incubation times (0, 3, 6, 12, 24, 48, 72, 96 and 120 hours) in a split-plot design, taking cutting age as main plots and incubation time as subplots. Each plot comprised a non-lactating cow with a permanent ruminal fistula. Variances of the parameter estimates were also obtained, as well as expressions for the estimation of confidence intervals for parameters in the model. A good fit of the model to the data of neutral detergent fiber degradability in the most cutting ages was found. The cutting ages of the coast cross grass influenced the degradability of different fractions, benefiting early stages. In advanced cutting ages the parameters estimates were less precise.
Index terms: Coast cross, degradability model, fitting quality, non-linear regression.
RESUMO
Objetivou-se com este trabalho ajustar o modelo de degradação proposto por Orskov & McDonald (1979) aos dados de um experimento de degradabilidade in situ. Foi avaliada a degradação da fibra em detergente neutro (FDN) da gramínea Coast Cross
(Cynodon dactylon x Cynodon nlemfunensis) submetida a doze idades de corte (30, 60, 90, 120, 150, 180, 210, 240, 270, 300, 330 e
360 dias) em um delineamento em blocos casualizados. Em cada idade de corte a degradação da FDN foi avaliada em nove tempos de incubação (0, 3, 6, 12, 24, 48, 72, 96 e 120 horas) em um esquema de parcela subdividida, com as idades de corte na parcela e os tempos de incubação na subparcela. Cada parcela foi constituída por uma vaca não-lactante com fístula ruminal permanente. O ajuste do modelo foi avaliado através da interpretação biológica dos parâmetros, coeficiente de determinação, quadrado médio do resíduo e teste de aderência (lack of fit). As variâncias dos estimadores dos parâmetros também foram obtidas por meio da matriz de covariância dos parâmetros fornecendo expressões para estimação do intervalo de confiança dos parâmetros do modelo. O modelo se ajustou bem aos dados de degradabilidade da fibra em detergente neutro na maioria das idades de corte. As idades de corte da gramínea Coast Cross
influenciaram a degradabilidade das diferentes frações, favorecendo os cortes mais precoces. Nas idades de corte avançadas as estimativas dos parâmetros foram menos precisas.
Termos para indexação: Modelo de degradabilidade, qualidade de ajuste, regressão não-linear, Coast Cross.
(Received in september 22, 2004 and approved in june 6, 2006)
1Trabalho conduzido com o apoio do CNPq.
2 Zootecnista, Mestre em Agronomia (Estatística e Experimentação Agropecuária) Departamento de Ciências Exatas/DEX Universidade Federal
de Lavras/UFLA Cx. P. 3037 37200-000 Lavras, MG [email protected]
3Engenheiro Agrônomo, Dr., Professor Titular do Departamento de Ciências Exatas/DEX da Universidade Federal de Lavras/UFLA Cx. P. 3037
37200-000 Lavras, MG [email protected]
4Engenheiro agrônomo, M.Sc., Professor Titular do Departamento de Ciências Exatas/DEX da Universidade Federal de Lavras/UFLA Cx. P. 3037
37200-000 Lavras, MG [email protected]
5Zootecnista, Dr., Universidade Federal de Goiás Campus Avançado de Jataí Centro de Ciências Agrárias e Biológicas Cx. P. 03 75800-000
INTRODUCTION
The great digestive capacity of ruminants enables them to convert roughage into products useful to human populations, due to to their digestive tract highly specialized for cellulose digestion. The carbohydrate is the most important nutrient in the ruminant diet and jointly the lignin and hemicellulose, it composes the neutral
detergent fiber (NDF). The major final products of the metabolism of these carbohydrates are the volatile fatty acids that are absorbed and supply most of the energy demand of the animals.
the cellulose of a young grass and less than 60% in mature grass.
The adequate formulation of rations for these animals comprises the use of feeds which, maximize the fermentation in the rumen, by using the great capacity of these animals in degrading complex carbohydrates as well as reduce the losses due to fermentation of high quality feeds.
For a long time, the feeding of the ruminants was inadequate and just considered the quantity and not the quality of the feeds. Now, the characterization of feeds according to their chemical composition and constitution of their different degradable fractions in the rumen is the great objective of nutritionists to obtain success in ration balancing which provide nutrients for growth and development of rumen microorganisms and the animal. So,
in vivo, in vitro and in situ techniques have been utilized
to determine the use of the different fractions of dietary carbohydrates and proteins.
Use of in situ techniques traces back to the 1930 s,
when Quinn et al. (1938) investigated feed digestion in fistulated sheeps. The in situ technique is also called nylon
bag, dracon, in bag or in situ degradability technique, has
been adopted by the AFRC (1992) as a standard method for characterization of ruminal degradability of nitrogen compounds, and to describe the characteristics of the degradation of the fractions of dietary fiber (AERTS et al., 1997) and protein (CRAWFORD et al., 1978; POOS-FLOYD et al., 1985). Utilization of the in situ degradability technique
has the advantage of providing a fast and simple estimate of the degradation of nutrients in the rumen, in addition to allowing its accompanying along time. (MEHREZ & ORSKOV, 1997). Nutrient degradability in the rumen, is reported by non-linear models, presenting some difficulties in the process of estimating the parameters.
Sampaio (1997) considered that one of the manners of enhancing the efficiency of a model is the choice of an experimental design, which promotes a better estimate of the parameters in the model. This means that the obtained estimates would have smaller variances than estimated values in other designs. To the author, if the objective of the study is both the evaluation and comparison of different forages, a greater reliability upon the estimates of the parameters becomes essential.
Hoffmann & Vieira (1998) considered in the lack of fit test, given by the ratio of the mean square of the combined error and the mean square of the deviation of regression, multiplied by the number of replication, in the cases in which significance is reached, that the model in
issue is not appropriate and that the mean square of the deviation of regression o (MSDR) does not estimate correctly the residual variance, because it would be including a systematic error due to the use of a improper model.
The objective of this work is evaluate in situ
degradability of neutral detergent fiber degradation fraction of coast cross grass (Cynodon dactylon x Cynodon
nlemfunensis), by biological interpretation and by quality
adjustment estimates.
MATERIAL AND METHODS
In the experiment, the coast cross grass (Cynodon
dactylon x Cynodon nlemfunensis), was submitted to
twelve cutting ages (30, 60, 90, 120, 150, 180, 210, 240, 270, 300, 330 and 360 days), in a block design. The experimental unit consisted of a non lactating cow, provided with a ruminal fistula and the grass, at each cutting age, was evaluated in nine incubation times (0, 3, 6, 12, 24, 48, 72, 96 and 120 hours). Original data was published by Reis (2000).
The statistical model was the following:
ijk i j ij k jk ik ijk
y E
constant associated with each observation; i the effect of cutting age i, with i =1,...,12;
jthe effect of block (animal) j, with j =1, 2, 3;
ijthe effect of the interaction of the i-th cutting age with the j-th animal, considering as error (a), with a normal distribution of mean zero and variance a2;
kthe effect of incubation time k, with k =1,..., 9; jkthe effect of the interaction of the k-th incubation time with then j-th animal, regarded as error (b), with a normal distribution of mean zero and variance 2
b;
ikthe effect of the interaction of the k-th incubation time with the i-th cutting age;
ijk
E
error(c), with a normal distribution of mean zero and variance 2.SAVIAN, T. V. et al. 1186
of the data in the different times (GILL, 1987; RIBOLDI et al., 1996).
To verify the homogeneity of variances between times, nine analyses of variances were performed, one to each incubation time, enabling the calculation of Hartley s maximum F obtained by the quotient between the greatest and the smallest mean square error, where the non-significance shows that there is no heterogeneity of variances. The normality of errors was verified by Shapiro-Wilk test using PROC UNIVARIATE of the Statistical Analysis System software (SAS INSTITUTE, 1995).
The values of degradability of neutral detergent fiber were obtained for each bag incubated in the rumen, corresponding to its incubation time, through the expression: D=((A-B)x100)/B where D is the degradability
of the nutrient component, A is the initial percentage of the
component in the sample to be incubated and B the final
percentage of the component after sample incubation. The data were analyzed by the statistical program SISVAR (FERREIRA, 2000).
The model used to describe the degradability of feeds relative to time was that of Orskov & McDonald (1979) given by Y = a+b (1- e ct), being Y the a accumulated
degradability of the nutritional component, after an incubation time t; a the soluble fraction of the nutritive
component analyzed, b the potentially degradable
insoluble fraction of the nutritive component analyzed and
c the rate of degradation of fraction b.
In studies of growth of animals and plants as well as in studies of nutrient degradation over time, by non-linear models, the estimation process demands preliminary estimates (initial values) usually arbitrarily ascribed by the researcher. The iterative process of estimation depends on such values, since they influence not only convergence velocity, but also convergence itself (SILVEIRA JÚNIOR et al., 1992). The initial estimates for the parameters of the degradation model were obtained in the following manner:
i. The initial estimate for parameter a was defined
as being the degradability of the nutritive component analyzed in incubation time zero (t = 0);
ii. The potential degradability, parameter b , is
estimated by projecting the value of accumulative degradability (a + b), on the X axis, incubation times, till
it reaches an asymptotic value. Since the initial value of parameter a is known, by difference the initial value for
parameter b is estimated.
iii. To estimate the initial value of c it was used:
By replacing in expression (1), the initial estimated values for parameters a and b , the chosen value of Y and t , it is possible to estimate a initial value for parameter c .
The estimates of parameters a , b and c of
the model were obtained by the non-linear procedure (PROC NLIN) of the Statistical Analysis System software (SAS INSTITUTE, 1995), using the Gauss-Newton method (NETER et al., 1985), considering an initial estimate and seeking to minimize the sum square errors.
In fitting of the model by means of the SAS procedure, the estimate of the covariance matrix of the estimates of the parameterswas obtained and the terms of this matrix are expressed by:
2
2
2
a ab a b ac a c
combined
ab a b b bc b c
ac a c bc b c c
SE SE SE SE SE
QME
SE SE SE SE SE x
rQMDR
SE SE SE SE SE
where:SEa, SEb, SEcare the standard errors of the
estimates of parameters a, b, and c considering the nine
incubation times; ab, ace bcare the asymptotic
correlation among the parameters; QMDR is the mean
square of the regression deviation; r is the number of
animals where the incubation times were evaluated;
combined
QME is the approximate mean square error obtained
by a linear combination of the mean squares errors b and c of the variance analysis, according to Satterthwaite (1946).
The main diagonal of the covariance matrix furnishes the expressions of the variances adequate for the calculation of the asymptotic confidence intervals:
2 combined
a QME
V a SE
r QMDR
2 combined
b QME
V b SE
r QMDR
2 combined
c QME
V c SE
r QMDR
Degradability study of neutral detergent... 1187 Confidence intervals for parameters a, b and c were
calculated, respectively by:
, / 2
( comb error )
a t gl s a
, 2
( comb error )
b t gl s b
, 2
( comb error )
c t gl s c
where t (gl comb error, a/2) is the superior percentile a/2 of the
distribution t of Student and gl comberroris the Satterthwaite s
(1946) aproximation to degrees of freedom of the combined error. The nominal value for significance (a) was considered equal to 5%.
To verify the adequacy of the model at each cutting age, the F test for the lack of fit , or adherence test, presented by Hoffmann & Vieira (1998) and the determination coefficient (R2) were calculated.
RESULTS AND DISCUSSION
Hoffmann & Vieira (1998) considered that, in presence of heterogeneity of variances and residual autocorrelation, the generalized least-squares method is more efficient than the ordinary least-squares method.
Usually, in regression models, the basic assumptions are uncorrelated errors what is not appropriate when chronological data are studied. According to Morettin & Toloi (2004), the general characteristic of residual autocorrelation is a systematic variation of values in successive observations. When that happens, it is said that the residues are autocorrelated. In the present study a pattern of autocorrelated residuals was not detected.
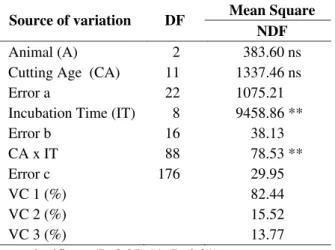
Mazzini et al. (2005) used the ratio between maximum and minimum variance, when studied growth curves in Hereford bovine males and described that, as the age of the animals increased, there was an increase in the variances of the corporal weights. The value of Fmax statistics (HARTLEY, 1950) was 1.316 non-significant for 22 degrees of freedom, suggesting, homogeneity of variances (Table 1). Since heterogeneity of variance nor autocorrelated residuals were observed, ordinary least-squares method was used. The summary of the analysis of variance are in Table 2.
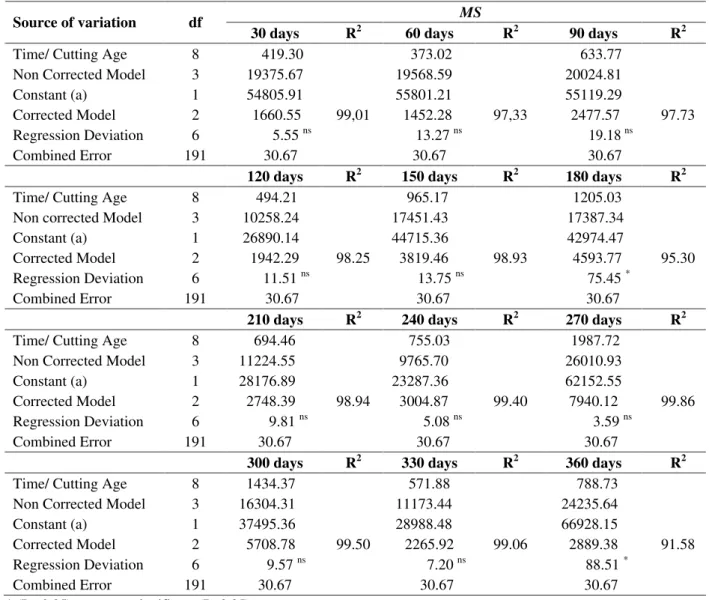
Since the interaction of the incubation time with cutting age (Table 2) was significant at 1% of probability, the model of Orskov & McDonald (1979) for each cutting age was used. The results are presented in Table 3.
TABLE 1 Mean Square Error (MSError) of the analysis of variance for coast-cross s neutral detergent fiber (NDF) in each incubation time.
TABLE 2 Mean Square for Neutral Detergent Fiber (NDF) of coastcross grass considering the model of the split-plot experiment.
The F test for the regression deviation (Table 3) was non-significant for most cutting ages, denoting a good fit of the model of Orskov & McDonald (1979), except for the cutting at 180 and 360 days, where the model did not fit to the data.
The maximum and minimum values of coefficient of determination of the regression equations for neutral detergent fiber were 99.86% and 97.33% for the cutting age of 270 and 60 days, respectively, (Table 3). These values were considered high indicating a good fit. For the cutting age of 180 e 360 days, where the model was not adjusted to the data, the coefficients of determination were 95.30% and 91.58%, respectively, lower than for the other ages.
ns non significant (P>0.05) ** (P<0.01).
Incubation
Time (h) DF MSError
0 hours 22 171.93
3 hours 22 174.01
6 hours 22 156.83
12 hours 22 145.31
24 hours 22 144.31
48 hours 22 132.18
72 hours 22 145.16
96 hours 22 148.55
120 hours 22 146.92
Mean Square Source of variation DF
NDF
Animal (A) 2 383.60 ns
Cutting Age (CA) 11 1337.46 ns
Error a 22 1075.21
Incubation Time (IT) 8 9458.86 **
Error b 16 38.13
CA x IT 88 78.53 **
Error c 176 29.95
VC 1 (%) 82.44
VC 2 (%) 15.52
SAVIAN, T. V. et al. 1188
TABLE 3 Mean square (MS) for neutral detergent fiber (NDF), studying the effect of time in each cutting age.
* (P< 0.05); ns - non significant (P>0.05).
The initial values (IV) for estimating the parameters of the neutral detergent fiber degradability equations and the number of iterations for the improvement in data fitting to be negligible, are in Table 4.
The maximum number of iterations in the convergence process was sixteen iterations for the cutting age of 360 days, where the fit of the model was not good. The minimum number was three iterations for the cutting performed at 30, 240 and 270 days.
Soluble fraction (parameter a), was estimated with
a greater precision when cutting was done at 90 days, and lower precision at 360 days being the difference of standard error of 29.11%. The potentially degradable insoluble
fraction (parameter b), was better estimated at the cutting
age of 210 days and worse at 90 days with a difference of 37.55% in the standard error. The degradation rate estimates (parameter c) were more precise at the cuttings of 180,
270 and 300 days and less precise at 360 days (Table 4). It can also be observed a decrease in the estimated value of the soluble fraction (parameter a ) and an
increase in the estimated value of parameter b with the
advanced age of the coast cross probably because the loss of water and the lignin complex strongly with the components of the cellular wall, reducing the immediately soluble fraction and increasing potentially degradable fraction.
MS
Source of variation df
30 days R2 60 days R2 90 days R2
Time/ Cutting Age 8 419.30 373.02 633.77
Non Corrected Model 3 19375.67 19568.59 20024.81
Constant (a) 1 54805.91 55801.21 55119.29
Corrected Model 2 1660.55 99,01 1452.28 97,33 2477.57 97.73
Regression Deviation 6 5.55 ns 13.27 ns 19.18 ns
Combined Error 191 30.67 30.67 30.67
120 days R2 150 days R2 180 days R2
Time/ Cutting Age 8 494.21 965.17 1205.03
Non corrected Model 3 10258.24 17451.43 17387.34
Constant (a) 1 26890.14 44715.36 42974.47
Corrected Model 2 1942.29 98.25 3819.46 98.93 4593.77 95.30 Regression Deviation 6 11.51 ns 13.75 ns 75.45 *
Combined Error 191 30.67 30.67 30.67
210 days R2 240 days R2 270 days R2
Time/ Cutting Age 8 694.46 755.03 1987.72
Non Corrected Model 3 11224.55 9765.70 26010.93
Constant (a) 1 28176.89 23287.36 62152.55
Corrected Model 2 2748.39 98.94 3004.87 99.40 7940.12 99.86
Regression Deviation 6 9.81 ns 5.08 ns 3.59 ns
Combined Error 191 30.67 30.67 30.67
300 days R2 330 days R2 360 days R2
Time/ Cutting Age 8 1434.37 571.88 788.73
Non Corrected Model 3 16304.31 11173.44 24235.64
Constant (a) 1 37495.36 28988.48 66928.15
Corrected Model 2 5708.78 99.50 2265.92 99.06 2889.38 91.58
Regression Deviation 6 9.57 ns 7.20 ns 88.51 *
Degradability study of neutral detergent... 1189
TABLE 4 Initial values (IV) and estimates of the parameters of the model of Orskov & McDonald (1979), with the respective corrected asymptotic standard errors (SE), residual mean square (RMS), number of iterations (U) and asymptotic 95% confidence interval of the estimates of the parameters (95% CI).
Treatment IV Estimates SE RMS U 95% CI
a 29.0130 28.6815 1.3416 [26.0331 ; 31.3299]
b 30.9870 29.7185 1.6790 [26.4042 ; 33.0328]
30 days
c 0.0370 0.0367 0.0063 5.5543 3 [0.0242 ; 0.0492]
a 28.5165 28.9609 1.4729 [26.0533 ; 31.8685]
b 31.4836 27.6353 1.6410 [24.3959 ; 30.8747]
60 days
c 0.0380 0.0484 0.0084 13.2651 9 [0.0319 ; 0.0649]
a 27.0769 27.5406 1.2220 [25.1284 ; 29.9528]
b 41.5737 39.3922 2.6246 [34.2112 ; 44.5732]
90 days
c 0.0230 0.0214 0.0045 19.1776 6 [0.0125 ; 0.0303]
a 13.0043 14.1924 1.3218 [11.5832 ; 16.8016]
b 34.9957 32.3127 1.7201 [28.9171 ; 35.7083]
120 days
c 0.0300 0.0340 0.0053 11.5098 7 [0.0232 ; 0.0448]
a 15.0631 15.6486 1.3506 [12.9825 ; 18.3147]
b 48.9369 44.9913 1.6663 [41.7020 ; 48.2806]
150 days
c 0.0320 0.0379 0.0045 13.7453 6 [0.0291 ; 0.0467]
a 15.8976 15.1209 1.2475 [12.6583 ; 17.5835]
b 56.1023 52.0035 2.2009 [47.6588 ; 56.3482]
180 days
c 0.0300 0.0245 0.0032 75.4503 8 [0.0183 ; 0.0307]
a 10.7825 10.0540 1.3991 [7.2922 ; 12.8158]
b 39.2174 38.0017 1.6390 [34.7662 ; 41.2371]
210 days
c 0.0420 0.0450 0.0063 9.8147 6 [0.0325 ; 0.0575]
a 9.3399 9.4201 1.2453 [6.9619 ; 11.8783]
b 41.6600 42.1538 2.2294 [37.7529 ; 46.5547]
240 days
c 0.0230 0.0242 0.0045 5.0853 3 [0.0154 ; 0.0330]
a 13.6122 13.0027 1.3179 [10.4012 ; 15.6042]
b 64.3878 65.4180 1.7309 [62.0012 ; 68.8348]
270 days
c 0.0330 0.0335 0.0032 3.5922 3 [0.0273 ; 0.0397]
a 7.3788 8.6906 1.2812 [6.1614 ; 11.2198]
b 57.6212 56.4347 1.8923 [52.6993 ; 60.1701]
300 days
c 0.030 0.0287 0.0032 9.5691 5 [0.0225 ; 0.0349]
a 14.3900 14.2655 1.3080 [11.6835 ; 16.8475]
b 35.6100 35.0765 1.7626 [31.5970 ; 38.5560]
330 days
c 0.0280 0.0321 0.0055 7.1997 4 [0.0213 ; 0.0429]
a 14.4224 18.1901 1.7238 [14.7873 ; 21.5929]
b 52.5776 42.5746 1.8630 [38.8971 ; 46.2521]
360 days
SAVIAN, T. V. et al. 1190
CONCLUSIONS
A good fit of the model to data of neutral detergent fiber degradability in the most cutting ages looks like a result. The cutting ages of the coast cross grass (Cynodon dactylon
x Cynodon nlemfunensis) influenced the degradability of
different fractions, benefiting early stages. In advanced cutting ages the parameters estimates were less precise.
BIBLIOGRAPHIC REFERENCES
AERTS, J. W.; BRABANDER, D. L.; COTTYN, B. G. Comparison of laboratory methods for predicting of the organic matter digestibility of forages. Animal Feed Science and Technology, Amsterdam, v. 2, p. 337-349, 1997. AGRICULTURAL AND FOOD RESERCH COUNCIL. Technical committee on responses to nutrients: nutritive requirements of ruminant animals: protein. Nutrition Abstracts and Reviews: series B, London, v. 62, n. 9, p. 65-71, Sept. 1992. CRAWFORD, R. J.; HOOVER JUNIOR, W. H.; SNIFFEN, C. J. Degradation of foodstuff nitrogen in the rumei vs. Nitrogen solubility in three solvents. Journal of Animal Science, Champaign, v. 46, n. 6, p. 1768-1775, May 1978. FERREIRA, D. F. Análises estatísticas por meio do Sisvar para o Windows versão 4.0. In: REUNIÃO ANUAL DA
REGIÃO BRASILEIRA DA SOCIEDADE
INTERNACIONAL DE BIOMETRIA, 45., 2000, São Carlos. Anais... São Carlos: UFSCar, 2000. p. 255-258.
GILL, J. L. Design and analysis of experiments in the animal and medical sciences. Ames: Iowa State University, 1987. v. 1, 411 p.
HARTLEY, H. O. The use of range in analysis of variance. Biometrika, Londres, v. 37, n. 3, p. 271-280, 1950. HOFFMANN, R.; VIEIRA, S. Análise de regressão: uma introdução à econometria. 3. ed. São Paulo: HUCITEC, 1998. 379 p.
MAZZINI, A. R. de A. et al. Curva de crescimento de novilhos Hereford: heterocedasticidade e resíduos autoregressivos. Ciência Rural, Santa Maria, v. 35, n. 2, p. 422-427, 2005.
MEHREZ, A. Z.; ORSKOV, E. R. A study of the artificial fibre bag technique for determining the digestibility of feeds in the rumen. Journal of Agricultural Science, Cambridge, v. 88, n. 3, p. 645-650, 1997.
MORETTIN, P. A.; TOLOI, C. M. de C. Previsão de séries temporais. 3. ed. São Paulo: Atual, 2004. 436 p.
NETER, J.; WASSERMAN, W.; KUTNER, M. H. Linear statistical models: regression, analysis of variance, and experimental design. 2. ed. Washington: R. D. Irwin, 1985. 1125 p. ORSKOV, E. R.; McDONALD, I. The estimation of protein degradability in the rumen from incubation measurements weighted according to rate of passage. Journal of Agricultural Science, Cambridge, v. 92, n. 2, p. 499-503, 1979. POOS-FLOYD, M.; KLOPFENSTEIN, T.; BRITTON, R. A. Evaluation of laboratory techniques for predicting ruminal protein degradation. Journal of Dairy Science, Champaign, v. 68, n. 4, p. 829-839, Apr. 1985.
QUINN, J. I.; WATH, J. G. van der; MYBURGH, S. Studies on the alimentary tract of merino sheep in South Africa: description of experimental technique. Journal of VeterinaryScience Animal Indian, Ondersteport, v. 11, n. 2, p. 341-360, 1938. REIS, S. T. dos. Valor nutricional de gramíneas tropicais em diferentes idades de corte. 2000. 99 p. Dissertação (Mestrado em Zootecnia) Universidade Federal de Lavras, Lavras, 2000.
RIBOLDI, J.; FERNANDEZ, D. W. X.; CASTRO, S. M. de J. Análise de observações simultâneas e medidas repetidas. In: REUNIÃO ANUAL DA REGIÃO BRASILEIRA INTERNACIONAL DE BIOMETRIA, 41., 1996, São José do Rio Preto. Resumos... São José do Rio Preto: UNESP, 1996. SAMPAIO, I. B. M. Métodos estatísticos aplicados à determinação de digestibilidade in situ. In: SIMPÓSIO INTERNACIONAL DE DIGESTIBILIDADE EM RUMINANTES, 1997, Lavras. Anais... Lavras: UFLA-FAEPE, 1997. p. 327.
SATTERTHWAITE, F. E. An approximate distribution of variance components. Biometrics, Washington, v. 2, n. 3, p. 110-114, 1946.
SAS INSTITUTE. SAS/ETSâ user s guide. Version 6.2. 2. ed. Cary, 1995.